Get More Information on Plant-based Water Market - Request Sample Report
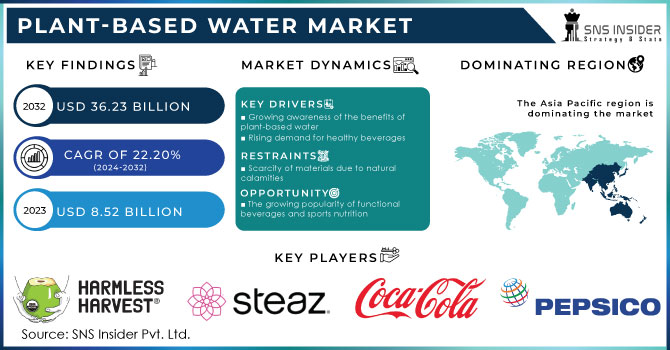
The Plant-based Water Market size was valued at USD 8.52 billion in 2023 and is expected to reach USD 36.23 billion by 2032 and grow at a CAGR of 22.20% over the forecast period of 2024-2032.
Plant-based water is an alternative to drinking water which provides a high amount of nutrition. The water can be harvested or treated in a number of ways depending on the type of plant. The beverage business has successfully dominated the world market thanks to its cutting-edge product flavors.
By product type, the market is segmented into coconut water, maple water, birch water, artichoke water, cactus water, and others. Coconut water is the leading segment, followed by maple water. Coconut water is a natural isotonic beverage that is high in electrolytes, such as potassium, magnesium, and calcium. It is also a good source of vitamins C and E. Coconut water is often used as a sports drink and to cure hangovers.
When pure maple tree sap is combined with water, maple water is produced that has a naturally earthy, delicious, and useful flavor. This water collects nutrients kept in the tree and provides hydration and nutrition that support the growth and renewal of trees throughout the spring season. Water makes up 96.5% of maple sap on average.
By application, the market is segmented into sports nutrition, functional beverages, and others. The sports nutrition segment is the leading segment, followed by functional beverages.
KEY DRIVERS
Growing awareness of the benefits of plant-based water
Rising demand for healthy beverages
Plant-based water can provide a significant amount of nutrition and serve as an alternative to common beverages. People are moving toward a healthier lifestyle as they become more conscious of their health. Since these waters are very low in calories and sugar content, and also contain minerals like electrolytes and antioxidants, plant-based waters are a great option for these customers. Plant-based products are low in saturated fat and cholesterol and high in vitamins, minerals, and antioxidants. The demand for water made from plant-based materials is rising in the market.
RESTRAIN
Scarcity of materials due to natural calamities
Sustainability challenges
The production of plant-based water can be harmful to the environment. Harvesting coconut water can harm coconut trees while producing maple water can necessitate a large amount of water. Validating birch sap is a difficult undertaking because it is only combined for a fortnight out of the year. Also, plant-based waters have more diverse distribution channels than carbonated beverages, which may limit the product market's expansion.
OPPORTUNITY
The growing popularity of functional beverages and sports nutrition
Plant-based waters are gaining popularity as a sports nutrition, and functional beverage as they include electrolytes, which can aid in rehydrating the body after activity. They're also low in sugar and calorie content, which is essential for athletes attempting to maintain health. During the forecasted period, there will be significant investment in the development of natural plant-based water that boosts immunity and in the quest for new plant water sources to provide consumers with new products that have new flavors.
CHALLENGES
Competition from traditional beverages
Traditional beverages, such as carbonated drinks, sodas, bottled water, sports drinks, and juices, are still the most popular beverages in the world. This means that plant-based waters are competing with well-established brands and products. All these traditional beverages are affordable substitutes for plant-based water can hamper the market growth.
Ukraine is a large producer of maple syrup, which is utilized in the production of maple water. The war could disrupt maple syrup production and supply, resulting in higher costs and limited availability of maple water. Many countries, including Ukraine, cultivate coconuts, artichokes, and cactus. However, the war may affect coconut harvesting and transportation, leading to higher prices and a decreased supply of coconut water. According to reports Cargill company, which reportedly has roughly $1.1 billion in investments and 2,500 employees in Russia, is "scaling back" its business activities and pausing investments while maintaining vital food and feed facilities.
The Recession can have a major impact on the market for plant-based waters as customers may have less disposable income to spend on these beverages. The disruption in the supply chain of coconuts, maple, and other materials, and rising labor & packaging costs have led to a decrease in the production of plant-based water. The yearly inflation rate for food and drink was 20% in 2023 according to the Office of National Statistics. Cereals and bread were the biggest contributors to the surge in food inflation, with average prices rising by 19.5% in the year to March 2023, indicating that the earlier predictions came true.
By type
Maple Water
Coconut Water
Artichoke Water
Cactus Water
Others
By Flavor Variant
Natural
Flavored
By Distribution Channels
Retail Stores
Cafes & Fitness Center
Online Sales
Others
By Application
Sports Nutrition
Functional beverages
Others.
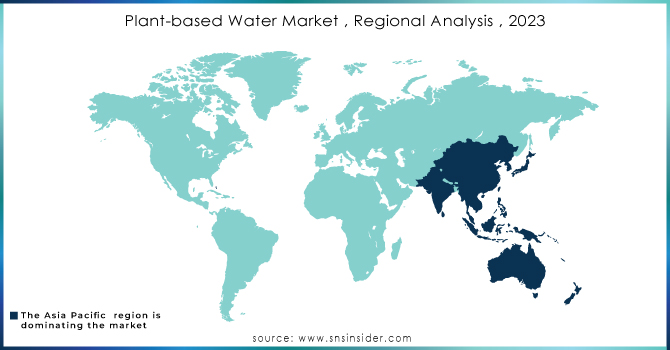
Asia Pacific is predicted to be the fastest-growing regional market owing to rising exports and domestic demand for plant-based water. Rapid increasing population and consumers' shift towards healthy lifestyles are driving the demand for plant-based drinks. The region has a significant market opportunity for branded and packed coconut water consumption which is neglected in countries such as China, Indonesia, India, and others.
North American region has a substantial growth which is attributed to the demand for sports drinks and functional water. Due to busy schedules and a shift in consumer preferences toward packaged food and beverages during the forecast period, packaged water consumption has increased in the U.S., Mexico, Canada, and other countries. Additionally, North America's enormous maple tree farming has led to the discovery of maple water manufacturing.
Europe is an emerging market for plant-based water as consumers are more inclined towards a healthy lifestyle and stringent regulations on beverages. Countries like the United Kingdom, Germany, and France have the most potential for birch water, birch trees are commonly tapped in Europe. Additionally, a new trend of plant-based products is driving the rise of this product market and is projected to continue during the forecast period.
Need any customization research on Plant-based Water Market - Enquiry Now
REGIONAL COVERAGE
North America
US
Canada
Mexico
Europe
Eastern Europe
Poland
Romania
Hungary
Turkey
Rest of Eastern Europe
Western Europe
Germany
France
UK
Italy
Spain
Netherlands
Switzerland
Austria
Rest of Western Europe
Asia Pacific
China
India
Japan
South Korea
Vietnam
Singapore
Australia
Rest of Asia Pacific
Middle East & Africa
Middle East
UAE
Egypt
Saudi Arabia
Qatar
Rest of Middle East
Africa
Nigeria
South Africa
Rest of Africa
Latin America
Brazil
Argentina
Colombia
Rest of Latin America
All Harmless Harv, Caliwater LLC, The Coca-Cola Company, Market Inc., DrinkSEVA, Happy Tree Group, Oviva Maple Water Company, PepsiCo Inc., Sibberi, Steaz, ARTY Water Company, and other key players are mentioned in the final report.
Coca-Cola Company- In 2023 Coca-Cola Beverages located in Botswana, a subsidiary of the Africa division, launched a cutting-edge manufacturing line and water treatment plant for P310 million (US$24.4 million) to greatly increase the factory's production capacity.
Caliwater LLC- In 2021 Caliwater, a cactus-based beverage, has announced retail expansion on the East Coast. Caliwater Cactus drinks are now available in Village Super Market, Inc.'s beverage space in two popular flavors Wild Prickly Pear and Ginger & Lime.
Report Attributes | Details |
Market Size in 2023 | US$ 8.52 Billion |
Market Size by 2032 | US$ 36.23 Billion |
CAGR | CAGR of 22.20 % From 2024 to 2032 |
Base Year | 2023 |
Forecast Period | 2024-2032 |
Historical Data | 2020-2022 |
Report Scope & Coverage | Market Size, Segments Analysis, Competitive Landscape, Regional Analysis, DROC & SWOT Analysis, Forecast Outlook |
Key Segments | • By Type (Maple Water, Coconut Water, Artichoke Water, Cactus Water, Others) • By Flavor Variant (Natural, Flavored) • By Distribution Channels (Online Sales, Retail Stores, Cafes, and fitness Centers) • By Application (sports nutrition, functional beverages, others) |
Regional Analysis/Coverage | North America (US, Canada, Mexico), Europe (Eastern Europe [Poland, Romania, Hungary, Turkey, Rest of Eastern Europe] Western Europe] Germany, France, UK, Italy, Spain, Netherlands, Switzerland, Austria, Rest of Western Europe]), Asia Pacific (China, India, Japan, South Korea, Vietnam, Singapore, Australia, Rest of Asia Pacific), Middle East & Africa (Middle East [UAE, Egypt, Saudi Arabia, Qatar, Rest of Middle East], Africa [Nigeria, South Africa, Rest of Africa], Latin America (Brazil, Argentina, Colombia Rest of Latin America) |
Company Profiles | All Harmless Harv, Caliwater LLC, The Coca-Cola Company, Market Inc., DrinkSEVA, Happy Tree Group, Oviva Maple Water Company, PepsiCo Inc., Sibberi, Steaz, ARTY Water Company |
Key Drivers | • Growing awareness of the benefits of plant-based water • Rising demand for healthy beverages |
Market Opportunity | • The growing popularity of functional beverages and sports nutrition |
Ans. The CAGR of the Plant-based Water Market over the forecast period is 22.20 %.
Ans. USD 8.52 billion is the projected value in 2023 for the Plant-based Water Market.
Ans. Asia Pacific is the fastest-growing region of the Plant-based Water Market.
Ans. Opportunities are the growing popularity of functional beverages and sports nutrition
Ans. USD 36.23 billion is the projected Plant-based Water Market size of the market by 2032.
TABLE OF CONTENT
1. Introduction
1.1 Market Definition
1.2 Scope
1.3 Research Assumptions
2. Research Methodology
3. Market Dynamics
3.1 Drivers
3.2 Restraints
3.3 Opportunities
3.4 Challenges
4. Impact Analysis
4.1 Impact of Russia- Ukraine War
4.2 Impact of Ongoing Recession
4.3. Introduction
4.3.1 Impact on Major Economies
4.3.1.1 US
4.3.1.2 Canada
4.3.1.3 Germany
4.3.1.4 France
4.3.1.5 United Kingdom
4.3.1.6 China
4.3.1.7 Japan
4.3.1.8 South Korea
4.3.1.9 Rest of the World
5. Value Chain Analysis
6. Porter’s 5 forces model
7. PEST Analysis
8. Plant-based Water Market, by Type
8.1 Maple Water
8.2 Coconut Water
8.3 Artichoke Water
8.4 Cactus Water
8.5 Others
9. Plant-based Water Market, by Flavor Variant
9.1 Natural
9.2 Flavored
10. Plant-based Water Market, by Distribution Channels
10.1 Retail Stores
10.2 Cafes & Fitness Center
10.3 Online Sales
11. Plant-based Water Market, by Application
11.1 sports nutrition
11.2 functional beverages
11.3 Others
12. Regional Analysis
12.1 Introduction
12.2 North America
12.2.1 North America Plant-based Water Market by Country
12.2.2 North America Plant-based Water Market by Type
12.2.3 North America Plant-based Water Market by Flavor Variant
12.2.4 North America Plant-based Water Market by Distribution Channels
12.2.5 North America Plant-based Water Market by Application
12.2.6 USA
12.2.6.1 USA Plant-based Water Market by Type
12.2.6.2 USA Plant-based Water Market by Flavor Variant
12.2.6.3 USA Plant-based Water Market by Distribution Channels
12.2.6.4 USA Plant-based Water Market by Application
12.2.7 Canada
12.2.7.1 Canada Plant-based Water Market by Type
12.2.7.2 Canada Plant-based Water Market by Flavor Variant
12.2.7.3 Canada Plant-based Water Market by Distribution Channels
12.2.7.4 Canada Plant-based Water Market by Application
12.2.8 Mexico
12.2.8.1 Mexico Plant-based Water Market by Type
12.2.8.2 Mexico Plant-based Water Market by Flavor Variant
12.2.8.3 Mexico Plant-based Water Market by Distribution Channels
12.2.8.4 Mexico Plant-based Water Market by Application
12.3 Europe
12.3.1 Eastern Europe
12.3.1.1 Eastern Europe Plant-based Water Market by Country
12.3.1.2 Eastern Europe Plant-based Water Market by Type
12.3.1.3 Eastern Europe Plant-based Water Market by Flavor Variant
12.3.1.4 Eastern Europe Plant-based Water Market by Distribution Channels
12.3.1.5 Eastern Europe Plant-based Water Market by Application
12.3.1.6 Poland
12.3.1.6.1 Poland Plant-based Water Market by Type
12.3.1.6.2 Poland Plant-based Water Market by Flavor Variant
12.3.1.6.3 Poland Plant-based Water Market by Distribution Channels
12.3.1.6.4 Poland Plant-based Water Market by Application
12.3.1.7 Romania
12.3.1.7.1 Romania Plant-based Water Market by Type
12.3.1.7.2 Romania Plant-based Water Market by Flavor Variant
12.3.1.7.3 Romania Plant-based Water Market by Distribution Channels
12.3.1.7.4 Romania Plant-based Water Market by Application
12.3.1.8 Hungary
12.3.1.8.1 Hungary Plant-based Water Market by Type
12.3.1.8.2 Hungary Plant-based Water Market by Flavor Variant
12.3.1.8.3 Hungary Plant-based Water Market by Distribution Channels
12.3.1.8.4 Hungary Plant-based Water Market by Application
12.3.1.9 turkey
12.3.1.9.1 Turkey Plant-based Water Market by Type
12.3.1.9.2 Turkey Plant-based Water Market by Flavor Variant
12.3.1.9.3 Turkey Plant-based Water Market by Distribution Channels
12.3.1.9.4 Turkey Plant-based Water Market by Application
12.3.1.10 Rest of Eastern Europe
12.3.1.10.1 Rest of Eastern Europe Plant-based Water Market by Type
12.3.1.10.2 Rest of Eastern Europe Plant-based Water Market by Flavor Variant
12.3.1.10.3 Rest of Eastern Europe Plant-based Water Market by Distribution Channels
12.3.1.10.4 Rest of Eastern Europe Plant-based Water Market by Application
12.3.2 Western Europe
12.3.2.1 Western Europe Plant-based Water Market by Country
12.3.2.2 Western Europe Plant-based Water Market by Type
12.3.2.3 Western Europe Plant-based Water Market by Flavor Variant
12.3.2.4 Western Europe Plant-based Water Market by Distribution Channels
12.3.2.5 Western Europe Plant-based Water Market by Application
12.3.2.6 Germany
12.3.2.6.1 Germany Plant-based Water Market by Type
12.3.2.6.2 Germany Plant-based Water Market by Flavor Variant
12.3.2.6.3 Germany Plant-based Water Market by Distribution Channels
12.3.2.6.4 Germany Plant-based Water Market by Application
12.3.2.7 France
12.3.2.7.1 France Plant-based Water Market by Type
12.3.2.7.2 France Plant-based Water Market by Flavor Variant
12.3.2.7.3 France Plant-based Water Market by Distribution Channels
12.3.2.7.4 France Plant-based Water Market by Application
12.3.2.8 UK
12.3.2.8.1 UK Plant-based Water Market by Type
12.3.2.8.2 UK Plant-based Water Market by Flavor Variant
12.3.2.8.3 UK Plant-based Water Market by Distribution Channels
12.3.2.8.4 UK Plant-based Water Market by Application
12.3.2.9 Italy
12.3.2.9.1 Italy Plant-based Water Market by Type
12.3.2.9.2 Italy Plant-based Water Market by Flavor Variant
12.3.2.9.3 Italy Plant-based Water Market by Distribution Channels
12.3.2.9.4 Italy Plant-based Water Market by Application
12.3.2.10 Spain
12.3.2.10.1 Spain Plant-based Water Market by Type
12.3.2.10.2 Spain Plant-based Water Market by Flavor Variant
12.3.2.10.3 Spain Plant-based Water Market by Distribution Channels
12.3.2.10.4 Spain Plant-based Water Market by Application
12.3.2.11 Netherlands
12.3.2.11.1 Netherlands Plant-based Water Market by Type
12.3.2.11.2 Netherlands Plant-based Water Market by Flavor Variant
12.3.2.11.3 Netherlands Plant-based Water Market by Distribution Channels
12.3.2.11.4 Netherlands Plant-based Water Market by Application
12.3.2.12 Switzerland
12.3.2.12.1 Switzerland Plant-based Water Market by Type
12.3.2.12.2 Switzerland Plant-based Water Market by Flavor Variant
12.3.2.12.3 Switzerland Plant-based Water Market by Distribution Channels
12.3.2.12.4 Switzerland Plant-based Water Market by Application
12.3.2.13 Austria
12.3.2.13.1 Austria Plant-based Water Market by Type
12.3.2.13.2 Austria Plant-based Water Market by Flavor Variant
12.3.2.13.3 Austria Plant-based Water Market by Distribution Channels
12.3.2.13.4 Austria Plant-based Water Market by Application
12.3.2.14 Rest of Western Europe
12.3.2.14.1 Rest of Western Europe Plant-based Water Market by Type
12.3.2.14.2 Rest of Western Europe Plant-based Water Market by Flavor Variant
12.3.2.14.3 Rest of Western Europe Plant-based Water Market by Distribution Channels
12.3.2.14.4 Rest of Western Europe Plant-based Water Market by Application
12.4 Asia-Pacific
12.4.1 Asia Pacific Plant-based Water Market by Country
12.4.2 Asia Pacific Plant-based Water Market by Type
12.4.3 Asia Pacific Plant-based Water Market by Flavor Variant
12.4.4 Asia Pacific Plant-based Water Market by Distribution Channels
12.4.5 Asia Pacific Plant-based Water Market by Application
12.4.6 China
12.4.6.1 China Plant-based Water Market by Type
12.4.6.2 China Plant-based Water Market by Flavor Variant
12.4.6.3 China Plant-based Water Market by Distribution Channels
12.4.6.4 China Plant-based Water Market by Application
12.4.7 India
12.4.7.1 India Plant-based Water Market by Type
12.4.7.2 India Plant-based Water Market by Flavor Variant
12.4.7.3 India Plant-based Water Market by Distribution Channels
12.4.7.4 India Plant-based Water Market by Application
12.4.8 Japan
12.4.8.1 Japan Plant-based Water Market by Type
12.4.8.2 Japan Plant-based Water Market by Flavor Variant
12.4.8.3 Japan Plant-based Water Market by Distribution Channels
12.4.8.4 Japan Plant-based Water Market by Application
12.4.9 South Korea
12.4.9.1 South Korea Plant-based Water Market by Type
12.4.9.2 South Korea Plant-based Water Market by Flavor Variant
12.4.9.3 South Korea Plant-based Water Market by Distribution Channels
12.4.9.4 South Korea Plant-based Water Market by Application
12.4.10 Vietnam
12.4.10.1 Vietnam Plant-based Water Market by Type
12.4.10.2 Vietnam Plant-based Water Market by Flavor Variant
12.4.10.3 Vietnam Plant-based Water Market by Distribution Channels
12.4.10.4 Vietnam Plant-based Water Market by Application
12.4.11 Singapore
12.4.11.1 Singapore Plant-based Water Market by Type
12.4.11.2 Singapore Plant-based Water Market by Flavor Variant
12.4.11.3 Singapore Plant-based Water Market by Distribution Channels
12.4.11.4 Singapore Plant-based Water Market by Application
12.4.12 Australia
12.4.12.1 Australia Plant-based Water Market by Type
12.4.12.2 Australia Plant-based Water Market by Flavor Variant
12.4.12.3 Australia Plant-based Water Market by Distribution Channels
12.4.12.4 Australia Plant-based Water Market by Application
12.4.13 Rest of Asia-Pacific
12.4.13.1 Rest of Asia-Pacific Plant-based Water Market by Type
12.4.13.2 Rest of Asia-Pacific Plant-based Water Market by Flavor Variant
12.4.13.3 Rest of Asia-Pacific Plant-based Water Market by Distribution Channels
12.4.13.4 Rest of Asia-Pacific Plant-based Water Market by Application
12.5 Middle East & Africa
12.5.1 Middle East
12.5.1.1 Middle East Plant-based Water Market by Country
12.5.1.2 Middle East Plant-based Water Market by Type
12.5.1.3 Middle East Plant-based Water Market by Flavor Variant
12.5.1.4 Middle East Plant-based Water Market by Distribution Channels
12.5.1.5 Middle East Plant-based Water Market by Application
12.5.1.6 UAE
12.5.1.6.1 UAE Plant-based Water Market by Type
12.5.1.6.2 UAE Plant-based Water Market by Flavor Variant
12.5.1.6.3 UAE Plant-based Water Market by Distribution Channels
12.5.1.6.4 UAE Plant-based Water Market by Application
12.5.1.7 Egypt
12.5.1.7.1 Egypt Plant-based Water Market by Type
12.5.1.7.2 Egypt Plant-based Water Market by Flavor Variant
12.5.1.7.3 Egypt Plant-based Water Market by Distribution Channels
12.5.1.7.4 Egypt Plant-based Water Market by Application
12.5.1.8 Saudi Arabia
12.5.1.8.1 Saudi Arabia Plant-based Water Market by Type
12.5.1.8.2 Saudi Arabia Plant-based Water Market by Flavor Variant
12.5.1.8.3 Saudi Arabia Plant-based Water Market by Distribution Channels
12.5.1.8.4 Saudi Arabia Plant-based Water Market by Application
12.5.1.9 Qatar
12.5.1.9.1 Qatar Plant-based Water Market by Type
12.5.1.9.2 Qatar Plant-based Water Market by Flavor Variant
12.5.1.9.3 Qatar Plant-based Water Market by Distribution Channels
12.5.1.9.4 Qatar Plant-based Water Market by Application
12.5.1.10 Rest of Middle East
12.5.1.10.1 Rest of Middle East Plant-based Water Market by Type
12.5.1.10.2 Rest of Middle East Plant-based Water Market by Flavor Variant
12.5.1.10.3 Rest of Middle East Plant-based Water Market by Distribution Channels
12.5.1.10.4 Rest of Middle East Plant-based Water Market by Application
12.5.2. Africa
12.5.2.1 Africa Plant-based Water Market by Country
12.5.2.2 Africa Plant-based Water Market by Type
12.5.2.3 Africa Plant-based Water Market by Flavor Variant
12.5.2.4 Africa Plant-based Water Market by Distribution Channels
12.5.2.5 Africa Plant-based Water Market by Application
12.5.2.6 Nigeria
12.5.2.6.1 Nigeria Plant-based Water Market by Type
12.5.2.6.2 Nigeria Plant-based Water Market by Flavor Variant
12.5.2.6.3 Nigeria Plant-based Water Market by Distribution Channels
12.5.2.6.4 Nigeria Plant-based Water Market by Application
12.5.2.7 South Africa
12.5.2.7.1 South Africa Plant-based Water Market by Type
12.5.2.7.2 South Africa Plant-based Water Market by Flavor Variant
12.5.2.7.3 South Africa Plant-based Water Market by Distribution Channels
12.5.2.7.4 South Africa Plant-based Water Market by Application
12.5.2.8 Rest of Africa
12.5.2.8.1 Rest of Africa Plant-based Water Market by Type
12.5.2.8.2 Rest of Africa Plant-based Water Market by Flavor Variant
12.5.2.8.3 Rest of Africa Plant-based Water Market by Distribution Channels
12.5.2.8.4 Rest of Africa Plant-based Water Market by Application
12.6. Latin America
12.6.1 Latin America Plant-based Water Market by Country
12.6.2 Latin America Plant-based Water Market by Type
12.6.3 Latin America Plant-based Water Market by Flavor Variant
12.6.4 Latin America Plant-based Water Market by Distribution Channels
12.6.5 Latin America Plant-based Water Market by Application
12.6.6 Brazil
12.6.6.1 Brazil Plant-based Water Market by Type
12.6.6.2 Brazil Plant-based Water Market by Flavor Variant
12.6.6.3 Brazil Plant-based Water Market by Distribution Channels
12.6.6.4 Brazil Plant-based Water Market by Application
12.6.7 Argentina
12.6.7.1 Argentina Plant-based Water Market by Type
12.6.7.2 Argentina Plant-based Water Market by Flavor Variant
12.6.7.3 Argentina Plant-based Water Market by Distribution Channels
12.6.7.4 Argentina Plant-based Water Market by Application
12.6.8 Colombia
12.6.8.1 Colombia Plant-based Water Market by Type
12.6.8.2 Colombia Plant-based Water Market by Flavor Variant
12.6.8.3 Colombia Plant-based Water Market by Distribution Channels
12.6.8.4 Colombia Plant-based Water Market by Application
12.6.9 Rest of Latin America
12.6.9.1 Rest of Latin America Plant-based Water Market by Type
12.6.9.2 Rest of Latin America Plant-based Water Market by Flavor Variant
12.6.9.3 Rest of Latin America Plant-based Water Market by Distribution Channels
12.6.9.4 Rest of Latin America Plant-based Water Market by Application
13. Company Profile
13.1 The Coca-Cola Company
13.1.1 Company Overview
13.1.2 Financials
13.1.3 Products/ Services Offered
13.1.4 SWOT Analysis
13.1.5 The SNS View
13.2 Happy Tree Group
13.2.1 Company Overview
13.2.2 Financials
13.2.3 Products/ Services Offered
13.2.4 SWOT Analysis
13.2.5 The SNS View
13.3 Market Inc.
13.3.1 Company Overview
13.3.2 Financials
13.3.3 Products/ Services Offered
13.3.4 SWOT Analysis
13.3.5 The SNS View
13.4 DrinkSEVA
13.4 Company Overview
13.4.2 Financials
13.4.3 Products/ Services Offered
13.4.4 SWOT Analysis
13.4.5 The SNS View
13.5 Shenzhen Mindray Bio-Medical Electronics Co., Ltd.
13.5.1 Company Overview
13.5.2 Financials
13.5.3 Products/ Services Offered
13.5.4 SWOT Analysis
13.5.5 The SNS View
13.6 All Harmless Harv
13.6.1 Company Overview
13.6.2 Financials
13.6.3 Products/ Services Offered
13.6.4 SWOT Analysis
13.6.5 The SNS View
13.7 Caliwater LLC
13.7.1 Company Overview
13.7.2 Financials
13.7.3 Products/ Services Offered
13.7.4 SWOT Analysis
13.7.5 The SNS View
13.8 Alvo Medical
13.8.1 Company Overview
13.8.2 Financials
13.8.3 Products/ Services Offered
13.8.4 SWOT Analysis
13.8.5 The SNS View
13.9 Oviva Maple Water Company
13.9.1 Company Overview
13.9.2 Financials
13.9.3 Products/ Services Offered
13.9.4 SWOT Analysis
13.9.5 The SNS View
13.10 PepsiCo Inc.
13.10.1 Company Overview
13.10.2 Financials
13.10.3 Products/ Services Offered
13.10.4 SWOT Analysis
13.10.5 The SNS View
13.11 Sibberi
13.11.1 Company Overview
13.11.2 Financials
13.11.3 Products/ Services Offered
13.11.4 SWOT Analysis
13.11.5 The SNS View
13.12 ARTY Water Company
13.12.1 Company Overview
13.12.2 Financials
13.12.3 Products/ Services Offered
13.12.4 SWOT Analysis
13.12.5 The SNS View
14. Competitive Landscape
14.1 Competitive Benchmarking
14.2 Market Share Analysis
14.3 Recent Developments
14.3.1 Industry News
14.3.2 Company News
14.3.3 Mergers & Acquisitions
15. USE Cases and Best Practices
16. Conclusion
An accurate research report requires proper strategizing as well as implementation. There are multiple factors involved in the completion of good and accurate research report and selecting the best methodology to compete the research is the toughest part. Since the research reports we provide play a crucial role in any company’s decision-making process, therefore we at SNS Insider always believe that we should choose the best method which gives us results closer to reality. This allows us to reach at a stage wherein we can provide our clients best and accurate investment to output ratio.
Each report that we prepare takes a timeframe of 350-400 business hours for production. Starting from the selection of titles through a couple of in-depth brain storming session to the final QC process before uploading our titles on our website we dedicate around 350 working hours. The titles are selected based on their current market cap and the foreseen CAGR and growth.
The 5 steps process:
Step 1: Secondary Research:
Secondary Research or Desk Research is as the name suggests is a research process wherein, we collect data through the readily available information. In this process we use various paid and unpaid databases which our team has access to and gather data through the same. This includes examining of listed companies’ annual reports, Journals, SEC filling etc. Apart from this our team has access to various associations across the globe across different industries. Lastly, we have exchange relationships with various university as well as individual libraries.
Step 2: Primary Research
When we talk about primary research, it is a type of study in which the researchers collect relevant data samples directly, rather than relying on previously collected data. This type of research is focused on gaining content specific facts that can be sued to solve specific problems. Since the collected data is fresh and first hand therefore it makes the study more accurate and genuine.
We at SNS Insider have divided Primary Research into 2 parts.
Part 1 wherein we interview the KOLs of major players as well as the upcoming ones across various geographic regions. This allows us to have their view over the market scenario and acts as an important tool to come closer to the accurate market numbers. As many as 45 paid and unpaid primary interviews are taken from both the demand and supply side of the industry to make sure we land at an accurate judgement and analysis of the market.
This step involves the triangulation of data wherein our team analyses the interview transcripts, online survey responses and observation of on filed participants. The below mentioned chart should give a better understanding of the part 1 of the primary interview.
Part 2: In this part of primary research the data collected via secondary research and the part 1 of the primary research is validated with the interviews from individual consultants and subject matter experts.
Consultants are those set of people who have at least 12 years of experience and expertise within the industry whereas Subject Matter Experts are those with at least 15 years of experience behind their back within the same space. The data with the help of two main processes i.e., FGDs (Focused Group Discussions) and IDs (Individual Discussions). This gives us a 3rd party nonbiased primary view of the market scenario making it a more dependable one while collation of the data pointers.
Step 3: Data Bank Validation
Once all the information is collected via primary and secondary sources, we run that information for data validation. At our intelligence centre our research heads track a lot of information related to the market which includes the quarterly reports, the daily stock prices, and other relevant information. Our data bank server gets updated every fortnight and that is how the information which we collected using our primary and secondary information is revalidated in real time.
Step 4: QA/QC Process
After all the data collection and validation our team does a final level of quality check and quality assurance to get rid of any unwanted or undesired mistakes. This might include but not limited to getting rid of the any typos, duplication of numbers or missing of any important information. The people involved in this process include technical content writers, research heads and graphics people. Once this process is completed the title gets uploader on our platform for our clients to read it.
Step 5: Final QC/QA Process:
This is the last process and comes when the client has ordered the study. In this process a final QA/QC is done before the study is emailed to the client. Since we believe in giving our clients a good experience of our research studies, therefore, to make sure that we do not lack at our end in any way humanly possible we do a final round of quality check and then dispatch the study to the client.
Botanical Supplements Market Size was esteemed at USD 27.24 billion out of 2022 and is supposed to arrive at USD 56.03 billion by 2030, and develop at a CAGR of 9.43% over the forecast period 2023-2030.
The Mannitol Market Size was esteemed at USD 398.62 million out of 2022 and is supposed to arrive at USD 584.47 million by 2030, and develop at a CAGR of 4.9% over the forecast period 2023-2030.
The Black Tea Extracts Market Size was esteemed at USD 123.21 million out of 2022 and is supposed to arrive at USD 176.57 million by 2030 and develop at a CAGR of 4.6% over the forecast period 2023-2030.
L-Carnitine Market Size was esteemed at USD 189.60 million out of 2022 and is supposed to arrive at USD 295.20 million by 2030, and develop at a CAGR of 5.69% over the forecast period 2023-2030.
Alcoholic Beverage Market Size was esteemed at USD 1.41 trillion out of 2022 and is supposed to arrive at USD 1.81 trillion by 2030 and develop at a CAGR of 3.16% over the forecast period 2023-2030.
The Smoke Ingredients for Food Market size was USD 690.5 million in 2022 and is expected to Reach USD 1027.9 million by 2030 and grow at a CAGR of 5.1% over the forecast period of 2023-2030.
Hi! Click one of our member below to chat on Phone