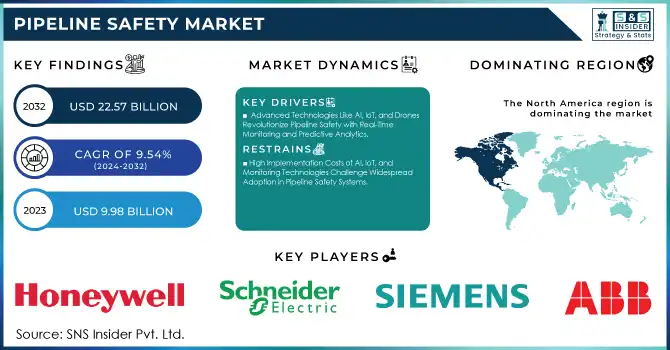
The Pipeline Safety Market was valued at USD 9.98 billion in 2023 and is expected to reach USD 22.57 billion by 2032, growing at a CAGR of 9.54% from 2024-2032.
Get more information on Pipeline Safety Market - Request Free Sample Report
The Pipeline Safety Market is growing rapidly because of the global demand for energy and the rapid development of pipeline networks. With increased scale and complexity in pipeline systems, the leakage, spill, and accident risks are becoming a pressing issue. In 2023, the U.S. alone experienced 8,140 pipeline incidents over 13 years, resulting in 164 deaths, 737 injuries, 1,135 fires, 392 explosions, 46,463 evacuations, and USD 7.57 billion in property damage. These alarming statistics have prompted governments and private operators to implement stringent safety measures. The emphasis on safety is further enhanced through the integration of advanced technologies, such as IoT, AI, and big data analytics, to monitor and perform predictive maintenance in real time to ensure the secure and efficient transport of energy resources.
The need for pipeline safety measures is increasingly growing as sectors tackle regulatory adherence and operational threats in essential infrastructure. As a reaction, operators are utilizing sophisticated tools such as SCADA systems, intelligent leak detection equipment, and automated shutdown systems, all aimed at improving safety and minimizing downtime. In March 2024, Sonatrach and Huawei presented a smart pipeline inspection solution at MWC Barcelona, highlighting the industry's transition to advanced technologies. Furthermore, the worldwide shift towards renewable energy, such as hydrogen and biofuel pipeline, presents distinct safety needs, generating chances for customized solutions for these emerging energy forms. These developments are crucial as sectors adjust to changing safety regulations and address the issues presented by both established and new energy systems.
The growth prospects in the pipeline safety market are influenced by the integration of advanced technologies that offer more intelligent and robust infrastructure. Examples of innovations that are transforming pipeline safety include predictive maintenance driven by machine learning and secure data tracking utilizing blockchain. With the rising global demand for new energy infrastructure, the requirement for flexible and scalable safety solutions will create new opportunities for market growth in the years ahead. These innovations, centered around safety and efficiency, are projected to propel the market ahead, as operators pursue state-of-the-art technologies to satisfy increasing operational and regulatory requirements.
Drivers
Advanced Technologies Like AI, IoT, and Drones Revolutionize Pipeline Safety with Real-Time Monitoring and Predictive Analytics
The incorporation of advanced technologies revolutionizes pipeline safety, providing improved monitoring and operational effectiveness. Cutting-edge sensors and IoT-integrated systems offer real-time information, facilitating the rapid identification of irregularities like leaks or fluctuations in pressure. Predictive analytics powered by AI allows businesses to foresee possible failures and tackle them in advance, reducing risks and downtime. Furthermore, drones fitted with thermal imaging and high-resolution cameras enable remote inspection of pipelines in difficult landscapes. These advancements enhance safety while also lowering maintenance expenses and environmental hazards. As technological advancements progress, the integration of these solutions is increasingly essential for businesses seeking to meet strict safety standards and improve their overall pipeline infrastructure management.
Growing Cybersecurity Threats Drive Urgent Need to Protect Digitized Pipeline Infrastructure with Advanced Security Measures and Regulations
As pipeline operations undergo swift digitization, the threat of cyberattacks targeting essential infrastructure has notably increased. Cybercriminals are focusing on pipeline systems to interfere with operations, acquire confidential information, or extort ransoms, resulting in increased worries regarding cybersecurity. The incorporation of digital technologies, like SCADA systems and IoT devices, has enhanced efficiency but also introduced weaknesses that malicious individuals can take advantage of. To reduce these risks, businesses are implementing sophisticated cybersecurity strategies, such as encryption, two-factor authentication, and AI-driven threat identification systems. Furthermore, authorities and regulatory agencies are implementing tougher regulations to guarantee the robustness of pipeline systems against cyber risks. With the increasing frequency and complexity of cyberattacks, emphasizing cybersecurity is essential for maintaining the safety, reliability, and continuous operation of pipeline systems worldwide.
Restraints
High Implementation Costs of AI, IoT, and Monitoring Technologies Challenge Widespread Adoption in Pipeline Safety Systems
Implementing cutting-edge safety technologies like AI, IoT systems, and real-time monitoring tools can be extremely costly for numerous companies in the pipeline sector. The upfront capital needed to buy, set up, and incorporate these systems into current infrastructure can put pressure on budgets, especially for small and medium-sized businesses. Additionally, the requirement for continuous maintenance, software upgrades, and trained staff to run and oversee these systems increases the total financial load. Consequently, certain organizations might hesitate to fully adopt these solutions, despite the long-term safety and operational advantages they provide. The significant expense of adoption could impede the broad deployment of cutting-edge safety technologies, possibly obstructing attempts to enhance pipeline safety standards and meet changing regulatory obligations.
Complex Integration of New Technologies with Legacy Pipeline Systems Creates Challenges in Adopting Advanced Safety Solutions
Integrating advanced safety technologies with existing pipeline infrastructure presents significant technical challenges, often resulting in extended implementation timelines. The legacy systems currently in use may not be compatible with the latest AI, IoT, and monitoring tools, requiring costly and complex adjustments to bridge the gaps. This process demands skilled technicians, specialized knowledge, and careful planning to avoid operational disruptions. Additionally, these integration efforts can cause downtime, reducing pipeline efficiency and potentially affecting productivity. As companies look to modernize their safety measures, the challenge of aligning new technology with outdated systems can delay the transition, creating a reluctance to invest in the necessary upgrades. This technical complexity adds a layer of difficulty in adopting and optimizing pipeline safety solutions, particularly for operators with limited resources or those managing large, geographically dispersed networks.
By Service
In 2023, the Repair and Maintenance segment dominated the Pipeline Safety Market with the highest revenue share of approximately 33%. This dominance can be attributed to the continuous need for maintaining the integrity of aging pipelines and mitigating the risks associated with operational wear and tear. As pipelines often face physical stress, corrosion, and potential leaks, regular repairs and maintenance are critical to ensuring safe and uninterrupted service. Additionally, the high costs associated with pipeline failures or environmental damage have further driven investments in repair and maintenance services to avoid catastrophic events.
The Pipeline Integrity Management segment is projected to experience the fastest growth at a CAGR of 12.02% from 2024 to 2032. This surge in demand is primarily driven by the increasing adoption of advanced monitoring and diagnostic technologies aimed at assessing pipeline conditions proactively. As operators seek to prevent costly downtime and enhance operational efficiency, the need for comprehensive integrity management programs, including real-time data collection and predictive analytics, has become essential. Furthermore, the rising regulatory pressures to ensure pipeline safety and compliance are accelerating the adoption of PIM solutions, making it a key growth area in the pipeline safety market.
By Solution
In 2023, the Natural Gas segment held the largest revenue share of approximately 45% in the Pipeline Safety Market. This dominance can be attributed to the growing demand for natural gas as a cleaner alternative to coal and oil, driving significant investments in pipeline infrastructure for transportation. As natural gas consumption rises globally, ensuring the safety of extensive pipeline networks becomes a top priority to prevent accidents, leaks, and environmental risks. The segment's growth is further supported by the critical need to upgrade aging pipelines and enhance monitoring technologies, ensuring the reliable and secure delivery of natural gas.
The Refined Products segment is expected to experience the fastest growth, with a projected CAGR of 12.48% from 2024 to 2032. This growth is driven by the increasing demand for refined products, such as gasoline, diesel, and jet fuel, as global transportation and industrial activities expand. As refined product pipelines are often more complex and subject to stringent safety regulations, the need for advanced safety solutions to prevent leaks, contamination, and catastrophic failures is intensifying. Additionally, the expansion of the global supply chain for refined products, along with rising safety concerns, is propelling investments in more advanced safety technologies, fueling the rapid growth of this segment.
By Vertical
In 2023, the Pipeline Monitoring System segment captured the largest revenue share of approximately 29% in the Pipeline Safety Market. This dominance is largely due to the increasing need for real-time monitoring of pipeline conditions to prevent accidents and ensure operational efficiency. As pipelines are vital for transporting oil, gas, and other essential resources, companies are investing heavily in advanced monitoring systems to detect leaks, pressure changes, and potential threats early. These systems significantly reduce the risk of catastrophic failures, enhance safety protocols, and help meet regulatory compliance, driving their widespread adoption.
The SCADA for Pipeline segment is expected to grow at the fastest CAGR of 12.21% from 2024 to 2032. The growth is fueled by the increasing digitization of pipeline operations and the need for more integrated control systems that can remotely manage and monitor pipeline functions. SCADA systems allow operators to efficiently track and control pipeline conditions across vast networks, improving decision-making and reducing downtime. With the rise of automation and the need for enhanced cybersecurity, SCADA technology is becoming indispensable for maintaining safe and efficient pipeline operations, positioning it for rapid growth in the coming years.
Regional Analysis
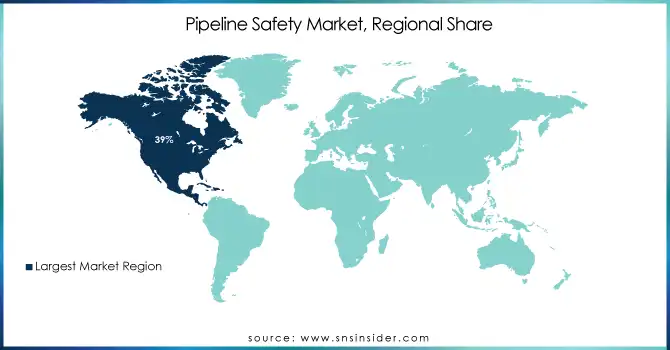
In 2023, North America dominated the Pipeline Safety Market with the highest revenue share of approximately 39%. This dominance is driven by the region's well-established pipeline infrastructure, particularly in the oil and gas sector, which necessitates robust safety measures. Additionally, stringent safety regulations and a strong focus on environmental protection have compelled companies to invest heavily in advanced pipeline safety technologies. The region’s significant oil and gas production, combined with its increasing focus on infrastructure upgrades and modernization, has further solidified its leadership in the market.
The Asia Pacific region is expected to grow at the fastest CAGR of 12.24% from 2024 to 2032. This growth can be attributed to the rapid industrialization, urbanization, and rising energy demand across the region, particularly in countries like China, India, and Japan. As the need for efficient and secure pipeline infrastructure intensifies, governments and companies are prioritizing investments in safety technologies to mitigate risks associated with the expanding pipeline networks. Furthermore, the region’s efforts to strengthen regulatory frameworks and improve energy security are fueling the accelerated adoption of pipeline safety solutions.
Need any customization research on Pipeline Safety Market - Enquiry Now
Key Players
ABB (ABB Ability Pipeline Integrity Management, Smart Pigging Systems)
Siemens AG (Pipeline Monitoring Systems, SCADA Systems)
Schneider Electric (EcoStruxure™ Pipeline SCADA, Smart Gas Management Solutions)
Baker Hughes (Pipeline Inspection Services, Leak Detection Systems)
Honeywell (Pipeline Leak Detection Solutions, Industrial Cybersecurity)
Huawei Technologies (Smart Pipeline Monitoring, IoT-based Asset Management Solutions)
AVEVA (AVEVA Pipeline Management, Smart Asset Monitoring)
PSI AG (Pipeline Leak Detection, Gas Pipeline Management Systems)
BAE Systems (Pipeline Integrity Management, Surveillance Systems)
TransCanada (Pipeline Control Systems, Integrity Management)
Atmos International (Leak Detection System, Flow Monitoring System)
Clampon AS (Pipeline Leak Detection, Clamp-on Ultrasonic Flow Meters)
FFT (Fiber Optic Pipeline Monitoring, Security Solutions)
Perma-Pipe (Pipe-in-Pipe Systems, Corrosion Protection Solutions)
Senstar (Pipeline Security Systems, Fence Intrusion Detection)
Syrinix (Smart Pipeline Monitoring, Pressure and Flow Measurement)
RADIOBARRIER (Intrusion Detection Systems, Environmental Monitoring)
Pure Technologies (SmartBall Leak Detection, Pipeline Inspection)
C-Fer Technologies (Smart Pigging, Pipeline Inspection Services)
Total Safety (Pipeline Safety and Compliance Solutions, Safety Instrumented Systems)
Krohne Group (Flow Meters for Pipeline Monitoring, Process Automation Solutions)
PLM CAT (Pipeline Leak Detection, SCADA Systems)
Leater (Gas Detection Systems, Security Systems for Pipelines)
TTK (Pipeline Inspection Services, Remote Monitoring Systems)
General Electric (Pipeline Inspection, Asset Performance Management)
Thales Group (Pipeline Monitoring, Cybersecurity Solutions)
In 2024, ABB India automated the Indo-Bangla Friendship Pipeline (IBFPL), the first cross-border oil pipeline between India and Bangladesh. ABB's integrated automation system ensures safe, efficient operation of the 130-km pipeline, enhancing diesel transport from India to Bangladesh to meet the country's growing energy needs.
In January 2024, Schneider Electric promoted the use of smart technologies to enhance pipeline security in Nigeria. The company showcased AI, real-time monitoring, and cybersecurity solutions at the Nigeria International Pipeline Technology and Security Conference to improve infrastructure protection and energy security
| Report Attributes | Details |
|---|---|
| Market Size in 2023 | USD 9.98 Billion |
| Market Size by 2032 | USD 22.57 Billion |
| CAGR | CAGR of 9.54% From 2024 to 2032 |
| Base Year | 2023 |
| Forecast Period | 2024-2032 |
| Historical Data | 2020-2022 |
| Report Scope & Coverage | Market Size, Segments Analysis, Competitive Landscape, Regional Analysis, DROC & SWOT Analysis, Forecast Outlook |
| Key Segments | • By Service (Repair and Maintenance, Professional Services, Risk Management, Pipeline Integrity Management, Consulting Services) • By Solution (Perimeter Intrusion Detection, Secure Communication, SCADA for Pipeline, Pipeline Monitoring System, Pipeline Integrity Management, Industrial Control Systems Security) • By Vertical (Natural Gas, Crude Oil, Refined Products, Others) |
| Regional Analysis/Coverage | North America (US, Canada, Mexico), Europe (Eastern Europe [Poland, Romania, Hungary, Turkey, Rest of Eastern Europe] Western Europe] Germany, France, UK, Italy, Spain, Netherlands, Switzerland, Austria, Rest of Western Europe]), Asia Pacific (China, India, Japan, South Korea, Vietnam, Singapore, Australia, Rest of Asia Pacific), Middle East & Africa (Middle East [UAE, Egypt, Saudi Arabia, Qatar, Rest of Middle East], Africa [Nigeria, South Africa, Rest of Africa], Latin America (Brazil, Argentina, Colombia, Rest of Latin America) |
| Company Profiles | ABB, Siemens AG, Schneider Electric, Baker Hughes, Honeywell, Huawei Technologies, AVEVA, PSI AG, BAE Systems, TransCanada, Atmos International, Clampon AS, FFT, Perma-Pipe, Senstar, Syrinix, RADIOBARRIER, Pure Technologies, C-Fer Technologies, Total Safety, Krohne Group, PLM CAT, Leater, TTK, General Electric, Thales Group |
| Key Drivers | • Advanced Technologies Like AI, IoT, and Drones Revolutionize Pipeline Safety with Real-Time Monitoring and Predictive Analytics • Growing Cybersecurity Threats Drive Urgent Need to Protect Digitized Pipeline Infrastructure with Advanced Security Measures and Regulations |
| RESTRAINTS | • High Implementation Costs of AI, IoT, and Monitoring Technologies Challenge Widespread Adoption in Pipeline Safety Systems • Complex Integration of New Technologies with Legacy Pipeline Systems Creates Challenges in Adopting Advanced Safety Solutions |
Ans. Pipeline Safety Market was valued at USD 9.98 billion in 2023 and is expected to reach USD 22.57 billion by 2032, growing at a CAGR of 9.54% from 2024-2032.
Ans. The growth is driven by rising energy demand, expanding pipeline networks, and the adoption of advanced technologies like IoT, AI, and big data analytics.
Ans. North America dominated the market with a 39% revenue share, driven by a well-established pipeline infrastructure and stringent safety regulations.
Ans. The Pipeline Integrity Management segment is projected to grow at a CAGR of 12.02% from 2024 to 2032.
Ans. SCADA for Pipeline is expected to grow at a CAGR of 12.21% from 2024 to 2032.
TABLE OF CONTENTS
1. Introduction
1.1 Market Definition
1.2 Scope (Inclusion and Exclusions)
1.3 Research Assumptions
2. Executive Summary
2.1 Market Overview
2.2 Regional Synopsis
2.3 Competitive Summary
3. Research Methodology
3.1 Top-Down Approach
3.2 Bottom-up Approach
3.3. Data Validation
3.4 Primary Interviews
4. Market Dynamics Impact Analysis
4.1 Market Driving Factors Analysis
4.1.1 Drivers
4.1.2 Restraints
4.1.3 Opportunities
4.1.4 Challenges
4.2 PESTLE Analysis
4.3 Porter’s Five Forces Model
5. Statistical Insights and Trends Reporting
5.1 Adoption Rates of Emerging Technologies
5.2 Network Infrastructure Expansion, by Region
5.3 Industry Spending and Investment
5.4 Incident Frequency Trends
6. Competitive Landscape
6.1 List of Major Companies, By Region
6.2 Market Share Analysis, By Region
6.3 Product Benchmarking
6.3.1 Product specifications and features
6.3.2 Pricing
6.4 Strategic Initiatives
6.4.1 Marketing and promotional activities
6.4.2 Distribution and supply chain strategies
6.4.3 Expansion plans and new product launches
6.4.4 Strategic partnerships and collaborations
6.5 Technological Advancements
6.6 Market Positioning and Branding
7. Pipeline Safety Market Segmentation, By Service
7.1 Chapter Overview
7.2 Repair and Maintenance
7.2.1 Repair and Maintenance Market Trends Analysis (2020-2032)
7.2.2 Repair and Maintenance Market Size Estimates and Forecasts to 2032 (USD Billion)
7.3 Professional Services
7.3.1 Professional Services Market Trends Analysis (2020-2032)
7.3.2 Professional Services Market Size Estimates and Forecasts to 2032 (USD Billion)
7.4 Risk Management
7.4.1 Risk Management Market Trends Analysis (2020-2032)
7.4.2 Risk Management Market Size Estimates and Forecasts to 2032 (USD Billion)
7.5 Pipeline Integrity Management
7.5.1 Pipeline Integrity Management Market Trends Analysis (2020-2032)
7.5.2 Pipeline Integrity Management Market Size Estimates and Forecasts to 2032 (USD Billion)
7.6 Consulting Services
7.6.1 Consulting Services Market Trends Analysis (2020-2032)
7.6.2 Consulting Services Market Size Estimates and Forecasts to 2032 (USD Billion)
8. Pipeline Safety Market Segmentation, By Solution
8.1 Chapter Overview
8.2 Perimeter Intrusion Detection
8.2.1 Perimeter Intrusion Detection Market Trends Analysis (2020-2032)
8.2.2 Perimeter Intrusion Detection Market Size Estimates and Forecasts to 2032 (USD Billion)
8.3 Secure Communication
8.3.1 Secure Communication Market Trends Analysis (2020-2032)
8.3.2 Secure Communication Market Size Estimates and Forecasts to 2032 (USD Billion)
8.4 SCADA for Pipeline
8.4.1 SCADA for Pipeline Market Trends Analysis (2020-2032)
8.4.2 SCADA for Pipeline Market Size Estimates and Forecasts to 2032 (USD Billion)
8.5 Pipeline Monitoring System
8.5.1 Pipeline Monitoring System Market Trends Analysis (2020-2032)
8.5.2 Pipeline Monitoring System Market Size Estimates and Forecasts to 2032 (USD Billion)
8.6 Pipeline integrity management
8.6.1 Pipeline integrity management Market Trends Analysis (2020-2032)
8.6.2 Pipeline integrity management Market Size Estimates and Forecasts to 2032 (USD Billion)
8.7 Industrial Control Systems Security
8.7.1 Industrial Control Systems Security Market Trends Analysis (2020-2032)
8.7.2 Industrial Control Systems Security Market Size Estimates and Forecasts to 2032 (USD Billion)
9. Pipeline Safety Market Segmentation, By Vertical
9.1 Chapter Overview
9.2 Natural Gas
9.2.1 Natural Gas Market Trends Analysis (2020-2032)
9.2.2 Natural Gas Market Size Estimates and Forecasts to 2032 (USD Billion)
9.3 Crude Oil
9.3.1 Crude Oil Market Trends Analysis (2020-2032)
9.3.2 Crude Oil Market Size Estimates and Forecasts to 2032 (USD Billion)
9.4 Refined Products
9.4.1 Refined Products Market Trends Analysis (2020-2032)
9.4.2 Refined Products Market Size Estimates and Forecasts to 2032 (USD Billion)
9.5 Others
9.5.1 Others Market Trends Analysis (2020-2032)
9.5.2 Others Market Size Estimates and Forecasts to 2032 (USD Billion)
10. Regional Analysis
10.1 Chapter Overview
10.2 North America
10.2.1 Trends Analysis
10.2.2 North America Pipeline Safety Market Estimates and Forecasts, by Country (2020-2032) (USD Billion)
10.2.3 North America Pipeline Safety Market Estimates and Forecasts, By Service (2020-2032) (USD Billion)
10.2.4 North America Pipeline Safety Market Estimates and Forecasts, By Solution (2020-2032) (USD Billion)
10.2.5 North America Pipeline Safety Market Estimates and Forecasts, By Vertical (2020-2032) (USD Billion)
10.2.6 USA
10.2.6.1 USA Pipeline Safety Market Estimates and Forecasts, By Service (2020-2032) (USD Billion)
10.2.6.2 USA Pipeline Safety Market Estimates and Forecasts, By Solution (2020-2032) (USD Billion)
10.2.6.3 USA Pipeline Safety Market Estimates and Forecasts, By Vertical (2020-2032) (USD Billion)
10.2.7 Canada
10.2.7.1 Canada Pipeline Safety Market Estimates and Forecasts, By Service (2020-2032) (USD Billion)
10.2.7.2 Canada Pipeline Safety Market Estimates and Forecasts, By Solution (2020-2032) (USD Billion)
10.2.7.3 Canada Pipeline Safety Market Estimates and Forecasts, By Vertical (2020-2032) (USD Billion)
10.2.8 Mexico
10.2.8.1 Mexico Pipeline Safety Market Estimates and Forecasts, By Service (2020-2032) (USD Billion)
10.2.8.2 Mexico Pipeline Safety Market Estimates and Forecasts, By Solution (2020-2032) (USD Billion)
10.2.8.3 Mexico Pipeline Safety Market Estimates and Forecasts, By Vertical (2020-2032) (USD Billion)
10.3 Europe
10.3.1 Eastern Europe
10.3.1.1 Trends Analysis
10.3.1.2 Eastern Europe Pipeline Safety Market Estimates and Forecasts, by Country (2020-2032) (USD Billion)
10.3.1.3 Eastern Europe Pipeline Safety Market Estimates and Forecasts, By Service (2020-2032) (USD Billion)
10.3.1.4 Eastern Europe Pipeline Safety Market Estimates and Forecasts, By Solution (2020-2032) (USD Billion)
10.3.1.5 Eastern Europe Pipeline Safety Market Estimates and Forecasts, By Vertical (2020-2032) (USD Billion)
10.3.1.6 Poland
10.3.1.6.1 Poland Pipeline Safety Market Estimates and Forecasts, By Service (2020-2032) (USD Billion)
10.3.1.6.2 Poland Pipeline Safety Market Estimates and Forecasts, By Solution (2020-2032) (USD Billion)
10.3.1.6.3 Poland Pipeline Safety Market Estimates and Forecasts, By Vertical (2020-2032) (USD Billion)
10.3.1.7 Romania
10.3.1.7.1 Romania Pipeline Safety Market Estimates and Forecasts, By Service (2020-2032) (USD Billion)
10.3.1.7.2 Romania Pipeline Safety Market Estimates and Forecasts, By Solution (2020-2032) (USD Billion)
10.3.1.7.3 Romania Pipeline Safety Market Estimates and Forecasts, By Vertical (2020-2032) (USD Billion)
10.3.1.8 Hungary
10.3.1.8.1 Hungary Pipeline Safety Market Estimates and Forecasts, By Service (2020-2032) (USD Billion)
10.3.1.8.2 Hungary Pipeline Safety Market Estimates and Forecasts, By Solution (2020-2032) (USD Billion)
10.3.1.8.3 Hungary Pipeline Safety Market Estimates and Forecasts, By Vertical (2020-2032) (USD Billion)
10.3.1.9 Turkey
10.3.1.9.1 Turkey Pipeline Safety Market Estimates and Forecasts, By Service (2020-2032) (USD Billion)
10.3.1.9.2 Turkey Pipeline Safety Market Estimates and Forecasts, By Solution (2020-2032) (USD Billion)
10.3.1.9.3 Turkey Pipeline Safety Market Estimates and Forecasts, By Vertical (2020-2032) (USD Billion)
10.3.1.10 Rest of Eastern Europe
10.3.1.10.1 Rest of Eastern Europe Pipeline Safety Market Estimates and Forecasts, By Service (2020-2032) (USD Billion)
10.3.1.10.2 Rest of Eastern Europe Pipeline Safety Market Estimates and Forecasts, By Solution (2020-2032) (USD Billion)
10.3.1.10.3 Rest of Eastern Europe Pipeline Safety Market Estimates and Forecasts, By Vertical (2020-2032) (USD Billion)
10.3.2 Western Europe
10.3.2.1 Trends Analysis
10.3.2.2 Western Europe Pipeline Safety Market Estimates and Forecasts, by Country (2020-2032) (USD Billion)
10.3.2.3 Western Europe Pipeline Safety Market Estimates and Forecasts, By Service (2020-2032) (USD Billion)
10.3.2.4 Western Europe Pipeline Safety Market Estimates and Forecasts, By Solution (2020-2032) (USD Billion)
10.3.2.5 Western Europe Pipeline Safety Market Estimates and Forecasts, By Vertical (2020-2032) (USD Billion)
10.3.2.6 Germany
10.3.2.6.1 Germany Pipeline Safety Market Estimates and Forecasts, By Service (2020-2032) (USD Billion)
10.3.2.6.2 Germany Pipeline Safety Market Estimates and Forecasts, By Solution (2020-2032) (USD Billion)
10.3.2.6.3 Germany Pipeline Safety Market Estimates and Forecasts, By Vertical (2020-2032) (USD Billion)
10.3.2.7 France
10.3.2.7.1 France Pipeline Safety Market Estimates and Forecasts, By Service (2020-2032) (USD Billion)
10.3.2.7.2 France Pipeline Safety Market Estimates and Forecasts, By Solution (2020-2032) (USD Billion)
10.3.2.7.3 France Pipeline Safety Market Estimates and Forecasts, By Vertical (2020-2032) (USD Billion)
10.3.2.8 UK
10.3.2.8.1 UK Pipeline Safety Market Estimates and Forecasts, By Service (2020-2032) (USD Billion)
10.3.2.8.2 UK Pipeline Safety Market Estimates and Forecasts, By Solution (2020-2032) (USD Billion)
10.3.2.8.3 UK Pipeline Safety Market Estimates and Forecasts, By Vertical (2020-2032) (USD Billion)
10.3.2.9 Italy
10.3.2.9.1 Italy Pipeline Safety Market Estimates and Forecasts, By Service (2020-2032) (USD Billion)
10.3.2.9.2 Italy Pipeline Safety Market Estimates and Forecasts, By Solution (2020-2032) (USD Billion)
10.3.2.9.3 Italy Pipeline Safety Market Estimates and Forecasts, By Vertical (2020-2032) (USD Billion)
10.3.2.10 Spain
10.3.2.10.1 Spain Pipeline Safety Market Estimates and Forecasts, By Service (2020-2032) (USD Billion)
10.3.2.10.2 Spain Pipeline Safety Market Estimates and Forecasts, By Solution (2020-2032) (USD Billion)
10.3.2.10.3 Spain Pipeline Safety Market Estimates and Forecasts, By Vertical (2020-2032) (USD Billion)
10.3.2.11 Netherlands
10.3.2.11.1 Netherlands Pipeline Safety Market Estimates and Forecasts, By Service (2020-2032) (USD Billion)
10.3.2.11.2 Netherlands Pipeline Safety Market Estimates and Forecasts, By Solution (2020-2032) (USD Billion)
10.3.2.11.3 Netherlands Pipeline Safety Market Estimates and Forecasts, By Vertical (2020-2032) (USD Billion)
10.3.2.12 Switzerland
10.3.2.12.1 Switzerland Pipeline Safety Market Estimates and Forecasts, By Service (2020-2032) (USD Billion)
10.3.2.12.2 Switzerland Pipeline Safety Market Estimates and Forecasts, By Solution (2020-2032) (USD Billion)
10.3.2.12.3 Switzerland Pipeline Safety Market Estimates and Forecasts, By Vertical (2020-2032) (USD Billion)
10.3.2.13 Austria
10.3.2.13.1 Austria Pipeline Safety Market Estimates and Forecasts, By Service (2020-2032) (USD Billion)
10.3.2.13.2 Austria Pipeline Safety Market Estimates and Forecasts, By Solution (2020-2032) (USD Billion)
10.3.2.13.3 Austria Pipeline Safety Market Estimates and Forecasts, By Vertical (2020-2032) (USD Billion)
10.3.2.14 Rest of Western Europe
10.3.2.14.1 Rest of Western Europe Pipeline Safety Market Estimates and Forecasts, By Service (2020-2032) (USD Billion)
10.3.2.14.2 Rest of Western Europe Pipeline Safety Market Estimates and Forecasts, By Solution (2020-2032) (USD Billion)
10.3.2.14.3 Rest of Western Europe Pipeline Safety Market Estimates and Forecasts, By Vertical (2020-2032) (USD Billion)
10.4 Asia Pacific
10.4.1 Trends Analysis
10.4.2 Asia Pacific Pipeline Safety Market Estimates and Forecasts, by Country (2020-2032) (USD Billion)
10.4.3 Asia Pacific Pipeline Safety Market Estimates and Forecasts, By Service (2020-2032) (USD Billion)
10.4.4 Asia Pacific Pipeline Safety Market Estimates and Forecasts, By Solution (2020-2032) (USD Billion)
10.4.5 Asia Pacific Pipeline Safety Market Estimates and Forecasts, By Vertical (2020-2032) (USD Billion)
10.4.6 China
10.4.6.1 China Pipeline Safety Market Estimates and Forecasts, By Service (2020-2032) (USD Billion)
10.4.6.2 China Pipeline Safety Market Estimates and Forecasts, By Solution (2020-2032) (USD Billion)
10.4.6.3 China Pipeline Safety Market Estimates and Forecasts, By Vertical (2020-2032) (USD Billion)
10.4.7 India
10.4.7.1 India Pipeline Safety Market Estimates and Forecasts, By Service (2020-2032) (USD Billion)
10.4.7.2 India Pipeline Safety Market Estimates and Forecasts, By Solution (2020-2032) (USD Billion)
10.4.7.3 India Pipeline Safety Market Estimates and Forecasts, By Vertical (2020-2032) (USD Billion)
10.4.8 Japan
10.4.8.1 Japan Pipeline Safety Market Estimates and Forecasts, By Service (2020-2032) (USD Billion)
10.4.8.2 Japan Pipeline Safety Market Estimates and Forecasts, By Solution (2020-2032) (USD Billion)
10.4.8.3 Japan Pipeline Safety Market Estimates and Forecasts, By Vertical (2020-2032) (USD Billion)
10.4.9 South Korea
10.4.9.1 South Korea Pipeline Safety Market Estimates and Forecasts, By Service (2020-2032) (USD Billion)
10.4.9.2 South Korea Pipeline Safety Market Estimates and Forecasts, By Solution (2020-2032) (USD Billion)
10.4.9.3 South Korea Pipeline Safety Market Estimates and Forecasts, By Vertical (2020-2032) (USD Billion)
10.4.10 Vietnam
10.4.10.1 Vietnam Pipeline Safety Market Estimates and Forecasts, By Service (2020-2032) (USD Billion)
10.4.10.2 Vietnam Pipeline Safety Market Estimates and Forecasts, By Solution (2020-2032) (USD Billion)
10.4.10.3 Vietnam Pipeline Safety Market Estimates and Forecasts, By Vertical (2020-2032) (USD Billion)
10.4.11 Singapore
10.4.11.1 Singapore Pipeline Safety Market Estimates and Forecasts, By Service (2020-2032) (USD Billion)
10.4.11.2 Singapore Pipeline Safety Market Estimates and Forecasts, By Solution (2020-2032) (USD Billion)
10.4.11.3 Singapore Pipeline Safety Market Estimates and Forecasts, By Vertical (2020-2032) (USD Billion)
10.4.12 Australia
10.4.12.1 Australia Pipeline Safety Market Estimates and Forecasts, By Service (2020-2032) (USD Billion)
10.4.12.2 Australia Pipeline Safety Market Estimates and Forecasts, By Solution (2020-2032) (USD Billion)
10.4.12.3 Australia Pipeline Safety Market Estimates and Forecasts, By Vertical (2020-2032) (USD Billion)
10.4.13 Rest of Asia Pacific
10.4.13.1 Rest of Asia Pacific Pipeline Safety Market Estimates and Forecasts, By Service (2020-2032) (USD Billion)
10.4.13.2 Rest of Asia Pacific Pipeline Safety Market Estimates and Forecasts, By Solution (2020-2032) (USD Billion)
10.4.13.3 Rest of Asia Pacific Pipeline Safety Market Estimates and Forecasts, By Vertical (2020-2032) (USD Billion)
10.5 Middle East and Africa
10.5.1 Middle East
10.5.1.1 Trends Analysis
10.5.1.2 Middle East Pipeline Safety Market Estimates and Forecasts, by Country (2020-2032) (USD Billion)
10.5.1.3 Middle East Pipeline Safety Market Estimates and Forecasts, By Service (2020-2032) (USD Billion)
10.5.1.4 Middle East Pipeline Safety Market Estimates and Forecasts, By Solution (2020-2032) (USD Billion)
10.5.1.5 Middle East Pipeline Safety Market Estimates and Forecasts, By Vertical (2020-2032) (USD Billion)
10.5.1.6 UAE
10.5.1.6.1 UAE Pipeline Safety Market Estimates and Forecasts, By Service (2020-2032) (USD Billion)
10.5.1.6.2 UAE Pipeline Safety Market Estimates and Forecasts, By Solution (2020-2032) (USD Billion)
10.5.1.6.3 UAE Pipeline Safety Market Estimates and Forecasts, By Vertical (2020-2032) (USD Billion)
10.5.1.7 Egypt
10.5.1.7.1 Egypt Pipeline Safety Market Estimates and Forecasts, By Service (2020-2032) (USD Billion)
10.5.1.7.2 Egypt Pipeline Safety Market Estimates and Forecasts, By Solution (2020-2032) (USD Billion)
10.5.1.7.3 Egypt Pipeline Safety Market Estimates and Forecasts, By Vertical (2020-2032) (USD Billion)
10.5.1.8 Saudi Arabia
10.5.1.8.1 Saudi Arabia Pipeline Safety Market Estimates and Forecasts, By Service (2020-2032) (USD Billion)
10.5.1.8.2 Saudi Arabia Pipeline Safety Market Estimates and Forecasts, By Solution (2020-2032) (USD Billion)
10.5.1.8.3 Saudi Arabia Pipeline Safety Market Estimates and Forecasts, By Vertical (2020-2032) (USD Billion)
10.5.1.9 Qatar
10.5.1.9.1 Qatar Pipeline Safety Market Estimates and Forecasts, By Service (2020-2032) (USD Billion)
10.5.1.9.2 Qatar Pipeline Safety Market Estimates and Forecasts, By Solution (2020-2032) (USD Billion)
10.5.1.9.3 Qatar Pipeline Safety Market Estimates and Forecasts, By Vertical (2020-2032) (USD Billion)
10.5.1.10 Rest of Middle East
10.5.1.10.1 Rest of Middle East Pipeline Safety Market Estimates and Forecasts, By Service (2020-2032) (USD Billion)
10.5.1.10.2 Rest of Middle East Pipeline Safety Market Estimates and Forecasts, By Solution (2020-2032) (USD Billion)
10.5.1.10.3 Rest of Middle East Pipeline Safety Market Estimates and Forecasts, By Vertical (2020-2032) (USD Billion)
10.5.2 Africa
10.5.2.1 Trends Analysis
10.5.2.2 Africa Pipeline Safety Market Estimates and Forecasts, by Country (2020-2032) (USD Billion)
10.5.2.3 Africa Pipeline Safety Market Estimates and Forecasts, By Service (2020-2032) (USD Billion)
10.5.2.4 Africa Pipeline Safety Market Estimates and Forecasts, By Solution (2020-2032) (USD Billion)
10.5.2.5 Africa Pipeline Safety Market Estimates and Forecasts, By Vertical (2020-2032) (USD Billion)
10.5.2.6 South Africa
10.5.2.6.1 South Africa Pipeline Safety Market Estimates and Forecasts, By Service (2020-2032) (USD Billion)
10.5.2.6.2 South Africa Pipeline Safety Market Estimates and Forecasts, By Solution (2020-2032) (USD Billion)
10.5.2.6.3 South Africa Pipeline Safety Market Estimates and Forecasts, By Vertical (2020-2032) (USD Billion)
10.5.2.7 Nigeria
10.5.2.7.1 Nigeria Pipeline Safety Market Estimates and Forecasts, By Service (2020-2032) (USD Billion)
10.5.2.7.2 Nigeria Pipeline Safety Market Estimates and Forecasts, By Solution (2020-2032) (USD Billion)
10.5.2.7.3 Nigeria Pipeline Safety Market Estimates and Forecasts, By Vertical (2020-2032) (USD Billion)
10.5.2.8 Rest of Africa
10.5.2.8.1 Rest of Africa Pipeline Safety Market Estimates and Forecasts, By Service (2020-2032) (USD Billion)
10.5.2.8.2 Rest of Africa Pipeline Safety Market Estimates and Forecasts, By Solution (2020-2032) (USD Billion)
10.5.2.8.3 Rest of Africa Pipeline Safety Market Estimates and Forecasts, By Vertical (2020-2032) (USD Billion)
10.6 Latin America
10.6.1 Trends Analysis
10.6.2 Latin America Pipeline Safety Market Estimates and Forecasts, by Country (2020-2032) (USD Billion)
10.6.3 Latin America Pipeline Safety Market Estimates and Forecasts, By Service (2020-2032) (USD Billion)
10.6.4 Latin America Pipeline Safety Market Estimates and Forecasts, By Solution (2020-2032) (USD Billion)
10.6.5 Latin America Pipeline Safety Market Estimates and Forecasts, By Vertical (2020-2032) (USD Billion)
10.6.6 Brazil
10.6.6.1 Brazil Pipeline Safety Market Estimates and Forecasts, By Service (2020-2032) (USD Billion)
10.6.6.2 Brazil Pipeline Safety Market Estimates and Forecasts, By Solution (2020-2032) (USD Billion)
10.6.6.3 Brazil Pipeline Safety Market Estimates and Forecasts, By Vertical (2020-2032) (USD Billion)
10.6.7 Argentina
10.6.7.1 Argentina Pipeline Safety Market Estimates and Forecasts, By Service (2020-2032) (USD Billion)
10.6.7.2 Argentina Pipeline Safety Market Estimates and Forecasts, By Solution (2020-2032) (USD Billion)
10.6.7.3 Argentina Pipeline Safety Market Estimates and Forecasts, By Vertical (2020-2032) (USD Billion)
10.6.8 Colombia
10.6.8.1 Colombia Pipeline Safety Market Estimates and Forecasts, By Service (2020-2032) (USD Billion)
10.6.8.2 Colombia Pipeline Safety Market Estimates and Forecasts, By Solution (2020-2032) (USD Billion)
10.6.8.3 Colombia Pipeline Safety Market Estimates and Forecasts, By Vertical (2020-2032) (USD Billion)
10.6.9 Rest of Latin America
10.6.9.1 Rest of Latin America Pipeline Safety Market Estimates and Forecasts, By Service (2020-2032) (USD Billion)
10.6.9.2 Rest of Latin America Pipeline Safety Market Estimates and Forecasts, By Solution (2020-2032) (USD Billion)
10.6.9.3 Rest of Latin America Pipeline Safety Market Estimates and Forecasts, By Vertical (2020-2032) (USD Billion)
11. Company Profiles
11.1 ABB
11.1.1 Company Overview
11.1.2 Financial
11.1.3 Products/ Services Offered
11.1.4 SWOT Analysis
11.2 Siemens AG
11.2.1 Company Overview
11.2.2 Financial
11.2.3 Products/ Services Offered
11.2.4 SWOT Analysis
11.3 Schneider Electric
11.3.1 Company Overview
11.3.2 Financial
11.3.3 Products/ Services Offered
11.3.4 SWOT Analysis
11.4 Baker Hughes
11.4.1 Company Overview
11.4.2 Financial
11.4.3 Products/ Services Offered
11.4.4 SWOT Analysis
11.5 Honeywell
11.5.1 Company Overview
11.5.2 Financial
11.5.3 Products/ Services Offered
11.5.4 SWOT Analysis
11.6 Huawei Technologies
11.6.1 Company Overview
11.6.2 Financial
11.6.3 Products/ Services Offered
11.6.4 SWOT Analysis
11.7 AVEVA
11.7.1 Company Overview
11.7.2 Financial
11.7.3 Products/ Services Offered
11.7.4 SWOT Analysis
11.8 PSI AG
11.8.1 Company Overview
11.8.2 Financial
11.8.3 Products/ Services Offered
11.8.4 SWOT Analysis
11.9 BAE Systems
11.9.1 Company Overview
11.9.2 Financial
11.9.3 Products/ Services Offered
11.9.4 SWOT Analysis
11.10 TransCanada
11.10.1 Company Overview
11.10.2 Financial
11.10.3 Products/ Services Offered
11.10.4 SWOT Analysis
12. Use Cases and Best Practices
13. Conclusion
An accurate research report requires proper strategizing as well as implementation. There are multiple factors involved in the completion of good and accurate research report and selecting the best methodology to compete the research is the toughest part. Since the research reports we provide play a crucial role in any company’s decision-making process, therefore we at SNS Insider always believe that we should choose the best method which gives us results closer to reality. This allows us to reach at a stage wherein we can provide our clients best and accurate investment to output ratio.
Each report that we prepare takes a timeframe of 350-400 business hours for production. Starting from the selection of titles through a couple of in-depth brain storming session to the final QC process before uploading our titles on our website we dedicate around 350 working hours. The titles are selected based on their current market cap and the foreseen CAGR and growth.
The 5 steps process:
Step 1: Secondary Research:
Secondary Research or Desk Research is as the name suggests is a research process wherein, we collect data through the readily available information. In this process we use various paid and unpaid databases which our team has access to and gather data through the same. This includes examining of listed companies’ annual reports, Journals, SEC filling etc. Apart from this our team has access to various associations across the globe across different industries. Lastly, we have exchange relationships with various university as well as individual libraries.

Step 2: Primary Research
When we talk about primary research, it is a type of study in which the researchers collect relevant data samples directly, rather than relying on previously collected data. This type of research is focused on gaining content specific facts that can be sued to solve specific problems. Since the collected data is fresh and first hand therefore it makes the study more accurate and genuine.
We at SNS Insider have divided Primary Research into 2 parts.
Part 1 wherein we interview the KOLs of major players as well as the upcoming ones across various geographic regions. This allows us to have their view over the market scenario and acts as an important tool to come closer to the accurate market numbers. As many as 45 paid and unpaid primary interviews are taken from both the demand and supply side of the industry to make sure we land at an accurate judgement and analysis of the market.
This step involves the triangulation of data wherein our team analyses the interview transcripts, online survey responses and observation of on filed participants. The below mentioned chart should give a better understanding of the part 1 of the primary interview.

Part 2: In this part of primary research the data collected via secondary research and the part 1 of the primary research is validated with the interviews from individual consultants and subject matter experts.
Consultants are those set of people who have at least 12 years of experience and expertise within the industry whereas Subject Matter Experts are those with at least 15 years of experience behind their back within the same space. The data with the help of two main processes i.e., FGDs (Focused Group Discussions) and IDs (Individual Discussions). This gives us a 3rd party nonbiased primary view of the market scenario making it a more dependable one while collation of the data pointers.
Step 3: Data Bank Validation
Once all the information is collected via primary and secondary sources, we run that information for data validation. At our intelligence centre our research heads track a lot of information related to the market which includes the quarterly reports, the daily stock prices, and other relevant information. Our data bank server gets updated every fortnight and that is how the information which we collected using our primary and secondary information is revalidated in real time.

Step 4: QA/QC Process
After all the data collection and validation our team does a final level of quality check and quality assurance to get rid of any unwanted or undesired mistakes. This might include but not limited to getting rid of the any typos, duplication of numbers or missing of any important information. The people involved in this process include technical content writers, research heads and graphics people. Once this process is completed the title gets uploader on our platform for our clients to read it.
Step 5: Final QC/QA Process:
This is the last process and comes when the client has ordered the study. In this process a final QA/QC is done before the study is emailed to the client. Since we believe in giving our clients a good experience of our research studies, therefore, to make sure that we do not lack at our end in any way humanly possible we do a final round of quality check and then dispatch the study to the client.
Key Segments:
By Service
Repair and Maintenance
Professional Services
Risk Management
Pipeline Integrity Management
Consulting Services
By Solution
Perimeter Intrusion Detection
Secure Communication
SCADA for Pipeline
Pipeline Monitoring System
Pipeline integrity management
Industrial Control Systems Security
By Vertical
Natural Gas
Crude Oil
Refined Products
Others
Request for Segment Customization as per your Business Requirement: Segment Customization Request
Regional Coverage:
North America
US
Canada
Mexico
Europe
Eastern Europe
Poland
Romania
Hungary
Turkey
Rest of Eastern Europe
Western Europe
Germany
France
UK
Italy
Spain
Netherlands
Switzerland
Austria
Rest of Western Europe
Asia Pacific
China
India
Japan
South Korea
Vietnam
Singapore
Australia
Rest of Asia Pacific
Middle East & Africa
Middle East
UAE
Egypt
Saudi Arabia
Qatar
Rest of the Middle East
Africa
Nigeria
South Africa
Rest of Africa
Latin America
Brazil
Argentina
Colombia
Rest of Latin America
Request for Country Level Research Report: Country Level Customization Request
Available Customization
With the given market data, SNS Insider offers customization as per the company’s specific needs. The following customization options are available for the report:
Product Analysis
Criss-Cross segment analysis (e.g. Product X Application)
Product Matrix which gives a detailed comparison of the product portfolio of each company
Geographic Analysis
Additional countries in any of the regions
Company Information
Detailed analysis and profiling of additional market players (Up to five)
The Cloud Gaming Market was valued at USD 2.0 Billion in 2023 and is expected to reach USD 60.0 Billion by 2032, growing at a CAGR of 45.26% by 2032.
The IoT Cloud Platform Market was valued at USD 20.2 Billion in 2023 and is expected to reach USD 71.7 Billion by 2032, growing at a CAGR of 15.14% by 2032.
The RAN Intelligent Controller Market was valued at USD 222.4 Million in 2023 and will reach USD 15124.9 Million by 2032, growing at a CAGR of 59.83% by 2032.
The Cloud Adoption in GCC Market was USD 40.7 billion in 2023 and is expected to reach USD 158.8 Billion by 2032, growing at a CAGR of 14.77% by 2024-2032.
Security Automation Market was valued at USD 9.07 billion in 2023 and is expected to reach USD 27.82 billion by 2032, growing at a CAGR of 13.31% by 2032.
The Customer Journey Analytics Market Size was valued at USD 13.5 Billion in 2023 and will reach USD 59.4 Billion by 2032, growing at a CAGR of 17.9% by 2032.

Hi! Click one of our member below to chat on Phone
© 2025 All Rights Reserved by SNS Insider Pvt Ltd


