image

Physical Security Market Report Scope & Overview:

physical Security Market Revenue Analysis

Get More Information on Physical Security Market - Request Sample Report

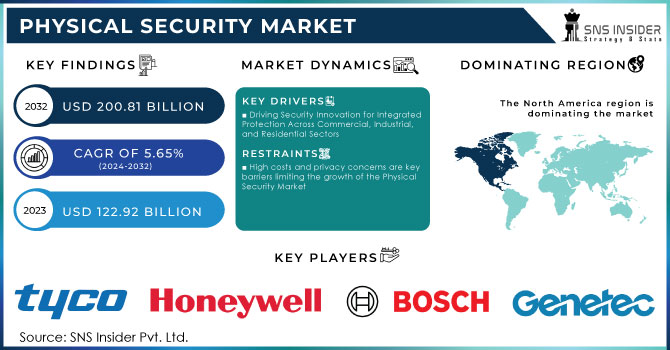
The Physical Security Market Size was valued at USD 122.92 Billion in 2023 and is expected to reach USD 200.81 Billion by 2032 and grow at a CAGR of 5.65% over the forecast period 2024-2032.

The physical security market is growing very rapidly with increasing concerns about crime, terrorism, and vandalism. The changing nature of global threats ensures that organizations are investing more in high-level security across different sectors. These are a few reasons why the demand is increasing for an integrated security system comprised of video surveillance, access control, and intrusion detection technology. It has also seen advances in artificial intelligence and machine learning that make security solutions more attractive for business and government use​. With ongoing investments in infrastructure and increased regulatory compliance, the physical security market is poised for significant expansion, as entities prioritize safety and protection against emerging threats.

The U.S. Physical Security market highlights trends and growth tendencies based on new technologies. The market size was expected to reach approximately USD 405 billion by 2023, with a year-over-year growth rate of around 9% projected for 2024. The majority of investments in this market came from video surveillance systems, which accounted for about USD 28 billion of the equipment market (American Security Force, ASIS International). The security services segment is bigger, with services reaching about USD 319 billion, and guarding services are significant in that respect​ (ASIS International). There is a growing force pushing companies toward integration of physical and cybersecurity measures as it seems to be an attempt toward a holistic strategy in fighting evolving threats​ (American Security Force).

Physical Security Market Dynamics

KEY DRIVERS:

  • Driving Security Innovation for Integrated Protection Across Commercial, Industrial, and Residential Sectors

The driving force of the current market for Physical Security is the critical need for integrating comprehensive protection for commercial, industrial, and residential sectors. This is the time that organizations are seeking integrated solutions such as video surveillance, access control, and physical intrusion detection in protecting their respective infrastructures from theft, vandalism, and terrorism. Increased threat by governments and private enterprise has compelled much investment in state-of-the-art security technologies; the trend has propelled the development and adoption of advanced physical security systems.

  • Smart Security Evolution IoT and AI Are Transforming Physical Security Systems for Enhanced Efficiency and Rapid Response

The growing integration of IoT and AI-based technologies into physical security systems is another driver of the market. Predictive threat monitoring is provided by smart buildings that run on cloud-based access control and systems for real-time surveillance. Smart cities and automated infrastructure monitoring have paved the way to deploy massive scales of physical security solutions. It improves response time but enhances operational efficiency and data-driven decision-making to drive further growth in the market. 

RESTRAIN:

  • High costs and privacy concerns are key barriers limiting the growth of the Physical Security Market

The physical security market faces high installation costs and recurring maintenance cost for sophisticated security systems is a barrier to the market. All-inclusive solutions are not adopted by small and medium enterprises because they do not possess resources in those organizations. Moreover, privacy concerns associated with surveillance technologies such as face recognition hinder its widespread adoption. Most strenuous rules and compliance conditions pose bigger difficulties for businesses when it comes to the effective operation and scaling of their physical security measures. It is essential to overcome these to unlock the full capacity of this market. 

Physical Security Market Segmentation Overview

BY SYSTEM

The physical security market is dominated by the systems segment with a total market share of 68.25% in 2023, and there is growing demand for a comprehensive solution that includes surveillance, access control as well as intrusion detection. Organizations across all industries are looking for overall security systems that would protect their critical infrastructure against new threats such as theft and terrorism. In addition, cloud-based technologies and artificial intelligence have further advanced these systems to make them function more effectively and user-friendly.

The services segment is projected to experience rapid growth, with an anticipated compound annual growth rate (CAGR) of 8.35% throughout the forecast period. Services encompass the installation, upkeep, and upgrading of the equipment as well as software, that further propels performance by providing the user with optimum control of the complete security infrastructure. High infrastructure development in developing countries along with technology upgrades such as Ultra High Definition (UHD) surveillance are propelling high demand for added physical security services.

BY ORGANIZATION SIZE

The large enterprise segment was the market leader in 2023, capturing over 63.45% of global revenue. The reasons behind it include more substantial infrastructure to be safeguarded, much more critical information to be protected, and greater revenue to be spent. So, they are the early adopters of physical security. Further, protecting their data from thefts, cyberattacks, and unauthorized access allows the segment shift toward physical security solutions.

The SMEs segment is expected to grow rapidly at CAGR of 7.28% over the Forecast period. This segment can more be due to theft, environmental danger, and intruders, as a lot of resources and people also need to be protected in small businesses.
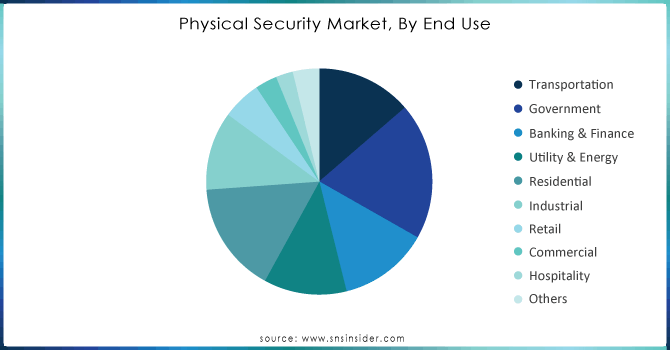
BY END-USE

The government segment emerged as the market leader in 2023, representing over 19.56% of the total revenue share. These trends are supported by the increasing government spending on national security and public safety initiatives that are triggered by the global threats from terrorism and cyberattacks. The governments are investing future-security technologies, including surveillance systems and access control technologies, towards safeguarding critical infrastructure and public space.

The residential segment is expected to grow at a high rate of 6.58% during the forecast period due to the innumerable damaged assets and resources subjected to thefts and other attacks. The application in residential properties has improved user experience along with protection of the assets from any kind of risks. Safety is ensured through well-rounded video surveillance systems, smart access control, and quick intrusion detection system. 

Physical-Security-Market-By-End-Use

Need any customization research on Physical Security Market - Enquiry Now

Physical Security Market Regional Analysis

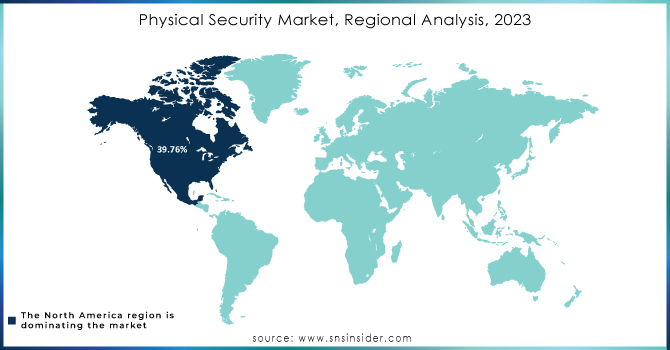
In 2023, North America dominated the Physical Security market, holding the highest share with over 39.76% of market revenue. Robust economic growth in conjunction with regulatory reforms, along with rising investments in security solutions by SMEs, fuels a high rate of adoption of advanced physical security systems in the region. Emphasis on increasing security measures against growing threats further cements North America's leadership in market growth and innovation for physical security technologies.

The Asia Pacific region will have the highest CAGR of 6.35% during the forecast period. The increase in this region can be attributed to the rising demand for smart security solutions in India and China. Notable investments by the Chinese government in safe city projects, mainly concentrating on city surveillance and monitoring traffic, are likely to fuel the growth of the market.

Physical-Security-Market-Regional-Analysis-2023

Key Players in Physical Security Market

Some of the major players in the Physical Security Market are:

  • Tyco International (CCTV Systems, Access Control Solutions)

  • Honeywell (Video Surveillance Systems, Intrusion Detection Systems)

  • Bosch Security Systems (Security Cameras, Alarm Systems)

  • Axis Communications (Network Cameras, Video Encoders)

  • Genetec (Security Center, AutoVu)

  • ADT Inc. (Commercial Security Systems, Home Security Solutions)

  • Cisco Systems (Cisco Video Surveillance, Security Management Solutions)

  • Hikvision (IP Cameras, Video Management Software)

  • Pelco (Video Surveillance Cameras, Video Management Systems)

  • Securitas AB (Guarding Services, Mobile Patrol Services)

  • G4S (Integrated Security Solutions, Cash Solutions)

  • Stanley Security (Access Control Systems, Video Surveillance Solutions)

  • Schneider Electric (EcoStruxure Security Expert, Video Management Software)

  • IBM (Security Information and Event Management, Physical Security Solutions)

  • Milestone Systems (Video Management Software, Open Platform Solutions)

  • FLIR Systems (Thermal Imaging Cameras, Surveillance Solutions)

  • Dahua Technology (Surveillance Cameras, Video Recorders)

  • Verint Systems (Video Intelligence Solutions, Security Solutions)

  • LenelS2 (OnGuard Security Management System, Mobile Access Solutions)

  • Motorola Solutions (Two-Way Radios, Video Security Solutions)

RECENT TRENDS

  • In Sep 2024, Rhombus, a leader in cloud-managed physical security, announces the rollout of two new solutions to its much longer list of security offerings: the R600 Multisensor Camera and the E50 Environmental Sensor.

  • In May 2024, Verkada announced that it would be launching a new AI-powered search in Beta for its customers. Making use of large language and large vision models, AI-powered search from Verkada is set to empower its customers to apply natural language in the searching of video security camera footage containing people and vehicles, thus making their investigations more intuitive and efficient.

  • In April 2024, LVT (LiveView Technologies, Inc.), the leader of customizable mobile surveillance solutions, announced its integration with Immix and two new cameras that further empower security leaders to monitor and protect a range of environments. More than 94% of Fortune 100 retailers use LVT’s advanced mobile surveillance units and security solutions.

Physical Security Market Report Scope:

Report Attributes Details
Market Size in 2023 USD 122.92 Billion 
Market Size by 2032 USD 200.81 Billion 
CAGR CAGR of 5.65% From 2024 to 2032
Base Year 2023
Forecast Period 2024-2032
Historical Data 2020-2022
Report Scope & Coverage Market Size, Segments Analysis, Competitive  Landscape, Regional Analysis, DROC & SWOT Analysis, Forecast Outlook
Key Segments By Component (Systems (Physical Access Control System (PACS), Video Surveillance System, Perimeter Intrusion Detection and Prevention, Physical Security Information Management (PSIM), Physical Identity & Access Management (PIAM), Fire and Life Safety), Services (System Integration, Remote Monitoring, Others)),
By Size (Large Enterprises, SMEs),
By End Use (Transportation, Government, Banking & Finance, Utility & Energy, Residential, Industrial, Retail, Commercial, Hospitality, Others
Regional Analysis/Coverage North America (US, Canada, Mexico), Europe (Eastern Europe [Poland, Romania, Hungary, Turkey, Rest of Eastern Europe] Western Europe [Germany, France, UK, Italy, Spain, Netherlands, Switzerland, Austria, Rest of Western Europe]), Asia Pacific (China, India, Japan, South Korea, Vietnam, Singapore, Australia, Rest of Asia Pacific), Middle East & Africa (Middle East [UAE, Egypt, Saudi Arabia, Qatar, Rest of Middle East], Africa [Nigeria, South Africa, Rest of Africa], Latin America (Brazil, Argentina, Colombia, Rest of Latin America)
Company Profiles Tyco International, Honeywell, Bosch Security Systems, Axis Communications, Genetec, ADT Inc., Cisco Systems, Hikvision, Pelco, Securitas AB, G4S, Stanley Security, Schneider Electric, IBM, Milestone Systems, FLIR Systems, Dahua Technology, Verint Systems, LenelS2, Motorola Solutions
Key Drivers • Driving Security Innovation for Integrated Protection Across Commercial, Industrial, and Residential Sectors
• Smart Security Evolution IoT and AI Are Transforming Physical Security Systems for Enhanced Efficiency and Rapid Response
RESTRAINTS • High costs and privacy concerns are key barriers limiting the growth of the Physical Security Market

Frequently Asked Questions

Ans: The Physical Security Market is expected to grow at a CAGR of 5.65% during 2024-2032.

Ans: Physical Security Market size was USD 122.92 billion in 2023 and is expected to Reach USD 200.81 billion by 2032.

Ans: The major growth factor for the Physical Security Market is the increasing demand for advanced surveillance and intrusion detection systems due to rising concerns over crime, terrorism, and unauthorized access across critical infrastructure and commercial sectors.

Ans: The Government segment dominated the Physical Security Market in 2023.

Ans: NORTH AMERICA dominated the Physical Security Market in 2023.

Table of Content

1. Introduction

1.1 Market Definition

1.2 Scope (Inclusion and Exclusions)

1.3 Research Assumptions

2. Executive Summary

2.1 Market Overview

2.2 Regional Synopsis

2.3 Competitive Summary

3. Research Methodology

3.1 Top-Down Approach

3.2 Bottom-up Approach

3.3. Data Validation

3.4 Primary Interviews

4. Market Dynamics Impact Analysis

4.1 Market Driving Factors Analysis

4.1.1 Drivers

4.1.2 Restraints

4.1.3 Opportunities

4.1.4 Challenges

4.2 PESTLE Analysis

4.3 Porter’s Five Forces Model

5. Statistical Insights and Trends Reporting

      5.1 Physical Security Customer Segmentation, by Region (2023)

      5.2 Physical Security Regulatory Impact (Historic and Future)

      5.3 Physical Security Customer Satisfaction and Adoption Rates (2023)

      5.4 Customer Retention Rates

6. Competitive Landscape

6.1 List of Major Companies, By Region

6.2 Market Share Analysis, By Region

6.3 Product Benchmarking

6.3.1 Product specifications and features

6.3.2 Pricing

6.4 Strategic Initiatives

6.4.1 Marketing and promotional activities

6.4.2 Distribution and Supply Chain Strategies

6.4.3 Expansion plans and new product launches

6.4.4 Strategic partnerships and collaborations

6.5 Technological Advancements

6.6 Market Positioning and Branding

7. Physical Security Market Segmentation, by Component

7.1 Chapter Overview

7.2 Systems

7.2.1 Systems Market Trends Analysis (2020-2032)

7.2.2 Systems Market Size Estimates and Forecasts to 2032 (USD Million)

7.2.2.1 Physical Access Control System (PACS) Market Trends Analysis (2020-2032)

7.2.2.2 Physical Access Control System (PACS) Market Size Estimates and Forecasts to 2032 (USD Million)

7.2.2.3 Video Surveillance System Market Trends Analysis (2020-2032)

7.2.2.4 Video Surveillance System Market Size Estimates and Forecasts to 2032 (USD Million)

7.2.2.5 Perimeter Intrusion Detection and Prevention Market Trends Analysis (2020-2032)

7.2.2.6 Perimeter Intrusion Detection and Prevention Market Size Estimates and Forecasts to 2032 (USD Million)

7.2.2.7 Physical Security Information Management (PSIM) Market Trends Analysis (2020-2032)

7.2.2.8 Physical Security Information Management (PSIM) Market Size Estimates and Forecasts to 2032 (USD Million)


7.2.2.9 Physical Identity & Access Management (PIAM) Market Trends Analysis (2020-2032)

7.2.2.10 Physical Identity & Access Management (PIAM) Market Size Estimates and Forecasts to 2032 (USD Million)

7.2.2.11 Fire and Life Safety Market Trends Analysis (2020-2032)

7.2.2.12 Fire and Life Safety Market Size Estimates and Forecasts to 2032 (USD Million)

7.3 Services

7.3.1 Services Market Trends Analysis (2020-2032)

7.3.2 Services Market Size Estimates and Forecasts to 2032 (USD Million)

7.3.2.1 System Integration Market Trends Analysis (2020-2032)

7.3.2.2 System Integration Market Size Estimates and Forecasts to 2032 (USD Million)

7.3.2.3 Remote Monitoring Market Trends Analysis (2020-2032)

7.3.2.4 Remote Monitoring Market Size Estimates and Forecasts to 2032 (USD Million)

7.3.2.5 Others Market Trends Analysis (2020-2032)

7.3.2.6 Others Market Size Estimates and Forecasts to 2032 (USD Million)

8. Physical Security Market Segmentation, by Organization Size

8.1 Chapter Overview

8.2 Large Enterprises

8.2.1 Large Enterprises Market Trends Analysis (2020-2032)

8.2.2 Large Enterprises Market Size Estimates and Forecasts to 2032 (USD Billion)

8.3 SMEs

8.3.1 SMEs Market Trends Analysis (2020-2032)

8.3.2 SMEs Market Size Estimates and Forecasts to 2032 (USD Billion)

9. Physical Security Market Segmentation, by End Use

9.1 Chapter Overview

9.2 Transportation

9.2.1 Transportation Market Trends Analysis (2020-2032)

9.2.2 Transportation Market Size Estimates and Forecasts to 2032 (USD Billion)

9.3 Government

9.3.1 Government Market Trends Analysis (2020-2032)

9.3.2 Government Market Size Estimates and Forecasts to 2032 (USD Billion)

9.4 Banking & Finance

               9.4.1 Banking & Finance Market Trends Analysis (2020-2032)

9.4.2 Banking & Finance Market Size Estimates and Forecasts to 2032 (USD Billion)

9.5 Utility & Energy

9.5.1 Utility & Energy Market Trends Analysis (2020-2032)

9.5.2 Utility & Energy Market Size Estimates and Forecasts to 2032 (USD Billion)

9.6 Residential

9.6.1 Residential Market Trends Analysis (2020-2032)

9.6.2 Residential Market Size Estimates and Forecasts to 2032 (USD Billion)

9.7 Industrial

9.7.1 Industrial Market Trends Analysis (2020-2032)

9.7.2 Industrial Market Size Estimates and Forecasts to 2032 (USD Billion)

9.8 Retail

9.8.1 Retail Market Trends Analysis (2020-2032)

9.8.2 Retail Market Size Estimates and Forecasts to 2032 (USD Billion)

9.9 Commercial

9.9.1 Commercial Market Trends Analysis (2020-2032)

9.9.2 Commercial Market Size Estimates and Forecasts to 2032 (USD Billion)

9.10 Hospitality

9.10.1 Hospitality Market Trends Analysis (2020-2032)

9.10.2 Hospitality Market Size Estimates and Forecasts to 2032 (USD Billion)

9.11 Others

9.11.1 Others Market Trends Analysis (2020-2032)

9.11.2 Others Market Size Estimates and Forecasts to 2032 (USD Billion)

9. Regional Analysis

9.1 Chapter Overview

9.2 North America

9.2.1 Trends Analysis

9.2.2 North America Physical Security Market Estimates and Forecasts, by Country (2020-2032) (USD Billion)

9.2.3 North America Physical Security Market Estimates and Forecasts, by Application (2020-2032) (USD Billion)  

9.2.4 North America Physical Security Market Estimates and Forecasts, by End User (2020-2032) (USD Billion)

9.2.5 USA

9.2.5.1 USA Physical Security Market Estimates and Forecasts, by Application (2020-2032) (USD Billion)

9.2.5.2 USA Physical Security Market Estimates and Forecasts, by End User (2020-2032) (USD Billion)

9.2.6 Canada

9.2.6.1 Canada Physical Security Market Estimates and Forecasts, by Application (2020-2032) (USD Billion)

9.2.6.2 Canada Physical Security Market Estimates and Forecasts, by End User (2020-2032) (USD Billion)

9.2.7 Mexico

9.2.7.1 Mexico Physical Security Market Estimates and Forecasts, by Application (2020-2032) (USD Billion)

9.2.7.2 Mexico Physical Security Market Estimates and Forecasts, by End User (2020-2032) (USD Billion)

9.3 Europe

9.3.1 Eastern Europe

9.3.1.1 Trends Analysis

9.3.1.2 Eastern Europe Physical Security Market Estimates and Forecasts, by Country (2020-2032) (USD Billion)

9.3.1.3 Eastern Europe Physical Security Market Estimates and Forecasts, by Application (2020-2032) (USD Billion)  

9.3.1.4 Eastern Europe Physical Security Market Estimates and Forecasts, by End User (2020-2032) (USD Billion)

9.3.1.5 Poland

9.3.1.5.1 Poland Physical Security Market Estimates and Forecasts, by Application (2020-2032) (USD Billion)

9.3.1.5.2 Poland Physical Security Market Estimates and Forecasts, by End User (2020-2032) (USD Billion)

9.3.1.6 Romania

9.3.1.6.1 Romania Physical Security Market Estimates and Forecasts, by Application (2020-2032) (USD Billion)

9.3.1.6.2 Romania Physical Security Market Estimates and Forecasts, by End User (2020-2032) (USD Billion)

9.3.1.7 Hungary

9.3.1.7.1 Hungary Physical Security Market Estimates and Forecasts, by Application (2020-2032) (USD Billion)

9.3.1.7.2 Hungary Physical Security Market Estimates and Forecasts, by End User (2020-2032) (USD Billion)

9.3.1.8 Turkey

9.3.1.8.1 Turkey Physical Security Market Estimates and Forecasts, by Application (2020-2032) (USD Billion)

9.3.1.8.2 Turkey Physical Security Market Estimates and Forecasts, by End User (2020-2032) (USD Billion)

9.3.1.9 Rest of Eastern Europe

9.3.1.9.1 Rest of Eastern Europe Physical Security Market Estimates and Forecasts, by Application (2020-2032) (USD Billion)

9.3.1.9.2 Rest of Eastern Europe Physical Security Market Estimates and Forecasts, by End User (2020-2032) (USD Billion)

9.3.2 Western Europe

9.3.2.1 Trends Analysis

9.3.2.2 Western Europe Physical Security Market Estimates and Forecasts, by Country (2020-2032) (USD Billion)

9.3.2.3 Western Europe Physical Security Market Estimates and Forecasts, by Application (2020-2032) (USD Billion)  

9.3.2.4 Western Europe Physical Security Market Estimates and Forecasts, by End User (2020-2032) (USD Billion)

9.3.2.5 Germany

9.3.2.5.1 Germany Physical Security Market Estimates and Forecasts, by Application (2020-2032) (USD Billion)

9.3.2.5.2 Germany Physical Security Market Estimates and Forecasts, by End User (2020-2032) (USD Billion)

9.3.2.6 France

9.3.2.6.1 France Physical Security Market Estimates and Forecasts, by Application (2020-2032) (USD Billion)

9.3.2.6.2 France Physical Security Market Estimates and Forecasts, by End User (2020-2032) (USD Billion)

9.3.2.7 UK

9.3.2.7.1 UK Physical Security Market Estimates and Forecasts, by Application (2020-2032) (USD Billion)

9.3.2.7.2 UK Physical Security Market Estimates and Forecasts, by End User (2020-2032) (USD Billion)

9.3.2.8 Italy

9.3.2.8.1 Italy Physical Security Market Estimates and Forecasts, by Application (2020-2032) (USD Billion)

9.3.2.8.2 Italy Physical Security Market Estimates and Forecasts, by End User (2020-2032) (USD Billion)

9.3.2.9 Spain

9.3.2.9.1 Spain Physical Security Market Estimates and Forecasts, by Application (2020-2032) (USD Billion)

9.3.2.9.2 Spain Physical Security Market Estimates and Forecasts, by End User (2020-2032) (USD Billion)

9.3.2.10 Netherlands

9.3.2.10.1 Netherlands Physical Security Market Estimates and Forecasts, by Application (2020-2032) (USD Billion)

9.3.2.10.2 Netherlands Physical Security Market Estimates and Forecasts, by End User (2020-2032) (USD Billion)

9.3.2.11 Switzerland

9.3.2.11.1 Switzerland Physical Security Market Estimates and Forecasts, by Application (2020-2032) (USD Billion)

9.3.2.11.2 Switzerland Physical Security Market Estimates and Forecasts, by End User (2020-2032) (USD Billion)

9.3.2.12 Austria

9.3.2.12.1 Austria Physical Security Market Estimates and Forecasts, by Application (2020-2032) (USD Billion)

9.3.2.12.2 Austria Physical Security Market Estimates and Forecasts, by End User (2020-2032) (USD Billion)

9.3.2.13 Rest of Western Europe

9.3.2.13.1 Rest of Western Europe Physical Security Market Estimates and Forecasts, by Application (2020-2032) (USD Billion)

9.3.2.13.2 Rest of Western Europe Physical Security Market Estimates and Forecasts, by End User (2020-2032) (USD Billion)

9.4 Asia Pacific

9.4.1 Trends Analysis

9.4.2 Asia Pacific Physical Security Market Estimates and Forecasts, by Country (2020-2032) (USD Billion)

9.4.3 Asia Pacific Physical Security Market Estimates and Forecasts, by Application (2020-2032) (USD Billion)  

9.4.4 Asia Pacific Physical Security Market Estimates and Forecasts, by End User (2020-2032) (USD Billion)

9.4.5 China

9.4.5.1 China Physical Security Market Estimates and Forecasts, by Application (2020-2032) (USD Billion)

9.4.5.2 China Physical Security Market Estimates and Forecasts, by End User (2020-2032) (USD Billion)

9.4.6 India

9.4.5.1 India Physical Security Market Estimates and Forecasts, by Application (2020-2032) (USD Billion)

9.4.5.2 India Physical Security Market Estimates and Forecasts, by End User (2020-2032) (USD Billion)

9.4.5 Japan

9.4.5.1 Japan Physical Security Market Estimates and Forecasts, by Application (2020-2032) (USD Billion)

9.4.5.2 Japan Physical Security Market Estimates and Forecasts, by End User (2020-2032) (USD Billion)

9.4.6 South Korea

9.4.6.1 South Korea Physical Security Market Estimates and Forecasts, by Application (2020-2032) (USD Billion)

9.4.6.2 South Korea Physical Security Market Estimates and Forecasts, by End User (2020-2032) (USD Billion)

9.4.7 Vietnam

9.4.7.1 Vietnam Physical Security Market Estimates and Forecasts, by Application (2020-2032) (USD Billion)

9.2.7.2 Vietnam Physical Security Market Estimates and Forecasts, by End User (2020-2032) (USD Billion)

9.4.8 Singapore

9.4.8.1 Singapore Physical Security Market Estimates and Forecasts, by Application (2020-2032) (USD Billion)

9.4.8.2 Singapore Physical Security Market Estimates and Forecasts, by End User (2020-2032) (USD Billion)

9.4.9 Australia

9.4.9.1 Australia Physical Security Market Estimates and Forecasts, by Application (2020-2032) (USD Billion)

9.4.9.2 Australia Physical Security Market Estimates and Forecasts, by End User (2020-2032) (USD Billion)

9.4.10 Rest of Asia Pacific

9.4.10.1 Rest of Asia Pacific Physical Security Market Estimates and Forecasts, by Application (2020-2032) (USD Billion)

9.4.10.2 Rest of Asia Pacific Physical Security Market Estimates and Forecasts, by End User (2020-2032) (USD Billion)

9.5 Middle East and Africa

9.5.1 Middle East

9.5.1.1 Trends Analysis

9.5.1.2 Middle East Physical Security Market Estimates and Forecasts, by Country (2020-2032) (USD Billion)

9.5.1.3 Middle East Physical Security Market Estimates and Forecasts, by Application (2020-2032) (USD Billion)  

9.5.1.4 Middle East Physical Security Market Estimates and Forecasts, by End User (2020-2032) (USD Billion)

9.5.1.5 UAE

9.5.1.5.1 UAE Physical Security Market Estimates and Forecasts, by Application (2020-2032) (USD Billion)

9.5.1.5.2 UAE Physical Security Market Estimates and Forecasts, by End User (2020-2032) (USD Billion)

9.5.1.6 Egypt

9.5.1.6.1 Egypt Physical Security Market Estimates and Forecasts, by Application (2020-2032) (USD Billion)

9.5.1.6.2 Egypt Physical Security Market Estimates and Forecasts, by End User (2020-2032) (USD Billion)

9.5.1.7 Saudi Arabia

9.5.1.7.1 Saudi Arabia Physical Security Market Estimates and Forecasts, by Application (2020-2032) (USD Billion)

9.5.1.7.2 Saudi Arabia Physical Security Market Estimates and Forecasts, by End User (2020-2032) (USD Billion)

9.5.1.8 Qatar

9.5.1.8.1 Qatar Physical Security Market Estimates and Forecasts, by Application (2020-2032) (USD Billion)

9.5.1.8.2 Qatar Physical Security Market Estimates and Forecasts, by End User (2020-2032) (USD Billion)

9.5.1.9 Rest of Middle East

9.5.1.9.1 Rest of Middle East Physical Security Market Estimates and Forecasts, by Application (2020-2032) (USD Billion)

9.5.1.9.2 Rest of Middle East Physical Security Market Estimates and Forecasts, by End User (2020-2032) (USD Billion)

9.5.2 Africa

9.5.2.1 Trends Analysis

9.5.2.2 Africa Physical Security Market Estimates and Forecasts, by Country (2020-2032) (USD Billion)

9.5.2.3 Africa Physical Security Market Estimates and Forecasts, by Application (2020-2032) (USD Billion)  

9.5.2.4 Africa Physical Security Market Estimates and Forecasts, by End User (2020-2032) (USD Billion)

9.5.2.5 South Africa

9.5.2.5.1 South Africa Physical Security Market Estimates and Forecasts, by Application (2020-2032) (USD Billion)

9.5.2.5.2 South Africa Physical Security Market Estimates and Forecasts, by End User (2020-2032) (USD Billion)

9.5.2.6 Nigeria

9.5.2.6.1 Nigeria Physical Security Market Estimates and Forecasts, by Application (2020-2032) (USD Billion)

9.5.2.6.2 Nigeria Physical Security Market Estimates and Forecasts, by End User (2020-2032) (USD Billion)

9.5.2.7 Rest of Africa

9.5.2.7.1 Rest of Africa Physical Security Market Estimates and Forecasts, by Application (2020-2032) (USD Billion)

9.5.2.7.2 Rest of Africa Physical Security Market Estimates and Forecasts, by End User (2020-2032) (USD Billion)

9.6 Latin America

9.6.1 Trends Analysis

9.6.2 Latin America Physical Security Market Estimates and Forecasts, by Country (2020-2032) (USD Billion)

9.6.3 Latin America Physical Security Market Estimates and Forecasts, by Application (2020-2032) (USD Billion)  

9.6.4 Latin America Physical Security Market Estimates and Forecasts, by End User (2020-2032) (USD Billion)

9.6.5 Brazil

9.6.5.1 Brazil Physical Security Market Estimates and Forecasts, by Application (2020-2032) (USD Billion)

9.6.5.2 Brazil Physical Security Market Estimates and Forecasts, by End User (2020-2032) (USD Billion)

9.6.6 Argentina

9.6.6.1 Argentina Physical Security Market Estimates and Forecasts, by Application (2020-2032) (USD Billion)

9.6.6.2 Argentina Physical Security Market Estimates and Forecasts, by End User (2020-2032) (USD Billion)

9.6.7 Colombia

9.6.7.1 Colombia Physical Security Market Estimates and Forecasts, by Application (2020-2032) (USD Billion)

9.6.7.2 Colombia Physical Security Market Estimates and Forecasts, by End User (2020-2032) (USD Billion)

9.6.8 Rest of Latin America

9.6.8.1 Rest of Latin America Physical Security Market Estimates and Forecasts, by Application (2020-2032) (USD Billion)

9.6.8.2 Rest of Latin America Physical Security Market Estimates and Forecasts, by End User (2020-2032) (USD Billion)

10. Company Profiles

10.1 Tyco International

10.1.1 Company Overview

10.1.2 Financial

10.1.3 Products/ Services Offered

110.1.4 SWOT Analysis

10.2 Honeywell

10.2.1 Company Overview

10.2.2 Financial

10.2.3 Products/ Services Offered

10.2.4 SWOT Analysis

10.3 Bosch Security Systems

10.3.1 Company Overview

10.3.2 Financial

10.3.3 Products/ Services Offered

10.3.4 SWOT Analysis

10.4 Axis Communications

10.4.1 Company Overview

10.4.2 Financial

10.4.3 Products/ Services Offered

10.4.4 SWOT Analysis

10.5 Genetec

10.5.1 Company Overview

10.5.2 Financial

10.5.3 Products/ Services Offered

10.5.4 SWOT Analysis

10.6 ADT Inc

10.6.1 Company Overview

10.6.2 Financial

10.6.3 Products/ Services Offered

10.6.4 SWOT Analysis

10.7 Cisco Systems

10.7.1 Company Overview

10.7.2 Financial

10.7.3 Products/ Services Offered

10.7.4 SWOT Analysis

10.8 Hikvision

10.8.1 Company Overview

10.8.2 Financial

10.8.3 Products/ Services Offered

10.8.4 SWOT Analysis

10.9 Pelco

10.9.1 Company Overview

10.9.2 Financial

10.9.3 Products/ Services Offered

10.9.4 SWOT Analysis

10.10 Securitas AB

             10.9.1 Company Overview

10.9.2 Financial

10.9.3 Products/ Services Offered

10.9.4 SWOT Analysis

11. Use Cases and Best Practices

12. Conclusion

An accurate research report requires proper strategizing as well as implementation. There are multiple factors involved in the completion of good and accurate research report and selecting the best methodology to compete the research is the toughest part. Since the research reports we provide play a crucial role in any company’s decision-making process, therefore we at SNS Insider always believe that we should choose the best method which gives us results closer to reality. This allows us to reach at a stage wherein we can provide our clients best and accurate investment to output ratio.

Each report that we prepare takes a timeframe of 350-400 business hours for production. Starting from the selection of titles through a couple of in-depth brain storming session to the final QC process before uploading our titles on our website we dedicate around 350 working hours. The titles are selected based on their current market cap and the foreseen CAGR and growth.


The 5 steps process:

Step 1: Secondary Research:

Secondary Research or Desk Research is as the name suggests is a research process wherein, we collect data through the readily available information. In this process we use various paid and unpaid databases which our team has access to and gather data through the same. This includes examining of listed companies’ annual reports, Journals, SEC filling etc. Apart from this our team has access to various associations across the globe across different industries. Lastly, we have exchange relationships with various university as well as individual libraries.

Secondary Research

Step 2: Primary Research

When we talk about primary research, it is a type of study in which the researchers collect relevant data samples directly, rather than relying on previously collected data.  This type of research is focused on gaining content specific facts that can be sued to solve specific problems. Since the collected data is fresh and first hand therefore it makes the study more accurate and genuine.

We at SNS Insider have divided Primary Research into 2 parts.

Part 1 wherein we interview the KOLs of major players as well as the upcoming ones across various geographic regions. This allows us to have their view over the market scenario and acts as an important tool to come closer to the accurate market numbers. As many as 45 paid and unpaid primary interviews are taken from both the demand and supply side of the industry to make sure we land at an accurate judgement and analysis of the market.

This step involves the triangulation of data wherein our team analyses the interview transcripts, online survey responses and observation of on filed participants. The below mentioned chart should give a better understanding of the part 1 of the primary interview.

Primary Research

Part 2: In this part of primary research the data collected via secondary research and the part 1 of the primary research is validated with the interviews from individual consultants and subject matter experts.

Consultants are those set of people who have at least 12 years of experience and expertise within the industry whereas Subject Matter Experts are those with at least 15 years of experience behind their back within the same space. The data with the help of two main processes i.e., FGDs (Focused Group Discussions) and IDs (Individual Discussions). This gives us a 3rd party nonbiased primary view of the market scenario making it a more dependable one while collation of the data pointers.

Step 3: Data Bank Validation

Once all the information is collected via primary and secondary sources, we run that information for data validation. At our intelligence centre our research heads track a lot of information related to the market which includes the quarterly reports, the daily stock prices, and other relevant information. Our data bank server gets updated every fortnight and that is how the information which we collected using our primary and secondary information is revalidated in real time.

Data Bank Validation

Step 4: QA/QC Process

After all the data collection and validation our team does a final level of quality check and quality assurance to get rid of any unwanted or undesired mistakes. This might include but not limited to getting rid of the any typos, duplication of numbers or missing of any important information. The people involved in this process include technical content writers, research heads and graphics people. Once this process is completed the title gets uploader on our platform for our clients to read it.

Step 5: Final QC/QA Process:

This is the last process and comes when the client has ordered the study. In this process a final QA/QC is done before the study is emailed to the client. Since we believe in giving our clients a good experience of our research studies, therefore, to make sure that we do not lack at our end in any way humanly possible we do a final round of quality check and then dispatch the study to the client.

Key Segments:

By Component 

  • Systems

    • Physical Access Control System (PACS)

    • Video Surveillance System

    • Perimeter Intrusion Detection and Prevention

    • Physical Security Information Management (PSIM)

    • Physical Identity & Access Management (PIAM)

    • Fire and Life Safety

  • Services

    • System Integration

    • Remote Monitoring

    • Others

By Organization Size

  • Large Enterprises

  • SMEs

By End Use 

  • Transportation

  • Government

  • Banking & Finance

  • Utility & Energy

  • Residential

  • Industrial

  • Retail

  • Commercial

  • Hospitality

  • Others

Request for Segment Customization as per your Business Requirement: Segment Customization Request

REGIONAL COVERAGE:

North America

  • US

  • Canada

  • Mexico

Europe

  • Eastern Europe

    • Poland

    • Romania

    • Hungary

    • Turkey

    • Rest of Eastern Europe

  • Western Europe

    • Germany

    • France

    • UK

    • Italy

    • Spain

    • Netherlands

    • Switzerland

    • Austria

    • Rest of Western Europe

Asia Pacific

  • China

  • India

  • Japan

  • South Korea

  • Vietnam

  • Singapore

  • Australia

  • Rest of Asia Pacific

Middle East & Africa

  • Middle East

    • UAE

    • Egypt

    • Saudi Arabia

    • Qatar

    • Rest of the Middle East

  • Africa

    • Nigeria

    • South Africa

    • Rest of Africa

Latin America

  • Brazil

  • Argentina

  • Colombia

Request for Country Level Research Report: Country Level Customization Request

Available Customization

With the given market data, SNS Insider offers customization as per the company’s specific needs. The following customization options are available for the report:

  • Product Analysis

  • Criss-Cross segment analysis (e.g. Product X Application)

  • Product Matrix which gives a detailed comparison of the product portfolio of each company

  • Geographic Analysis

  • Additional countries in any of the regions

  • Company Information

  • Detailed analysis and profiling of additional market players (Up to five)


  •            5000 (33% Discount)


  •            8950 (40% Discount)


  •            3050 (23% Discount)

Start a Conversation

Hi! Click one of our member below to chat on Phone