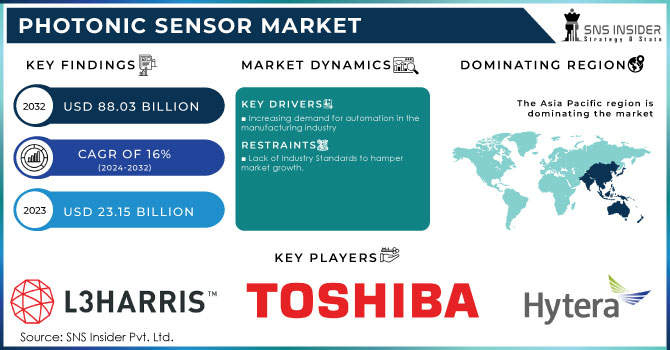
The Photonic Sensor Market was valued at USD 25.67 billion in 2023 and is expected to reach USD 77.99 billion by 2032, growing at a CAGR of 13.17% over the forecast period 2024-2032. Increased adoption of photonic sensing in industries such as automotive, healthcare, aerospace, and consumer electronics for high-accuracy and high-time resolution data is supporting the development of clear market opportunities for photonic sensors in the short term through increasing demand for these technologies. However, it is well known that reliability and performance metrics are essential, as industries utilize photonic sensors for high accuracy and durability in harsh environments. The use of sensors differs from use case to use case, with automotive (safety systems) and health care (diagnostics) sectors using them more frequently. Furthermore, the integration of photonic sensors with other technologies, including IoT devices and AI systems, is increasing the flexibility and range of photonic sensors for various applications.
Get more information on Photonic Sensor Market - Request Sample Report
Key Drivers:
Driving Forces Behind Photonic Sensor Market Growth in Automation Smart Manufacturing and Autonomous Vehicle Trends
Technological advancement and Growing Demand for high-precision & efficient sensors in various End-user industries are playing key drivers in the Photonic Sensor Market. The market is driven by the increase in automation along with the rising demands for real-time data and monitoring. Photonic sensors are growing in prominence within industries including healthcare, aerospace, and automotive applications due to the high-resolution imaging, fast response, and robustness offered. We know that the trend of smart manufacturing, autonomous vehicles, and increased deployment of IoT devices would also increase the market for photonic sensors.
Restrain:
Restrain in Photonic Sensor Design and Integration Hindering Broader Industry Adoption and Implementation
The complexity of both photonic sensor design and integration to existing systems translates to one of the primary determinants [that is limiting the] photonic sensor market. Creating sensors that are not only highly sensitive, but also efficient, stable, and durable, is technologically difficult and requires advanced materials and manufacturing methods. Additionally, due to the high skill required in photonics and optical technologies, this is only available to smaller amounts of specialized manufacturers and therefore does not allow for a larger amount of industry-wide implementation.
Opportunity:
Emerging Market Opportunities for Photonic Sensors in Healthcare 5G Telecom and Asia-Pacific Growth
Market opportunities exist for new, smaller, and cheaper sensor technologies. Along with various biophotonic and image sensor innovations, it can be promising for healthcare diagnostics, environmental monitoring & industrial applications. In addition, the growth of 5G and other beyond 5 G communication networks are finding new markets for photonic sensors, particularly in telco and data center environments. Photonic sensor solutions deliver better performance and enable a level of automation and operational efficiency that is the norm for industries in these emerging markets, resulting in significant adoption and strong growth in Asia-Pacific emerging markets.
Challenges:
Challenges from Competing Technologies and Harsh Environments Hindering Photonic Sensor Performance and Adoption
The other concern is the competition from alternative sensing technologies. Although photonic sensors yield high accuracy and sensitivity, other competing sensor technologies such as electronic or MEMS sensors, show similar functionalities at lower complexity and they can be beneficial for various applications. Also, in many industrial and automotive applications, temperature fluctuations, humidity, and vibrations affect sensor performance. These endeavors to solve these challenges necessitate ongoing development with new materials, design, and shielding methods, in addition to further understanding the challenges of making photonic sensors responsive to increasingly diverse, but harsher, environments.
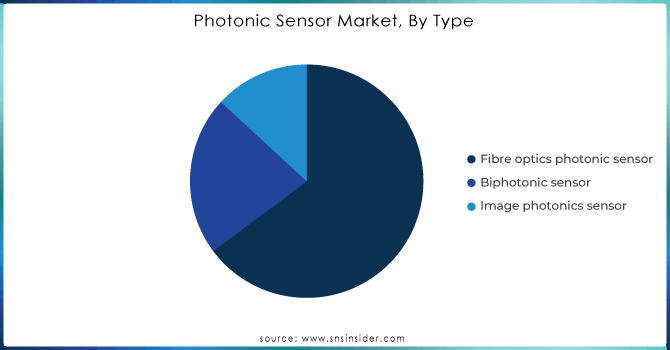
By Type
In 2023, image sensors retained the largest share of the overall photonic sensor market (41.2%) due to the high deployment of imaging systems in various applications including consumer electronics, automotive, healthcare, and security systems. This segment is growing due to the need for high-resolution imaging and advanced visual capabilities in smartphones, cameras, and autonomous vehicles. The precision and real-time information captured using image sensors render them an irreplaceable part of these applications where it is pertinent to work accurately and a reason for their market dominance for applications in medical diagnostics, industrial monitoring, etc.
Fiber Optic Sensors are expected to experience the fastest CAGR from 2024 to 2032, owing to unique benefits including high accuracy over extended range, high sensitivity, lack of electromagnetic interference, etc. With the increasing importance of reliable and efficient monitoring systems among end-use industries such as telecommunications, oil and gas, and power grids, the demand for these sensors will increase. Due to their prowess for extreme environment handling and continuous data-fed capabilities, they are among the most capable and quickly growing vertically for the highest number of our emerging applications for a few more years to come.
By End-use
The automotive sector accounted for 30.5% of the market share in 2023, due to the rising demand for ADAS, autonomous vehicles, and smart manufacturing technologies. Abstract Photonics has a major role in automotive applications, including LiDAR and optical cameras for enhanced vehicle safety and navigation to increase driving efficiency, resulting in the integration of many optical sensors on board cars today. Photonic sensor technologies in automotive had additional impetus from increased demand due to the growing electric vehicles (EVs) market and increased regulatory standards on vehicle safety and emissions.
The consumer electronics segment is expected to grow at the fastest CAGR from 2024 to 2032. Fueled by ongoing developments in smartphones, wearable technology, AR and other smart consumer gadgets that utilize significant amounts of photonic sensors including image sensors and proximity sensors. Consumer demand for more advanced, immersive, and low-power technologies will drive increased adoption of photonic sensors in consumer electronics, but growth is expected to gain momentum in the years ahead.
Get Customized Report as per your Business Requirement - Request For Customized Report
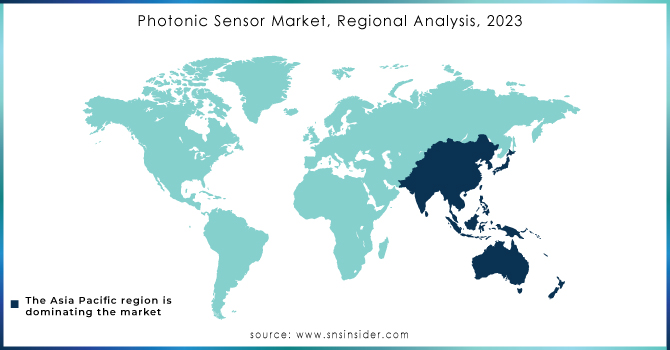
In 2023, North America captured a 35.4% share in the photonic sensors market, owing to the technological advancements in automotive, aerospace, healthcare, and consumer electronics. The strong local presence of key technology companies and research institutions, as well as a high adoption rate of emerging technologies, keep the region at the top of the global rankings. Take the automotive sector as an example, wherein auto manufacturers such as Tesla and General Motors are investing in photonic sensors for their autonomous vehicles, using LiDAR and other imaging technologies to assist with deterministic safe driving and navigation.
Asia Pacific is expected to grow at the fastest CAGR from 2024 to 2032. This boom is driven by rapid industrialization, technological progress, and the expansion of smart technology across industries. Photonic sensors are more prevalent in areas like telecommunications and consumer electronics in countries such as China and Japan. Examples include photonic sensors employed in state-of-the-art consumer electronics by corporations such as Huawei and Sony, or even their application in driverless cars the latter being pursued by Japan’s own Toyota Corporation.
Some of the major players in the Photonic Sensor Market are:
Honeywell (Fibre Optic Sensors, Laser Sensors)
Siemens (Optical Sensors, Photoelectric Sensors)
STMicroelectronics (Time-of-Flight (ToF) Sensors, Light Sensors)
Texas Instruments (Infrared Sensors, Optical Sensors)
Bosch (LIDAR Sensors, Light Sensors)
Analog Devices (Photodiodes, Light-to-Digital Sensors)
ams OSRAM (Ambient Light Sensors, Optical Sensors)
Keysight Technologies (Optical Power Sensors, Photodetectors)
Thorlabs (Optical Power Meters, Photodiodes)
Opto Diode (Photodiodes, Optical Sensors)
Edinburgh Instruments (Photoluminescence Sensors, UV Detectors)
Lumentum (Optical Sensors, LiDAR Sensors)
Murata Manufacturing (Ambient Light Sensors, Distance Sensors)
Vigo System (Photodiodes, Pyroelectric Detectors)
Hamamatsu Photonics (Photomultiplier Tubes, Light Sensors)
In March 2024, Honeywell announced its acquisition of Civitanavi Systems, an Italian optical gyro specialist, for EURO 200 million.
In October 2024, Siemens extended its partnership with TSMC, enhancing collaboration on advanced semiconductor processes and certifications.
In July 2024, STMicroelectronics launched the VL53L4ED, a single-zone Time-of-Flight sensor with an extended operating temperature range of -40°C to 105°C, designed for industrial applications.
| Report Attributes | Details |
| Market Size in 2023 | USD 25.67 Billion |
| Market Size by 2032 | USD 77.99 Billion |
| CAGR | CAGR of 13.17% From 2024 to 2032 |
| Base Year | 2023 |
| Forecast Period | 2024-2032 |
| Historical Data | 2020-2022 |
| Report Scope & Coverage | Market Size, Segments Analysis, Competitive Landscape, Regional Analysis, DROC & SWOT Analysis, Forecast Outlook |
| Key Segments | • By Type (Fiber Optic Sensors, Image Sensors, Biophotonic Sensors) • By End use (Aerospace and Defense, Automotive, Consumer Electronics Source, Healthcare, Energy and Power, Others) |
| Regional Analysis/Coverage | North America (US, Canada, Mexico), Europe (Eastern Europe [Poland, Romania, Hungary, Turkey, Rest of Eastern Europe] Western Europe] Germany, France, UK, Italy, Spain, Netherlands, Switzerland, Austria, Rest of Western Europe]), Asia Pacific (China, India, Japan, South Korea, Vietnam, Singapore, Australia, Rest of Asia Pacific), Middle East & Africa (Middle East [UAE, Egypt, Saudi Arabia, Qatar, Rest of Middle East], Africa [Nigeria, South Africa, Rest of Africa], Latin America (Brazil, Argentina, Colombia, Rest of Latin America) |
| Company Profiles | Honeywell, Siemens, STMicroelectronics, Texas Instruments, Bosch, Analog Devices, ams OSRAM, Keysight Technologies, Thorlabs, Opto Diode, Edinburgh Instruments, Lumentum, Murata Manufacturing, Vigo System, Hamamatsu Photonics. |
Ans: The Photonic Sensor Market is expected to grow at a CAGR of 13.17% during 2024-2032.
Ans: Photonic Sensor Market size was USD 25.67 Billion in 2023 and is expected to Reach USD 77.99 Billion by 2032.
Ans: The major growth factor of the Photonic Sensor market is the increasing demand for high-precision sensing technologies across industries like automotive, healthcare, and consumer electronics.
Ans: The Image Sensors segment dominated the Industrial battery market in 2023.
Ans: North America dominated the Photonic Sensor Market in 2023.
Table of Content
1. Introduction
1.1 Market Definition
1.2 Scope (Inclusion and Exclusions)
1.3 Research Assumptions
2. Executive Summary
2.1 Market Overview
2.2 Regional Synopsis
2.3 Competitive Summary
3. Research Methodology
3.1 Top-Down Approach
3.2 Bottom-up Approach
3.3. Data Validation
3.4 Primary Interviews
4. Market Dynamics Impact Analysis
4.1 Market Driving Factors Analysis
4.1.1 Drivers
4.1.2 Restraints
4.1.3 Opportunities
4.1.4 Challenges
4.2 PESTLE Analysis
4.3 Porter’s Five Forces Model
5. Statistical Insights and Trends Reporting
5.1 Photonic Sensor Reliability and Performance Metrics (2023)
5.2 Photonic Sensor Usage Frequency
5.3 Photonic Sensor Integration and Compatibility
6. Competitive Landscape
6.1 List of Major Companies, By Region
6.2 Market Share Analysis, By Region
6.3 Product Benchmarking
6.3.1 Product specifications and features
6.3.2 Pricing
6.4 Strategic Initiatives
6.4.1 Marketing and promotional activities
6.4.2 Distribution and Supply Chain Strategies
6.4.3 Expansion plans and new product launches
6.4.4 Strategic partnerships and collaborations
6.5 Technological Advancements
6.6 Market Positioning and Branding
7. Photonic Sensor Market Segmentation, By Type
7.1 Chapter Overview
7.2 Fiber Optic Sensors
7.2.1 Fiber Optic Sensors Market Trends Analysis (2020-2032)
7.2.2 Fiber Optic Sensors Market Size Estimates and Forecasts to 2032 (USD BILLION)
7.3 Image Sensors
7.3.1 Image Sensors Market Trends Analysis (2020-2032)
7.3.2 Image Sensors Market Size Estimates and Forecasts to 2032 (USD BILLION)
7.4 Biophotonic Sensors
7.4.1 Biophotonic Sensors Market Trends Analysis (2020-2032)
7.4.2 Biophotonic Sensors Market Size Estimates and Forecasts to 2032 (USD BILLION)
8. Photonic Sensor Market Segmentation, By End-use
8.1 Chapter Overview
8.2 Aerospace and Defense
8.2.1 Aerospace and Defense Market Trends Analysis (2020-2032)
8.2.2 Aerospace and Defense Market Size Estimates and Forecasts to 2032 (USD BILLION)
8.3 Automotive
8.3.1 Automotive Market Trends Analysis (2020-2032)
8.3.2 Automotive Market Size Estimates and Forecasts to 2032 (USD BILLION)
8.4 Consumer Electronics
8.4.1 Consumer Electronics Market Trends Analysis (2020-2032)
8.4.2 Consumer Electronics Market Size Estimates and Forecasts to 2032 (USD BILLION)
8.5 Healthcare
8.5.1 Healthcare Market Trends Analysis (2020-2032)
8.5.2 Healthcare Market Size Estimates and Forecasts to 2032 (USD BILLION)
8.6 Energy and Power
8.6.1 Energy and Power Market Trends Analysis (2020-2032)
8.6.2 Energy and Power Market Size Estimates and Forecasts to 2032 (USD BILLION)
8.7 Others
8.7.1 Others Market Trends Analysis (2020-2032)
8.7.2 Others Market Size Estimates and Forecasts to 2032 (USD BILLION)
9. Regional Analysis
9.1 Chapter Overview
9.2 North America
9.2.1 Trends Analysis
9.2.2 North America Photonic Sensor Market Estimates and Forecasts, by Country (2020-2032) (USD BILLION)
9.2.3 North America Photonic Sensor Market Estimates and Forecasts, By Type (2020-2032) (USD BILLION)
9.2.4 North America Photonic Sensor Market Estimates and Forecasts, By End Use (2020-2032) (USD BILLION)
9.2.5 USA
9.2.5.1 USA Photonic Sensor Market Estimates and Forecasts, By Type (2020-2032) (USD BILLION)
9.2.5.2 USA Photonic Sensor Market Estimates and Forecasts, By End Use (2020-2032) (USD BILLION)
9.2.6 Canada
9.2.6.1 Canada Photonic Sensor Market Estimates and Forecasts, By Type (2020-2032) (USD BILLION)
9.2.6.2 Canada Photonic Sensor Market Estimates and Forecasts, By End Use (2020-2032) (USD BILLION)
9.2.7 Mexico
9.2.7.1 Mexico Photonic Sensor Market Estimates and Forecasts, By Type (2020-2032) (USD BILLION)
9.2.7.2 Mexico Photonic Sensor Market Estimates and Forecasts, By End Use (2020-2032) (USD BILLION)
9.3 Europe
9.3.1 Eastern Europe
9.3.1.1 Trends Analysis
9.3.1.2 Eastern Europe Photonic Sensor Market Estimates and Forecasts, by Country (2020-2032) (USD BILLION)
9.3.1.3 Eastern Europe Photonic Sensor Market Estimates and Forecasts, By Type (2020-2032) (USD BILLION)
9.3.1.4 Eastern Europe Photonic Sensor Market Estimates and Forecasts, By End Use (2020-2032) (USD BILLION)
9.3.1.5 Poland
9.3.1.5.1 Poland Photonic Sensor Market Estimates and Forecasts, By Type (2020-2032) (USD BILLION)
9.3.1.5.2 Poland Photonic Sensor Market Estimates and Forecasts, By End Use (2020-2032) (USD BILLION)
9.3.1.6 Romania
9.3.1.6.1 Romania Photonic Sensor Market Estimates and Forecasts, By Type (2020-2032) (USD BILLION)
9.3.1.6.2 Romania Photonic Sensor Market Estimates and Forecasts, By End Use (2020-2032) (USD BILLION)
9.3.1.7 Hungary
9.3.1.7.1 Hungary Photonic Sensor Market Estimates and Forecasts, By Type (2020-2032) (USD BILLION)
9.3.1.7.2 Hungary Photonic Sensor Market Estimates and Forecasts, By End Use (2020-2032) (USD BILLION)
9.3.1.8 turkey
9.3.1.8.1 Turkey Photonic Sensor Market Estimates and Forecasts, By Type (2020-2032) (USD BILLION)
9.3.1.8.2 Turkey Photonic Sensor Market Estimates and Forecasts, By End Use (2020-2032) (USD BILLION)
9.3.1.9 Rest of Eastern Europe
9.3.1.9.1 Rest of Eastern Europe Photonic Sensor Market Estimates and Forecasts, By Type (2020-2032) (USD BILLION)
9.3.1.9.2 Rest of Eastern Europe Photonic Sensor Market Estimates and Forecasts, By End Use (2020-2032) (USD BILLION)
9.3.2 Western Europe
9.3.2.1 Trends Analysis
9.3.2.2 Western Europe Photonic Sensor Market Estimates and Forecasts, by Country (2020-2032) (USD BILLION)
9.3.2.3 Western Europe Photonic Sensor Market Estimates and Forecasts, By Type (2020-2032) (USD BILLION)
9.3.2.4 Western Europe Photonic Sensor Market Estimates and Forecasts, By End Use (2020-2032) (USD BILLION)
9.3.2.5 Germany
9.3.2.5.1 Germany Photonic Sensor Market Estimates and Forecasts, By Type (2020-2032) (USD BILLION)
9.3.2.5.2 Germany Photonic Sensor Market Estimates and Forecasts, By End Use (2020-2032) (USD BILLION)
9.3.2.6 France
9.3.2.6.1 France Photonic Sensor Market Estimates and Forecasts, By Type (2020-2032) (USD BILLION)
9.3.2.6.2 France Photonic Sensor Market Estimates and Forecasts, By End Use (2020-2032) (USD BILLION)
9.3.2.7 UK
9.3.2.7.1 UK Photonic Sensor Market Estimates and Forecasts, By Type (2020-2032) (USD BILLION)
9.3.2.7.2 UK Photonic Sensor Market Estimates and Forecasts, By End Use (2020-2032) (USD BILLION)
9.3.2.8 Italy
9.3.2.8.1 Italy Photonic Sensor Market Estimates and Forecasts, By Type (2020-2032) (USD BILLION)
9.3.2.8.2 Italy Photonic Sensor Market Estimates and Forecasts, By End Use (2020-2032) (USD BILLION)
9.3.2.9 Spain
9.3.2.9.1 Spain Photonic Sensor Market Estimates and Forecasts, By Type (2020-2032) (USD BILLION)
9.3.2.9.2 Spain Photonic Sensor Market Estimates and Forecasts, By End Use (2020-2032) (USD BILLION)
9.3.2.10 Netherlands
9.3.2.10.1 Netherlands Photonic Sensor Market Estimates and Forecasts, By Type (2020-2032) (USD BILLION)
9.3.2.10.2 Netherlands Photonic Sensor Market Estimates and Forecasts, By End Use (2020-2032) (USD BILLION)
9.3.2.11 Switzerland
9.3.2.11.1 Switzerland Photonic Sensor Market Estimates and Forecasts, By Type (2020-2032) (USD BILLION)
9.3.2.11.2 Switzerland Photonic Sensor Market Estimates and Forecasts, By End Use (2020-2032) (USD BILLION)
9.3.2.12 Austria
9.3.2.12.1 Austria Photonic Sensor Market Estimates and Forecasts, By Type (2020-2032) (USD BILLION)
9.3.2.12.2 Austria Photonic Sensor Market Estimates and Forecasts, By End Use (2020-2032) (USD BILLION)
9.3.2.13 Rest of Western Europe
9.3.2.13.1 Rest of Western Europe Photonic Sensor Market Estimates and Forecasts, By Type (2020-2032) (USD BILLION)
9.3.2.13.2 Rest of Western Europe Photonic Sensor Market Estimates and Forecasts, By End Use (2020-2032) (USD BILLION)
9.4 Asia Pacific
9.4.1 Trends Analysis
9.4.2 Asia Pacific Photonic Sensor Market Estimates and Forecasts, by Country (2020-2032) (USD BILLION)
9.4.3 Asia Pacific Photonic Sensor Market Estimates and Forecasts, By Type (2020-2032) (USD BILLION)
9.4.4 Asia Pacific Photonic Sensor Market Estimates and Forecasts, By End Use (2020-2032) (USD BILLION)
9.4.5 China
9.4.5.1 China Photonic Sensor Market Estimates and Forecasts, By Type (2020-2032) (USD BILLION)
9.4.5.2 China Photonic Sensor Market Estimates and Forecasts, By End Use (2020-2032) (USD BILLION)
9.4.6 India
9.4.5.1 India Photonic Sensor Market Estimates and Forecasts, By Type (2020-2032) (USD BILLION)
9.4.5.2 India Photonic Sensor Market Estimates and Forecasts, By End Use (2020-2032) (USD BILLION)
9.4.5 japan
9.4.5.1 Japan Photonic Sensor Market Estimates and Forecasts, By Type (2020-2032) (USD BILLION)
9.4.5.2 Japan Photonic Sensor Market Estimates and Forecasts, By End Use (2020-2032) (USD BILLION)
9.4.6 South Korea
9.4.6.1 South Korea Photonic Sensor Market Estimates and Forecasts, By Type (2020-2032) (USD BILLION)
9.4.6.2 South Korea Photonic Sensor Market Estimates and Forecasts, By End Use (2020-2032) (USD BILLION)
9.4.7 Vietnam
9.4.7.1 Vietnam Photonic Sensor Market Estimates and Forecasts, By Type (2020-2032) (USD BILLION)
9.2.7.2 Vietnam Photonic Sensor Market Estimates and Forecasts, By End Use (2020-2032) (USD BILLION)
9.4.8 Singapore
9.4.8.1 Singapore Photonic Sensor Market Estimates and Forecasts, By Type (2020-2032) (USD BILLION)
9.4.8.2 Singapore Photonic Sensor Market Estimates and Forecasts, By End Use (2020-2032) (USD BILLION)
9.4.9 Australia
9.4.9.1 Australia Photonic Sensor Market Estimates and Forecasts, By Type (2020-2032) (USD BILLION)
9.4.9.2 Australia Photonic Sensor Market Estimates and Forecasts, By End Use (2020-2032) (USD BILLION)
9.4.10 Rest of Asia Pacific
9.4.10.1 Rest of Asia Pacific Photonic Sensor Market Estimates and Forecasts, By Type (2020-2032) (USD BILLION)
9.4.10.2 Rest of Asia Pacific Photonic Sensor Market Estimates and Forecasts, By End Use (2020-2032) (USD BILLION)
9.5 Middle East and Africa
9.5.1 Middle East
9.5.1.1 Trends Analysis
9.5.1.2 Middle East Photonic Sensor Market Estimates and Forecasts, by Country (2020-2032) (USD BILLION)
9.5.1.3 Middle East Photonic Sensor Market Estimates and Forecasts, By Type (2020-2032) (USD BILLION)
9.5.1.4 Middle East Photonic Sensor Market Estimates and Forecasts, By End Use (2020-2032) (USD BILLION)
9.5.1.5 UAE
9.5.1.5.1 UAE Photonic Sensor Market Estimates and Forecasts, By Type (2020-2032) (USD BILLION)
9.5.1.5.2 UAE Photonic Sensor Market Estimates and Forecasts, By End Use (2020-2032) (USD BILLION)
9.5.1.6 Egypt
9.5.1.6.1 Egypt Photonic Sensor Market Estimates and Forecasts, By Type (2020-2032) (USD BILLION)
9.5.1.6.2 Egypt Photonic Sensor Market Estimates and Forecasts, By End Use (2020-2032) (USD BILLION)
9.5.1.7 Saudi Arabia
9.5.1.7.1 Saudi Arabia Photonic Sensor Market Estimates and Forecasts, By Type (2020-2032) (USD BILLION)
9.5.1.7.2 Saudi Arabia Photonic Sensor Market Estimates and Forecasts, By End Use (2020-2032) (USD BILLION)
9.5.1.8 Qatar
9.5.1.8.1 Qatar Photonic Sensor Market Estimates and Forecasts, By Type (2020-2032) (USD BILLION)
9.5.1.8.2 Qatar Photonic Sensor Market Estimates and Forecasts, By End Use (2020-2032) (USD BILLION)
9.5.1.9 Rest of Middle East
9.5.1.9.1 Rest of Middle East Photonic Sensor Market Estimates and Forecasts, By Type (2020-2032) (USD BILLION)
9.5.1.9.2 Rest of Middle East Photonic Sensor Market Estimates and Forecasts, By End Use (2020-2032) (USD BILLION)
9.5.2 Africa
9.5.2.1 Trends Analysis
9.5.2.2 Africa Photonic Sensor Market Estimates and Forecasts, by Country (2020-2032) (USD BILLION)
9.5.2.3 Africa Photonic Sensor Market Estimates and Forecasts, By Type (2020-2032) (USD BILLION)
9.5.2.4 Africa Photonic Sensor Market Estimates and Forecasts, By End Use (2020-2032) (USD BILLION)
9.5.2.5 South Africa
9.5.2.5.1 South Africa Photonic Sensor Market Estimates and Forecasts, By Type (2020-2032) (USD BILLION)
9.5.2.5.2 South Africa Photonic Sensor Market Estimates and Forecasts, By End Use (2020-2032) (USD BILLION)
9.5.2.6 Nigeria
9.5.2.6.1 Nigeria Photonic Sensor Market Estimates and Forecasts, By Type (2020-2032) (USD BILLION)
9.5.2.6.2 Nigeria Photonic Sensor Market Estimates and Forecasts, By End Use (2020-2032) (USD BILLION)
9.5.2.7 Rest of Africa
9.5.2.7.1 Rest of Africa Photonic Sensor Market Estimates and Forecasts, By Type (2020-2032) (USD BILLION)
9.5.2.7.2 Rest of Africa Photonic Sensor Market Estimates and Forecasts, By End Use (2020-2032) (USD BILLION)
9.6 Latin America
9.6.1 Trends Analysis
9.6.2 Latin America Photonic Sensor Market Estimates and Forecasts, by Country (2020-2032) (USD BILLION)
9.6.3 Latin America Photonic Sensor Market Estimates and Forecasts, By Type (2020-2032) (USD BILLION)
9.6.4 Latin America Photonic Sensor Market Estimates and Forecasts, By End Use (2020-2032) (USD BILLION)
9.6.5 Brazil
9.6.5.1 Brazil Photonic Sensor Market Estimates and Forecasts, By Type (2020-2032) (USD BILLION)
9.6.5.2 Brazil Photonic Sensor Market Estimates and Forecasts, By End Use (2020-2032) (USD BILLION)
9.6.6 Argentina
9.6.6.1 Argentina Photonic Sensor Market Estimates and Forecasts, By Type (2020-2032) (USD BILLION)
9.6.6.2 Argentina Photonic Sensor Market Estimates and Forecasts, By End Use (2020-2032) (USD BILLION)
9.6.7 Colombia
9.6.7.1 Colombia Photonic Sensor Market Estimates and Forecasts, By Type (2020-2032) (USD BILLION)
9.6.7.2 Colombia Photonic Sensor Market Estimates and Forecasts, By End Use (2020-2032) (USD BILLION)
9.6.8 Rest of Latin America
9.6.8.1 Rest of Latin America Photonic Sensor Market Estimates and Forecasts, By Type (2020-2032) (USD BILLION)
9.6.8.2 Rest of Latin America Photonic Sensor Market Estimates and Forecasts, By End Use (2020-2032) (USD BILLION)
10. Company Profiles
10.1 Honeywell
10.1.1 Company Overview
10.1.2 Financial
10.1.3 Products/ Services Offered
110.1.4 SWOT Analysis
10.2 Siemens
10.2.1 Company Overview
10.2.2 Financial
10.2.3 Products/ Services Offered
10.2.4 SWOT Analysis
10.3 STMicroelectronics
10.3.1 Company Overview
10.3.2 Financial
10.3.3 Products/ Services Offered
10.3.4 SWOT Analysis
10.4 Texas Instruments
10.4.1 Company Overview
10.4.2 Financial
10.4.3 Products/ Services Offered
10.4.4 SWOT Analysis
10.5 Bosch
10.5.1 Company Overview
10.5.2 Financial
10.5.3 Products/ Services Offered
10.5.4 SWOT Analysis
10.6 Analog Devices
10.6.1 Company Overview
10.6.2 Financial
10.6.3 Products/ Services Offered
10.6.4 SWOT Analysis
10.7 ams OSRAM
10.7.1 Company Overview
10.7.2 Financial
10.7.3 Products/ Services Offered
10.7.4 SWOT Analysis
10.8 Keysight Technologies
10.8.1 Company Overview
10.8.2 Financial
10.8.3 Products/ Services Offered
10.8.4 SWOT Analysis
10.9 Thorlabs
10.9.1 Company Overview
10.9.2 Financial
10.9.3 Products/ Services Offered
10.9.4 SWOT Analysis
10.10 Opto Diode.
10.9.1 Company Overview
10.9.2 Financial
10.9.3 Products/ Services Offered
10.9.4 SWOT Analysis
11. Use Cases and Best Practices
12. Conclusion
An accurate research report requires proper strategizing as well as implementation. There are multiple factors involved in the completion of good and accurate research report and selecting the best methodology to compete the research is the toughest part. Since the research reports we provide play a crucial role in any company’s decision-making process, therefore we at SNS Insider always believe that we should choose the best method which gives us results closer to reality. This allows us to reach at a stage wherein we can provide our clients best and accurate investment to output ratio.
Each report that we prepare takes a timeframe of 350-400 business hours for production. Starting from the selection of titles through a couple of in-depth brain storming session to the final QC process before uploading our titles on our website we dedicate around 350 working hours. The titles are selected based on their current market cap and the foreseen CAGR and growth.
The 5 steps process:
Step 1: Secondary Research:
Secondary Research or Desk Research is as the name suggests is a research process wherein, we collect data through the readily available information. In this process we use various paid and unpaid databases which our team has access to and gather data through the same. This includes examining of listed companies’ annual reports, Journals, SEC filling etc. Apart from this our team has access to various associations across the globe across different industries. Lastly, we have exchange relationships with various university as well as individual libraries.

Step 2: Primary Research
When we talk about primary research, it is a type of study in which the researchers collect relevant data samples directly, rather than relying on previously collected data. This type of research is focused on gaining content specific facts that can be sued to solve specific problems. Since the collected data is fresh and first hand therefore it makes the study more accurate and genuine.
We at SNS Insider have divided Primary Research into 2 parts.
Part 1 wherein we interview the KOLs of major players as well as the upcoming ones across various geographic regions. This allows us to have their view over the market scenario and acts as an important tool to come closer to the accurate market numbers. As many as 45 paid and unpaid primary interviews are taken from both the demand and supply side of the industry to make sure we land at an accurate judgement and analysis of the market.
This step involves the triangulation of data wherein our team analyses the interview transcripts, online survey responses and observation of on filed participants. The below mentioned chart should give a better understanding of the part 1 of the primary interview.

Part 2: In this part of primary research the data collected via secondary research and the part 1 of the primary research is validated with the interviews from individual consultants and subject matter experts.
Consultants are those set of people who have at least 12 years of experience and expertise within the industry whereas Subject Matter Experts are those with at least 15 years of experience behind their back within the same space. The data with the help of two main processes i.e., FGDs (Focused Group Discussions) and IDs (Individual Discussions). This gives us a 3rd party nonbiased primary view of the market scenario making it a more dependable one while collation of the data pointers.
Step 3: Data Bank Validation
Once all the information is collected via primary and secondary sources, we run that information for data validation. At our intelligence centre our research heads track a lot of information related to the market which includes the quarterly reports, the daily stock prices, and other relevant information. Our data bank server gets updated every fortnight and that is how the information which we collected using our primary and secondary information is revalidated in real time.

Step 4: QA/QC Process
After all the data collection and validation our team does a final level of quality check and quality assurance to get rid of any unwanted or undesired mistakes. This might include but not limited to getting rid of the any typos, duplication of numbers or missing of any important information. The people involved in this process include technical content writers, research heads and graphics people. Once this process is completed the title gets uploader on our platform for our clients to read it.
Step 5: Final QC/QA Process:
This is the last process and comes when the client has ordered the study. In this process a final QA/QC is done before the study is emailed to the client. Since we believe in giving our clients a good experience of our research studies, therefore, to make sure that we do not lack at our end in any way humanly possible we do a final round of quality check and then dispatch the study to the client.
Key Segments:
By Type
Fiber Optic Sensors
Image Sensors
Biophotonic Sensors
By End Use
Aerospace and Defense
Automotive
Consumer Electronics Source
Healthcare
Energy and Power
Others
Request for Segment Customization as per your Business Requirement: Segment Customization Request
Regional Coverage:
North America
US
Canada
Mexico
Europe
Eastern Europe
Poland
Romania
Hungary
Turkey
Rest of Eastern Europe
Western Europe
Germany
France
UK
Italy
Spain
Netherlands
Switzerland
Austria
Rest of Western Europe
Asia Pacific
China
India
Japan
South Korea
Vietnam
Singapore
Australia
Rest of Asia Pacific
Middle East & Africa
Middle East
UAE
Egypt
Saudi Arabia
Qatar
Rest of Middle East
Africa
Nigeria
South Africa
Rest of Africa
Latin America
Brazil
Argentina
Colombia
Rest of Latin America
Request for Country Level Research Report: Country Level Customization Request
Available Customization
With the given market data, SNS Insider offers customization as per the company’s specific needs. The following customization options are available for the report:
Detailed Volume Analysis
Criss-Cross segment analysis (e.g. Product X Application)
Competitive Product Benchmarking
Geographic Analysis
Additional countries in any of the regions
Customized Data Representation
Detailed analysis and profiling of additional market players
The Advanced Lead-Free Piezoelectric Materials Market was valued at USD 145.10 Billion in 2023 and is projected to reach USD 558.75 Billion by 2032, growing at a robust CAGR of 16.17% during the forecast period from 2024 to 2032.
The Power Strip Market Size was valued at USD 12.65 Billion in 2023 and is expected to grow at a CAGR of 5.0% to reach USD 19.64 Billion by 2032.
The Mobile Phone Power Accessories Market size was valued at USD 38.19 billion in 2023 and is expected to grow at a CAGR of 6.33% from Forecast 2024-2032.
The 3D Snapshot Sensor Market size was valued at USD 8.83 Billion in 2023 and is Projected to grow at a CAGR of 16.55% to reach USD 35.05 Billion by 2032.
The OLED Display Market Size was valued at USD 44.07 Billion in 2023 and is expected to grow at a CAGR of 13.7% to reach USD 138.85 Billion by 2032.
The Non-Destructive Inspection Equipment Market was valued at USD 3.2 Billion in 2023 and is expected to reach USD 5.7 Billion by 2032, growing at a CAGR of 6.04% from 2024-2032.

Hi! Click one of our member below to chat on Phone
© 2025 All Rights Reserved by SNS Insider Pvt Ltd


