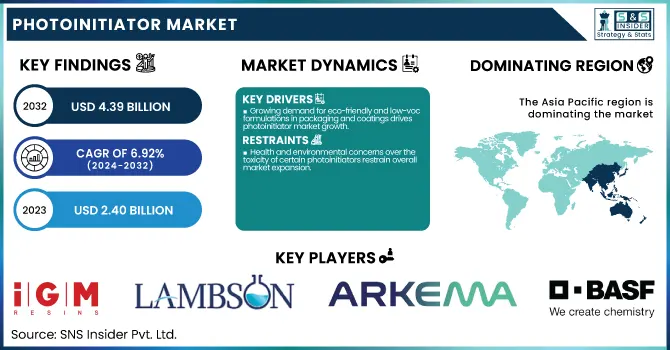
The Photoinitiator Market size was USD 2.40 billion in 2023 and is expected to reach USD 4.39 billion by 2032 and grow at a CAGR of 6.92% over the forecast period of 2024-2032.
To Get more information on Photoinitiator Market - Request Free Sample Report
The report offers an in-depth analysis of production capacity and utilization rates by country and photoinitiator type for 2023, highlighting global supply dynamics. It covers feedstock price trends by region, detailing cost fluctuations and their impact on market competitiveness. The report evaluates regulatory frameworks across key regions, assessing compliance challenges and their influence on product development. Environmental metrics, including emission levels and sustainable manufacturing practices, are analyzed to track industry alignment with global green mandates. R&D investments and innovation patterns by photoinitiator type are examined to understand emerging technologies and product enhancements. Additionally, adoption rates of photoinitiators in advanced curing applications across major regions are detailed, alongside key software and digital process integration trends.
The United States held the largest share in the Photoinitiator market in 2023, with a market size of USD 0.77 billion, projected to reach USD 1.45 billion by 2032, growing at a CAGR of 7.29% during 2024–2032. This is due to its well-established printing, packaging, and coating industries, which are major end-users of photoinitiators for UV-curable applications. Strong demand for advanced materials in sectors like automotive, electronics, and healthcare, where UV-curable coatings, adhesives, and inks are widely used, has further driven market growth. Additionally, the presence of key manufacturers, robust R&D infrastructure, and early adoption of innovative technologies such as 3D printing and high-performance inks have positioned the U.S. as a leading market. Regulatory support for low-VOC and eco-friendly materials has also accelerated the shift toward UV-curable solutions, boosting photoinitiator consumption across various applications.
Drivers
Growing demand for eco-friendly and low-voc formulations in packaging and coatings drives photoinitiator market growth.
The rising global emphasis on environmental sustainability and regulatory pressure to reduce volatile organic compounds (VOCs) have significantly accelerated the adoption of photoinitiators in eco-friendly applications. In packaging and industrial coatings, photoinitiators enable UV-curable technologies that emit minimal VOCs compared to conventional solvent-based systems. The U.S. Environmental Protection Agency (EPA) and European Union regulations such as REACH are pushing industries toward safer and greener alternatives. This shift has prompted manufacturers to adopt UV curing systems using photoinitiators that allow fast curing, reduced energy consumption, and improved environmental compliance. Industries such as electronics, automotive, and printing are transitioning to these sustainable solutions, further driving photoinitiator demand. The growing consumer preference for sustainable packaging and low-emission interior coatings is expected to strengthen this trend, positioning photoinitiators as a key enabler of green chemistry across industries.
Restrain
Health and environmental concerns over the toxicity of certain photoinitiators restrain overall market expansion.
Despite their advantages in energy efficiency and curing speed, some photoinitiators pose health and environmental risks, especially when used in food packaging or skin-contact materials. Certain benzophenone derivatives and amine-based photoinitiators have been linked to endocrine disruption, cytotoxicity, and environmental persistence. Regulatory agencies like the European Chemicals Agency (ECHA) and the U.S. Food and Drug Administration (FDA) have issued strict guidelines or outright bans on specific photoinitiator chemicals in sensitive applications. This creates compliance challenges for manufacturers, especially in sectors like medical devices and food-contact packaging, where safety standards are stringent. Additionally, consumer awareness and preference for non-toxic, “clean label” materials are prompting companies to reevaluate their photoinitiator formulations. These concerns limit the use of certain high-performance photoinitiators, potentially restraining the market’s growth unless safe and equally effective alternatives are developed.
Opportunity
Emerging applications in 3d printing and printed electronics present a significant growth opportunity for photoinitiators.
The rapid evolution of additive manufacturing and printed electronics has created new avenues for photoinitiator application, particularly in UV-curable resins and inks. In 3D printing, photoinitiators are essential for stereolithography (SLA) and digital light processing (DLP) techniques, enabling precise layer-by-layer curing of materials. The increasing use of 3D printing in prototyping, dental modeling, consumer products, and even bioprinting is significantly driving demand for high-reactivity, low-yellowing photoinitiators. Simultaneously, printed electronics such as flexible circuits, OLED displays, and RFID tags rely on UV-curable inks where photoinitiators ensure rapid curing and durability. As manufacturers across sectors invest in digital fabrication and smart manufacturing technologies, the demand for advanced photoinitiators tailored to these specialized uses is expected to rise. This emerging trend offers significant revenue potential for suppliers focused on innovation and customization.
Challenge
Technical limitations related to depth cure and oxygen inhibition challenge broader adoption of photoinitiator-based technologies.
While photoinitiators offer fast curing and low-energy processing, they face technical limitations that hinder their broader adoption in some complex applications. One major challenge is depth cure—UV light penetration is often insufficient in thick or pigmented coatings, leading to incomplete curing and reduced performance. Additionally, oxygen inhibition can affect free radical photoinitiators, where atmospheric oxygen quenches the reactive species and limits the surface cure, especially in outdoor applications. These technical shortcomings necessitate precise formulation adjustments, use of inert atmospheres, or incorporation of additional curing mechanisms, which add complexity and cost. Industries that require high film thickness, deep curing, or exposure to ambient conditions may hesitate to adopt photoinitiator-based systems unless these issues are effectively addressed. Consequently, overcoming these barriers is essential for maximizing the commercial potential of photoinitiator technologies across industrial and consumer applications.
By Type
Free Radical photoinitiators held the largest market share, around 69%, in 2023. It is due to their compatibility with a broad spectrum of monomers and oligomers that free proved to be versatile across many UV-curable applications. These kinds of photoinitiators are very commonly used in printing inks, adhesives, coatings (particularly for UV-cured coatings), and electronics, where efficient and fast polymerizations are required. Having the ability to trigger polymerization with lower energy UV light, plus a much quicker curing speed and cost efficiency, makes them the darling for large-scale industrial applications. Their output is also compatible with surface as well as thin-film applications, thus increasing the usability of Free Radical photoinitiators. Their dominance also stems from an ongoing need for high-performing and low-VOC formulations, especially in packaging and automotive coatings. Innovations on resin systems and curing technology have sustained continued growth on this category, in which Free Radical photoinitiators have the lion share of the photoinitiator market.
By End-Use Industry
Coating held the largest market share, around 42%, in 2023. They are widely used in various applications such as auto, electronics, wood, and industrial manufacturing. UV-curable coatings incorporate photoinitiators to facilitate rapid curing, increased surface hardness chemical resistance, and low VOC emissions and environmental impact. Globally, the demand for high-performance, long-lasting, and environmentally friendly coatings is high, especially in regions with stringent environmental regulations, such as North America and Europe. Furthermore, the growing consumption of UV-curable wood coatings in furniture & flooring and protective coatings in electronics & consumer goods are significantly influencing photoinitiators' consumption. These coatings not only provide efficiency in production processes by minimizing drying times, but they have also propelled the rise in popularity of coatings, making coatings the largest application segment of the photoinitiator market.
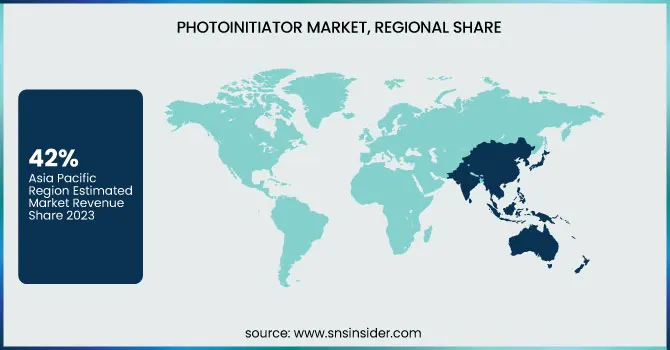
Asia Pacific held the largest market share, around 42%, in 2023. This is due to the booming industrial base in the region, specifically in the areas of China, India, South Korea, Japan. Growing packaging, electronics, automotive, and construction industries in these countries have generated substantial demand for various UV-curable coatings, inks, and adhesives as these respective applications are the most common users of photoinitiators. In addition, the low-cost availability of raw materials, favorable government policies to boost the manufacturing sector, and growing environmental concerns have propelled the trend toward UV curing technologies. The domination of production and consumption of photoinitiators are in China, as it is considered as a centre for electronics and printing industries. Furthermore, several local and international photoinitiator manufacturers and the ongoing investment in research and development, as well as sustainable technologies, further contribute to the regional photoinitiators market dominance.
North America held a significant market share. It is owing to the presence of well-established advanced manufacturing sector; automotive, aerospace, electronics and medical sectors to name a few, are the most common end-use industries where UV-curable technologies find applications. In industrial coatings, 3D printing and packaging, UV-curing systems have gained popularity during the last few decades thanks to their efficiency and low VOC emissions for the United States in specific followed by fast processing. Moreover, severe environmental laws established by various government agencies, including the U.S. Environmental Protection Agency (EPA) are further catalyzing the transition to more sustainable curing methods, thereby driving the demand for photoinitiators. With the strong market presence of few market players and investments in R&D and technological innovation of the UV-curable materials, North America continues to be a stronghold. In addition, increasing need for formulated & advanced coatings in healthcare and electronics is also fuelling the regional markets further.
Get Customized Report as per Your Business Requirement - Enquiry Now
IGM Resins (Omnirad 819, Esacure KTO46)
Lambson Ltd. (Genocure EPD, Genocure BMS)
Arkema S.A. (Sartomer Omnipol TX, Photomer 4967)
Tianjin Jiuri New Materials Co., Ltd. (TPO-L, 1173)
BASF SE (Irgacure 2959, Irgacure 819)
Double Bond Chemical Ind., Co., Ltd. (DBC UVI-6974, DBC TAIPINOL P36)
Tronly New Technology Co., Ltd. (Tronox TPO, Tronly ITX)
Rahn AG (Genomer 1122, Genocure TPO-L)
DBC (DBC HMPP, DBC BDK)
Eutec Chemical Co., Ltd. (Eutec TPO, Eutec 184)
Zhejiang Yangfan New Materials Co., Ltd. (YF-TPO, YF-184)
Polysciences, Inc. (Photoinitiator 2022, UV Initiator 1173)
Environ Speciality Chemicals (ESC Photoinitiator 651, ESC UV-Cure 184)
New Sun UV Chemical Co., Ltd. (NewSun TPO, NewSun 1173)
Kurogane Kasei Co., Ltd. (Kurogane ITX, Kurogane 184)
Covestro AG (Baycure 525, Baycure 401)
Qingdao Sunrun Chemical Industry Co., Ltd. (Sunrun 907, Sunrun DETX)
Changzhou Tronly New Electronic Materials Co., Ltd. (Tronly 1173, Tronly BDK)
Miwon Specialty Chemical Co., Ltd. (Miwon Omnipol TX, Miwon TPO-L)
Nagase ChemteX Corporation (Nagase Lucirin TPO, Nagase Darocur 1173)
In 2024, IGM Resins broadened its additives range with the launch of five new Omnivadd products and unveiled Esacure 563, a next-generation photoinitiator specifically developed for energy-curing applications.
In 2024, Arkema Sartomer doubled its UV/LED curing resin capacity with a facility expansion in Nansha, China, and introduced bio-based acrylates and reactive oligomers at RadTech 2024 to advance sustainable UV-curable solutions.
| Report Attributes | Details |
| Market Size in 2023 | USD 2.40 billion |
| Market Size by 2032 | USD 4.39 billion |
| CAGR | CAGR of6.92% From 2024 to 2032 |
| Base Year | 2023 |
| Forecast Period | 2024-2032 |
| Historical Data | 2020-2022 |
| Report Scope & Coverage | Market Size, Segments Analysis, Competitive Landscape, Regional Analysis, DROC & SWOT Analysis, Forecast Outlook |
| Key Segments | • By Type (Free Radical, Cationic) • By End-Use Industry (Adhesives, Ink, Coating, Others) |
| Regional Analysis/Coverage | North America (US, Canada, Mexico), Europe (Eastern Europe [Poland, Romania, Hungary, Turkey, Rest of Eastern Europe] Western Europe] Germany, France, UK, Italy, Spain, Netherlands, Switzerland, Austria, Rest of Western Europe]), Asia Pacific (China, India, Japan, South Korea, Vietnam, Singapore, Australia, Rest of Asia Pacific), Middle East & Africa (Middle East [UAE, Egypt, Saudi Arabia, Qatar, Rest of Middle East], Africa [Nigeria, South Africa, Rest of Africa], Latin America (Brazil, Argentina, Colombia, Rest of Latin America) |
| Company Profiles | IGM Resins, Lambson Ltd., Arkema S.A., Tianjin Jiuri New Materials Co., Ltd., BASF SE, Double Bond Chemical Ind., Co., Ltd., Tronly New Technology Co., Ltd., Rahn AG, DBC, Eutec Chemical Co., Ltd., Zhejiang Yangfan New Materials Co., Ltd., Polysciences, Inc., Environ Speciality Chemicals, New Sun UV Chemical Co., Ltd., Kurogane Kasei Co., Ltd., Covestro AG, Qingdao Sunrun Chemical Industry Co., Ltd., Changzhou Tronly New Electronic Materials Co., Ltd., Miwon Specialty Chemical Co., Ltd., Nagase ChemteX Corporation |
Ans: The Photoinitiator Market was valued at USD 2.40 billion in 2023.
Ans: The expected CAGR of the global Photoinitiator Market during the forecast period is 6.92%
Ans: Free Radical segment will grow rapidly in the Photoinitiator Market from 2024 to 2032
Ans: Growing demand for eco-friendly and low-voc formulations in packaging and coatings drives photoinitiator market growth.
Ans: Asia Pacific led the Photoinitiator Market in the region with the highest revenue share in 2023.
Table of Content
1. Introduction
1.1 Market Definition
1.2 Scope (Inclusion and Exclusions)
1.3 Research Assumptions
2. Executive Summary
2.1 Market Overview
2.2 Regional Synopsis
2.3 Competitive Summary
3. Research Methodology
3.1 Top-Down Approach
3.2 Bottom-up Approach
3.3. Data Validation
3.4 Primary Interviews
4. Market Dynamics Impact Analysis
4.1 Market Driving Factors Analysis
4.1.2 Drivers
4.1.2 Restraints
4.1.3 Opportunities
4.1.4 Challenges
4.2 PESTLE Analysis
4.3 Porter’s Five Forces Model
5. Statistical Insights and Trends Reporting
5.1 Production Capacity and Utilization by Country, By Type, 2023
5.2 Feedstock Prices by Country, and Type, 2023
5.3 Regulatory Impact by Country and By Type 2023.
5.4 Environmental Metrics: Emissions Data, Waste Management Practices, and Sustainability Initiatives by Region
5.5 Innovation and R&D, Type, 2023
6. Competitive Landscape
6.1 List of Major Companies By Region
6.2 Market Share Analysis By Region
6.3 Product Benchmarking
6.3.1 Product specifications and features
6.3.2 Pricing
6.4 Strategic Initiatives
6.4.1 Marketing and promotional activities
6.4.2 Distribution and Supply Chain Strategies
6.4.3 Expansion Plans and New Product Launches
6.4.4 Strategic partnerships and collaborations
6.5 Technological Advancements
6.6 Market Positioning and Branding
7. Photoinitiator Market Segmentation By Type
7.1 Chapter Overview
7.2 Free Radical
7.2.1 Free Radical Trend Analysis (2020-2032)
7.2.2 Free Radical Market Size Estimates and Forecasts to 2032 (USD Billion)
7.3 Cationic
7.3.1 Cationic Market Trends Analysis (2020-2032)
7.3.2 Cationic Market Size Estimates and Forecasts to 2032 (USD Billion)
8. Photoinitiator Market Segmentation By End-Use Industry
8.1 Chapter Overview
8.2 Adhesives
8.2.1 Adhesives Market Trends Analysis (2020-2032)
8.2.2 Adhesives Market Size Estimates and Forecasts to 2032 (USD Billion)
8.3 Ink
8.3.1 Ink Market Trends Analysis (2020-2032)
8.3.2 Ink Market Size Estimates and Forecasts to 2032 (USD Billion)
8.4 Coating
8.4.1 Coating Market Trends Analysis (2020-2032)
8.4.2 Coating Market Size Estimates and Forecasts to 2032 (USD Billion)
8.5 Others
8.5.1 Others Market Trends Analysis (2020-2032)
8.5.2 Others Market Size Estimates and Forecasts to 2032 (USD Billion)
9. Regional Analysis
9.1 Chapter Overview
9.2 North America
9.2.1 Trends Analysis
9.2.2 North America Photoinitiator Market Estimates and Forecasts, by Country (2020-2032) (USD Billion)
9.2.3 North America Photoinitiator Market Estimates and Forecasts, By Type (2020-2032) (USD Billion)
9.2.4 North America Photoinitiator Market Estimates and Forecasts, By End-Use Industry (2020-2032) (USD Billion)
9.2.5 USA
9.2.5.1 USA Photoinitiator Market Estimates and Forecasts, By Type (2020-2032) (USD Billion)
9.2.5.2 USA Photoinitiator Market Estimates and Forecasts, By End-Use Industry (2020-2032) (USD Billion)
9.2.6 Canada
9.2.6.1 Canada Photoinitiator Market Estimates and Forecasts, By Type (2020-2032) (USD Billion)
9.2.6.2 Canada Photoinitiator Market Estimates and Forecasts, By End-Use Industry (2020-2032) (USD Billion)
9.2.7 Mexico
9.2.7.1 Mexico Photoinitiator Market Estimates and Forecasts, By Type (2020-2032) (USD Billion)
9.2.7.2 Mexico Photoinitiator Market Estimates and Forecasts, By End-Use Industry (2020-2032) (USD Billion)
9.3 Europe
9.3.1 Eastern Europe
9.3.1.1 Trends Analysis
9.3.1.2 Eastern Europe Photoinitiator Market Estimates and Forecasts, by Country (2020-2032) (USD Billion)
9.3.1.3 Eastern Europe Photoinitiator Market Estimates and Forecasts, By Type (2020-2032) (USD Billion)
9.3.1.4 Eastern Europe Photoinitiator Market Estimates and Forecasts, By End-Use Industry (2020-2032) (USD Billion)
9.3.1.5 Poland
9.3.1.5.1 Poland Photoinitiator Market Estimates and Forecasts, By Type (2020-2032) (USD Billion)
9.3.1.5.2 Poland Photoinitiator Market Estimates and Forecasts, By End-Use Industry (2020-2032) (USD Billion)
9.3.1.6 Romania
9.3.1.6.1 Romania Photoinitiator Market Estimates and Forecasts, By Type (2020-2032) (USD Billion)
9.3.1.6.2 Romania Photoinitiator Market Estimates and Forecasts, By End-Use Industry (2020-2032) (USD Billion)
9.3.1.7 Hungary
9.3.1.7.1 Hungary Photoinitiator Market Estimates and Forecasts, By Type (2020-2032) (USD Billion)
9.3.1.7.2 Hungary Photoinitiator Market Estimates and Forecasts, By End-Use Industry (2020-2032) (USD Billion)
9.3.1.8 Turkey
9.3.1.8.1 Turkey Photoinitiator Market Estimates and Forecasts, By Type (2020-2032) (USD Billion)
9.3.1.8.2 Turkey Photoinitiator Market Estimates and Forecasts, By End-Use Industry (2020-2032) (USD Billion)
9.3.1.9 Rest of Eastern Europe
9.3.1.9.1 Rest of Eastern Europe Photoinitiator Market Estimates and Forecasts, By Type (2020-2032) (USD Billion)
9.3.1.9.2 Rest of Eastern Europe Photoinitiator Market Estimates and Forecasts, By End-Use Industry (2020-2032) (USD Billion)
9.3.2 Western Europe
9.3.2.1 Trends Analysis
9.3.2.2 Western Europe Photoinitiator Market Estimates and Forecasts, by Country (2020-2032) (USD Billion)
9.3.2.3 Western Europe Photoinitiator Market Estimates and Forecasts, By Type (2020-2032) (USD Billion)
9.3.2.4 Western Europe Photoinitiator Market Estimates and Forecasts, By End-Use Industry (2020-2032) (USD Billion)
9.3.2.5 Germany
9.3.2.5.1 Germany Photoinitiator Market Estimates and Forecasts, By Type (2020-2032) (USD Billion)
9.3.2.5.2 Germany Photoinitiator Market Estimates and Forecasts, By End-Use Industry (2020-2032) (USD Billion)
9.3.2.6 France
9.3.2.6.1 France Photoinitiator Market Estimates and Forecasts, By Type (2020-2032) (USD Billion)
9.3.2.6.2 France Photoinitiator Market Estimates and Forecasts, By End-Use Industry (2020-2032) (USD Billion)
9.3.2.7 UK
9.3.2.7.1 UK Photoinitiator Market Estimates and Forecasts, By Type (2020-2032) (USD Billion)
9.3.2.7.2 UK Photoinitiator Market Estimates and Forecasts, By End-Use Industry (2020-2032) (USD Billion)
9.3.2.8 Italy
9.3.2.8.1 Italy Photoinitiator Market Estimates and Forecasts, By Type (2020-2032) (USD Billion)
9.3.2.8.2 Italy Photoinitiator Market Estimates and Forecasts, By End-Use Industry (2020-2032) (USD Billion)
9.3.2.9 Spain
9.3.2.9.1 Spain Photoinitiator Market Estimates and Forecasts, By Type (2020-2032) (USD Billion)
9.3.2.9.2 Spain Photoinitiator Market Estimates and Forecasts, By End-Use Industry (2020-2032) (USD Billion)
9.3.2.10 Netherlands
9.3.2.10.1 Netherlands Photoinitiator Market Estimates and Forecasts, By Type (2020-2032) (USD Billion)
9.3.2.10.2 Netherlands Photoinitiator Market Estimates and Forecasts, By End-Use Industry (2020-2032) (USD Billion)
9.3.2.11 Switzerland
9.3.2.11.1 Switzerland Photoinitiator Market Estimates and Forecasts, By Type (2020-2032) (USD Billion)
9.3.2.11.2 Switzerland Photoinitiator Market Estimates and Forecasts, By End-Use Industry (2020-2032) (USD Billion)
9.3.2.12 Austria
9.3.2.12.1 Austria Photoinitiator Market Estimates and Forecasts, By Type (2020-2032) (USD Billion)
9.3.2.12.2 Austria Photoinitiator Market Estimates and Forecasts, By End-Use Industry (2020-2032) (USD Billion)
9.3.2.13 Rest of Western Europe
9.3.2.13.1 Rest of Western Europe Photoinitiator Market Estimates and Forecasts, By Type (2020-2032) (USD Billion)
9.3.2.13.2 Rest of Western Europe Photoinitiator Market Estimates and Forecasts, By End-Use Industry (2020-2032) (USD Billion)
9.4 Asia Pacific
9.4.1 Trends Analysis
9.4.2 Asia Pacific Photoinitiator Market Estimates and Forecasts, by Country (2020-2032) (USD Billion)
9.4.3 Asia Pacific Photoinitiator Market Estimates and Forecasts, By Type (2020-2032) (USD Billion)
9.4.4 Asia Pacific Photoinitiator Market Estimates and Forecasts, By End-Use Industry (2020-2032) (USD Billion)
9.4.5 China
9.4.5.1 China Photoinitiator Market Estimates and Forecasts, By Type (2020-2032) (USD Billion)
9.4.5.2 China Photoinitiator Market Estimates and Forecasts, By End-Use Industry (2020-2032) (USD Billion)
9.4.6 India
9.4.5.1 India Photoinitiator Market Estimates and Forecasts, By Type (2020-2032) (USD Billion)
9.4.5.2 India Photoinitiator Market Estimates and Forecasts, By End-Use Industry (2020-2032) (USD Billion)
9.4.5 Japan
9.4.5.1 Japan Photoinitiator Market Estimates and Forecasts, By Type (2020-2032) (USD Billion)
9.4.5.2 Japan Photoinitiator Market Estimates and Forecasts, By End-Use Industry (2020-2032) (USD Billion)
9.4.6 South Korea
9.4.6.1 South Korea Photoinitiator Market Estimates and Forecasts, By Type (2020-2032) (USD Billion)
9.4.6.2 South Korea Photoinitiator Market Estimates and Forecasts, By End-Use Industry (2020-2032) (USD Billion)
9.4.7 Vietnam
9.4.7.1 Vietnam Photoinitiator Market Estimates and Forecasts, By Type (2020-2032) (USD Billion)
9.2.7.2 Vietnam Photoinitiator Market Estimates and Forecasts, By End-Use Industry (2020-2032) (USD Billion)
9.4.8 Singapore
9.4.8.1 Singapore Photoinitiator Market Estimates and Forecasts, By Type (2020-2032) (USD Billion)
9.4.8.2 Singapore Photoinitiator Market Estimates and Forecasts, By End-Use Industry (2020-2032) (USD Billion)
9.4.9 Australia
9.4.9.1 Australia Photoinitiator Market Estimates and Forecasts, By Type (2020-2032) (USD Billion)
9.4.9.2 Australia Photoinitiator Market Estimates and Forecasts, By End-Use Industry (2020-2032) (USD Billion)
9.4.10 Rest of Asia Pacific
9.4.10.1 Rest of Asia Pacific Photoinitiator Market Estimates and Forecasts, By Type (2020-2032) (USD Billion)
9.4.10.2 Rest of Asia Pacific Photoinitiator Market Estimates and Forecasts, By End-Use Industry (2020-2032) (USD Billion)
9.5 Middle East and Africa
9.5.1 Middle East
9.5.1.1 Trends Analysis
9.5.1.2 Middle East Photoinitiator Market Estimates and Forecasts, by Country (2020-2032) (USD Billion)
9.5.1.3 Middle East Photoinitiator Market Estimates and Forecasts, By Type (2020-2032) (USD Billion)
9.5.1.4 Middle East Photoinitiator Market Estimates and Forecasts, By End-Use Industry (2020-2032) (USD Billion)
9.5.1.5 UAE
9.5.1.5.1 UAE Photoinitiator Market Estimates and Forecasts, By Type (2020-2032) (USD Billion)
9.5.1.5.2 UAE Photoinitiator Market Estimates and Forecasts, By End-Use Industry (2020-2032) (USD Billion)
9.5.1.6 Egypt
9.5.1.6.1 Egypt Photoinitiator Market Estimates and Forecasts, By Type (2020-2032) (USD Billion)
9.5.1.6.2 Egypt Photoinitiator Market Estimates and Forecasts, By End-Use Industry (2020-2032) (USD Billion)
9.5.1.7 Saudi Arabia
9.5.1.7.1 Saudi Arabia Photoinitiator Market Estimates and Forecasts, By Type (2020-2032) (USD Billion)
9.5.1.7.2 Saudi Arabia Photoinitiator Market Estimates and Forecasts, By End-Use Industry (2020-2032) (USD Billion)
9.5.1.8 Qatar
9.5.1.8.1 Qatar Photoinitiator Market Estimates and Forecasts, By Type (2020-2032) (USD Billion)
9.5.1.8.2 Qatar Photoinitiator Market Estimates and Forecasts, By End-Use Industry (2020-2032) (USD Billion)
9.5.1.9 Rest of Middle East
9.5.1.9.1 Rest of Middle East Photoinitiator Market Estimates and Forecasts, By Type (2020-2032) (USD Billion)
9.5.1.9.2 Rest of Middle East Photoinitiator Market Estimates and Forecasts, By End-Use Industry (2020-2032) (USD Billion)
9.5.2 Africa
9.5.2.1 Trends Analysis
9.5.2.2 Africa Photoinitiator Market Estimates and Forecasts, by Country (2020-2032) (USD Billion)
9.5.2.3 Africa Photoinitiator Market Estimates and Forecasts, By Type (2020-2032) (USD Billion)
9.5.2.4 Africa Photoinitiator Market Estimates and Forecasts, By End-Use Industry (2020-2032) (USD Billion)
9.5.2.5 South Africa
9.5.2.5.1 South Africa Photoinitiator Market Estimates and Forecasts, By Type (2020-2032) (USD Billion)
9.5.2.5.2 South Africa Photoinitiator Market Estimates and Forecasts, By End-Use Industry (2020-2032) (USD Billion)
9.5.2.6 Nigeria
9.5.2.6.1 Nigeria Photoinitiator Market Estimates and Forecasts, By Type (2020-2032) (USD Billion)
9.5.2.6.2 Nigeria Photoinitiator Market Estimates and Forecasts, By End-Use Industry (2020-2032) (USD Billion)
9.6 Latin America
9.6.1 Trends Analysis
9.6.2 Latin America Photoinitiator Market Estimates and Forecasts, by Country (2020-2032) (USD Billion)
9.6.3 Latin America Photoinitiator Market Estimates and Forecasts, By Type (2020-2032) (USD Billion)
9.6.4 Latin America Photoinitiator Market Estimates and Forecasts, By End-Use Industry (2020-2032) (USD Billion)
9.6.5 Brazil
9.6.5.1 Brazil Photoinitiator Market Estimates and Forecasts, By Type (2020-2032) (USD Billion)
9.6.5.2 Brazil Photoinitiator Market Estimates and Forecasts, By End-Use Industry (2020-2032) (USD Billion)
9.6.6 Argentina
9.6.6.1 Argentina Photoinitiator Market Estimates and Forecasts, By Type (2020-2032) (USD Billion)
9.6.6.2 Argentina Photoinitiator Market Estimates and Forecasts, By End-Use Industry (2020-2032) (USD Billion)
9.6.7 Colombia
9.6.7.1 Colombia Photoinitiator Market Estimates and Forecasts, By Type (2020-2032) (USD Billion)
9.6.7.2 Colombia Photoinitiator Market Estimates and Forecasts, By End-Use Industry (2020-2032) (USD Billion)
9.6.8 Rest of Latin America
9.6.8.1 Rest of Latin America Photoinitiator Market Estimates and Forecasts, By Type (2020-2032) (USD Billion)
9.6.8.2 Rest of Latin America Photoinitiator Market Estimates and Forecasts, By End-Use Industry (2020-2032) (USD Billion)
10. Company Profiles
10.1 IGM Resins
10.1.1 Company Overview
10.1.2 Financial
10.1.3 Product / Services Offered
10.1.4 SWOT Analysis
10.2 Lambson Ltd. BASF
10.2.1 Company Overview
10.2.2 Financial
10.2.3 Product/ Services Offered
10.2.4 SWOT Analysis
10.3 Arkema S.A.
10.3.1 Company Overview
10.3.2 Financial
10.3.3 Product/ Services Offered
10.3.4 SWOT Analysis
10.4 Tianjin Jiuri New Materials Co., Ltd.
10.4.1 Company Overview
10.4.2 Financial
10.4.3 Product/ Services Offered
10.4.4 SWOT Analysis
10.5 BASF SE
10.5.1 Company Overview
10.5.2 Financial
10.5.3 Product/ Services Offered
10.5.4 SWOT Analysis
10.6 Double Bond Chemical Ind., Co., Ltd.
10.6.1 Company Overview
10.6.2 Financial
10.6.3 Product/ Services Offered
10.6.4 SWOT Analysis
10.7 Tronly New Technology Co., Ltd.
10.7.1 Company Overview
10.7.2 Financial
10.7.3 Product/ Services Offered
10.7.4 SWOT Analysis
10.8 Rahn AG
10.8.1 Company Overview
10.8.2 Financial
10.8.3 Product/ Services Offered
10.8.4 SWOT Analysis
10.9 DBC
10.9.1 Company Overview
10.9.2 Financial
10.9.3 Product/ Services Offered
10.9.4 SWOT Analysis
10.10 Eutec Chemical Co., Ltd.
10.10.1 Company Overview
10.10.2 Financial
10.10.3 Product/ Services Offered
10.10.4 SWOT Analysis
11. Use Cases and Best Practices
12. Conclusion
An accurate research report requires proper strategizing as well as implementation. There are multiple factors involved in the completion of good and accurate research report and selecting the best methodology to compete the research is the toughest part. Since the research reports we provide play a crucial role in any company’s decision-making process, therefore we at SNS Insider always believe that we should choose the best method which gives us results closer to reality. This allows us to reach at a stage wherein we can provide our clients best and accurate investment to output ratio.
Each report that we prepare takes a timeframe of 350-400 business hours for production. Starting from the selection of titles through a couple of in-depth brain storming session to the final QC process before uploading our titles on our website we dedicate around 350 working hours. The titles are selected based on their current market cap and the foreseen CAGR and growth.
The 5 steps process:
Step 1: Secondary Research:
Secondary Research or Desk Research is as the name suggests is a research process wherein, we collect data through the readily available information. In this process we use various paid and unpaid databases which our team has access to and gather data through the same. This includes examining of listed companies’ annual reports, Journals, SEC filling etc. Apart from this our team has access to various associations across the globe across different industries. Lastly, we have exchange relationships with various university as well as individual libraries.

Step 2: Primary Research
When we talk about primary research, it is a type of study in which the researchers collect relevant data samples directly, rather than relying on previously collected data. This type of research is focused on gaining content specific facts that can be sued to solve specific problems. Since the collected data is fresh and first hand therefore it makes the study more accurate and genuine.
We at SNS Insider have divided Primary Research into 2 parts.
Part 1 wherein we interview the KOLs of major players as well as the upcoming ones across various geographic regions. This allows us to have their view over the market scenario and acts as an important tool to come closer to the accurate market numbers. As many as 45 paid and unpaid primary interviews are taken from both the demand and supply side of the industry to make sure we land at an accurate judgement and analysis of the market.
This step involves the triangulation of data wherein our team analyses the interview transcripts, online survey responses and observation of on filed participants. The below mentioned chart should give a better understanding of the part 1 of the primary interview.

Part 2: In this part of primary research the data collected via secondary research and the part 1 of the primary research is validated with the interviews from individual consultants and subject matter experts.
Consultants are those set of people who have at least 12 years of experience and expertise within the industry whereas Subject Matter Experts are those with at least 15 years of experience behind their back within the same space. The data with the help of two main processes i.e., FGDs (Focused Group Discussions) and IDs (Individual Discussions). This gives us a 3rd party nonbiased primary view of the market scenario making it a more dependable one while collation of the data pointers.
Step 3: Data Bank Validation
Once all the information is collected via primary and secondary sources, we run that information for data validation. At our intelligence centre our research heads track a lot of information related to the market which includes the quarterly reports, the daily stock prices, and other relevant information. Our data bank server gets updated every fortnight and that is how the information which we collected using our primary and secondary information is revalidated in real time.

Step 4: QA/QC Process
After all the data collection and validation our team does a final level of quality check and quality assurance to get rid of any unwanted or undesired mistakes. This might include but not limited to getting rid of the any typos, duplication of numbers or missing of any important information. The people involved in this process include technical content writers, research heads and graphics people. Once this process is completed the title gets uploader on our platform for our clients to read it.
Step 5: Final QC/QA Process:
This is the last process and comes when the client has ordered the study. In this process a final QA/QC is done before the study is emailed to the client. Since we believe in giving our clients a good experience of our research studies, therefore, to make sure that we do not lack at our end in any way humanly possible we do a final round of quality check and then dispatch the study to the client.
Key Segments
By Type
By End-Use Industry
Request for Segment Customization as per your Business Requirement: Segment Customization Request
Regional Coverage:
North America
Europe
Asia Pacific
Middle East & Africa
Latin America
Request for Country Level Research Report: Country Level Customization Request
Available Customization
With the given market data, SNS Insider offers customization as per the company’s specific needs. The following customization options are available for the report:
The Biochar Market size was valued at USD 536.8 Million in 2023 and is expected to reach USD 1764.1 Million by 2032 and grow at a CAGR of 14.1% over the forecast period of 2024-2032.
Water Treatment Chemicals Market was valued at USD 46.7 billion in 2023, and is expected to reach USD 94.2 billion by 2032, at a CAGR of 8.1% by 2024-2032.
The Polyols Market Size was valued at USD 34.39 Billion in 2023 and is expected to reach USD 57.55 Billion by 2032, growing at a CAGR of 5.89% from 2024-2032.
The Lignin Derivatives Market Size was USD 11.1 Billion in 2023 and is expected to reach USD 16.7 Billion by 2032 and grow at a CAGR of 4.7% by 2024-2032.
The Flue Gas Desulfurization System Market Size was USD 21.6 Billion in 2023 and will reach USD 34.1 Bn by 2032 and grow at a CAGR of 5.2% by 2024-2032.
The Atmospheric water generator Market size was USD 2.58 billion in 2023 and is expected to Reach USD 7.21 billion by 2032 and grow at a CAGR of 12.09% over the forecast period of 2024-2032.

Hi! Click one of our member below to chat on Phone
© 2025 All Rights Reserved by SNS Insider Pvt Ltd


