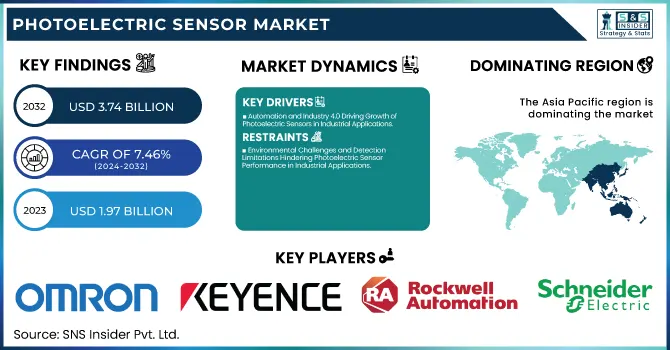
The Photoelectric Sensor Market Size was valued at USD 1.97 billion in 2023 and is expected to reach USD 3.74 billion by 2032, growing at a CAGR of 7.46% over the forecast period 2024-2032. Product innovations and technology upgrades are the key facilitators contributing to the growth of the global photoelectric sensor market. Manufacturers are launching compact, energy-efficient sensors with improved detection capabilities for a variety of industrial needs. IO-Link connectivity, smart diagnostics, and better sensing ranges are just some of the advanced features helping to improve the performance of the sensor.
To Get more information on Photoelectric Sensor Market - Request Free Sample Report
When we talk about application-driven metrics, we have sensors that are customized for individual object detection, positioning, and counting across sectors such as automotive, packaging, logistics, etc. Further adoption is fuelled by improved operational efficiency due to quicker response times, lesser maintenance requirements, and integration into automation systems making photoelectric sensors a vital component of industrial setups.
Key Drivers:
The shifting away from conventional ways of doing things is being driven by several factors, one of which is automation becoming normal in industrial spaces like manufacturing, automotive, and logistics. The demand for photoelectric sensors, which provide accurate object detection, positioning, and measurement, is increasing as industries aim to increase operational efficiency and channel their focus toward minimizing human intervention. Also, the increasing adoption of Industry 4.0 and smart factory implementations has propelled the demand for more advanced sensing technologies. Industrial safety regulations continue to undergo reforms, which is prompting the implementation of these sensors to avoid mishaps and maintain free logistics. Additionally, these sensors are used in conveyor systems, packaging lines, and material handling applications, and with the growing e-commerce and warehouse automation, the respective markets are driving the market growth at a significant pace.
Restrain:
Environmental Challenges and Detection Limitations Hindering Photoelectric Sensor Performance in Industrial Applications
One of the major challenges is that it can have performance limitations in difficult environments. Dust the previously mentioned dust particles, as well as smoke or just ambient light interference, affects the sensor lying in front of the camera negatively by increasing the noise level and causing mismatching between images. In some industries such as mining or construction, maintaining optimal sensor performance becomes an arduous task because they require specific designs and protective enclosures that ensure they are operating at their full utility. Moreover, another limitation of photoelectric sensors is their inability to detect transparent or very reflective objects, which can be a challenge in applications that demand accurate detection.
Opportunity:
Innovation and Smart Infrastructure Driving Growth Opportunities in the Photoelectric Sensor Market
There are several possibilities for growth in the photoelectric sensor market, due to the rising need for miniaturization and energy efficiency of sensors alongside facilitated detection performances as well. However, innovations like IO-Link connectivity and integrated microcontroller units (MCUs) are advances to improve sensor performance, allowing them to be monitored and analyzed without being physically present. Moreover, the increasing emphasis on smart city projects and infrastructure development has created a niche for photoelectric sensors in applications such as traffic monitoring, lighting control, and security systems. Given the widespread use of digital transformation among industries, the adoption of intelligent sensors is anticipated to rise, thereby propelling market growth.
Challenges:
Integration Challenges and Cybersecurity Risks Impacting Photoelectric Sensor Deployment in Industrial Systems
Sensor integration and such in automation systems is another big challenge. The ease of compatibility with industrial protocols, controllers, and IoT platforms is what makes IIoT hubs challenging because it requires certain technical know-how for some end-users to overcome. In addition, the need for constant calibration and maintenance for optimal performance has the possibility of causing downtime in operations. In tandem with the growing interest in smart, data-driven multi-dimensional systems, sensor networks have also become a target of cyberattacks when data of connected sensors can be breached. Meeting these technical and integration challenges is fundamental to the successful deployment of photoelectric sensors in a variety of industries.
By Technology
In 2023, retro-reflective sensors led the photoelectric sensor market share at 41.5%. Such dominance can be traced back to their availability, simplicity in installation, and good performance in a wide range of industries. Retro-reflective sensors are a popular type of sensor used in industries such as packaging, automotive, or material handling, where the sensor needs to detect objects with very little alignment. The ability to function efficiently in medium ranges is also heaped on with cost-effectiveness and bolsters its presence in a variety of market segments.
The fastest-growing segment is projected to be thru-beam sensors from 2024 to 2032. This trend is fuelled by lower costs, higher performance in difficult conditions, and the ability to operate in terms of longer range and better accuracy. Through-beam sensors are implemented across industries like manufacturing, logistics, and electronics where high-precision object detection and high reliability are required.
By Technology
The largest market of the photoelectric sensor market was automotive, accounting for 26.8% of the market in 2023. Such dominance is driven by the rise in automation across various automotive manufacturing processes such as assembly lines, robotic systems, and quality inspection. Photoelectric sensors support precision, safety, and efficiency in the production of vehicles detecting components, measuring distances, and recognizing defects.
Packaging is forecasted to be the fastest-growing segment within the projected time frame, from 2024 to 2032. This growth is primarily driven by the rising demand for automated packaging solutions across food & beverage, pharmaceuticals, and e-commerce industries. Photoelectric sensors have become critical to packaging systems – from label detection to product positioning to fill and seal verification, they make packaging operations more productive and in turn, more efficient and capable of maintaining quality control.
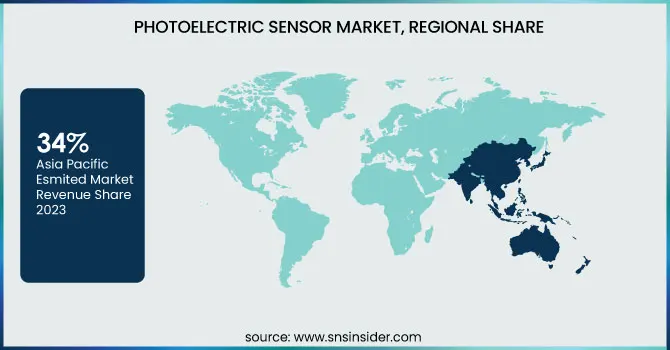
Asia Pacific with 34.8% of the total market share in photoelectric sensors in 2023 was the region with the most share while rapid industrialization and adoption of automation in manufacturing, electronics, and automotive among other sectors has been the driving factor. Leading nations such as China, Japan, and South Korea invest heavily in smart factories and Industry 4.0. Take Toyota for instance, it widely adopts photoelectric sensors in its automated production lines to make improvements in precision controls, quality controls, and operational efficiency. Also, the growing e-commerce industry in the region is encouraging the deployment of various sensors in warehouse automation systems for sorting, packing, and inventory management.
From 2024 to 2032, North America is expected to attain the highest CAGR, owing to the growing robotics sector, logistics automation, and smart infrastructure. Photoelectric sensors are used in fulfillment centers by companies such as Amazon to help sort products, detect bar codes, and monitor conveyor systems. Furthermore, the increasing use of automated healthcare equipment and safety systems around the world is driving market expansion since the usage of sensors helps increase the accuracy and safety of these applications.
Get Customized Report as per Your Business Requirement - Enquiry Now
Some of the major players in the Photoelectric Sensor Market are:
Omron Corporation (E3FA Series)
Keyence Corporation (PZ-G Series)
Sick AG (W12-3 Photoelectric Sensor)
Panasonic Corporation (EX-Z Series)
Rockwell Automation, Inc. (42EF Series)
Schneider Electric (XUY Series)
Banner Engineering Corp. (Q5X Series)
Pepperl+Fuchs (R2000 Detection Sensor)
IFM Electronic GmbH (O5D Series)
Balluff GmbH (BOS 18M Series)
Autonics Corporation (BJR-F Series)
Contrinex AG (C23 Series)
Baumer Group (OGP Series)
Leuze electronic GmbH + Co. KG (5 Series)
Wenglor Sensoric GmbH (P1KH Series)
In March 2025, RS and Banner Engineering partnered to enhance Industry 4.0 accessibility by offering advanced photoelectric and Q90R radar sensors, enabling improved automation and precision in industrial applications.
| Report Attributes | Details |
|---|---|
| Market Size in 2023 | USD 1.97 Billion |
| Market Size by 2032 | USD 3.74 Billion |
| CAGR | CAGR of 7.46% From 2024 to 2032 |
| Base Year | 2023 |
| Forecast Period | 2024-2032 |
| Historical Data | 2020-2022 |
| Report Scope & Coverage | Market Size, Segments Analysis, Competitive Landscape, Regional Analysis, DROC & SWOT Analysis, Forecast Outlook |
| Key Segments | • By Technology (Diffused, Retro-reflective, Thru-beam) • By End-use (Automotive, Military & Aerospace, Electronics & Semiconductor, Packaging, Others) |
| Regional Analysis/Coverage | North America (US, Canada, Mexico), Europe (Eastern Europe [Poland, Romania, Hungary, Turkey, Rest of Eastern Europe] Western Europe] Germany, France, UK, Italy, Spain, Netherlands, Switzerland, Austria, Rest of Western Europe]), Asia Pacific (China, India, Japan, South Korea, Vietnam, Singapore, Australia, Rest of Asia Pacific), Middle East & Africa (Middle East [UAE, Egypt, Saudi Arabia, Qatar, Rest of Middle East], Africa [Nigeria, South Africa, Rest of Africa], Latin America (Brazil, Argentina, Colombia, Rest of Latin America) |
| Company Profiles | Omron Corporation, Keyence Corporation, Sick AG, Panasonic Corporation, Rockwell Automation Inc., Schneider Electric, Banner Engineering Corp., Pepperl+Fuchs, IFM Electronic GmbH, Balluff GmbH, Autonics Corporation, Contrinex AG, Baumer Group, Leuze electronic GmbH + Co. KG, Wenglor Sensoric GmbH. |
What is the expected CAGR in the Photoelectric Sensor Market during 2024-2032?
Ans: Photoelectric Sensor Market size was USD 1.97 Billion in 2023 and is expected to Reach USD 3.74 Billion by 2032.
Ans: The major growth factor of the photoelectric sensor market is the increasing adoption of industrial automation and smart manufacturing technologies to enhance precision, efficiency, and safety.
Ans: The Retro-reflective segment dominated the Photoelectric Sensor market in 2023.
Ans: Asia Pacific dominated the Photoelectric Sensor Market in 2023.
1. Introduction
1.1 Market Definition
1.2 Scope (Inclusion and Exclusions)
1.3 Research Assumptions
2. Executive Summary
2.1 Market Overview
2.2 Regional Synopsis
2.3 Competitive Summary
3. Research Methodology
3.1 Top-Down Approach
3.2 Bottom-up Approach
3.3. Data Validation
3.4 Primary Interviews
4. Market Dynamics Impact Analysis
4.1 Market Driving Factors Analysis
4.1.1 Drivers
4.1.2 Restraints
4.1.3 Opportunities
4.1.4 Challenges
4.2 PESTLE Analysis
4.3 Porter’s Five Forces Model
5. Statistical Insights and Trends Reporting
5.1 Product & Innovation
5.2 Technological Advancement
5.3 Application-Driven Metrics
5.4 Operational Efficiency
6. Competitive Landscape
6.1 List of Major Companies, By Region
6.2 Market Share Analysis, By Region
6.3 Product Benchmarking
6.3.1 Product specifications and features
6.3.2 Pricing
6.4 Strategic Initiatives
6.4.1 Marketing and promotional activities
6.4.2 Distribution and Supply Chain Strategies
6.4.3 Expansion plans and new product launches
6.4.4 Strategic partnerships and collaborations
6.5 Technological Advancements
6.6 Market Positioning and Branding
7. Photoelectric Sensor Market Segmentation, By Technology
7.1 Chapter Overview
7.2 Diffused
7.2.1 Diffused Market Trends Analysis (2020-2032)
7.2.2 Diffused Market Size Estimates and Forecasts to 2032 (USD BILLION)
7.3 Retro-reflective
7.3.1 Retro-reflective Market Trends Analysis (2020-2032)
7.3.2 Retro-reflective Market Size Estimates and Forecasts to 2032 (USD BILLION)
7.4 Thru-beam
7.4.1 Thru-beam Market Trends Analysis (2020-2032)
7.4.2 Thru-beam Market Size Estimates and Forecasts to 2032 (USD BILLION)
8. Photoelectric Sensor Market Segmentation, By End-use
8.1 Chapter Overview
8.2 Automotive
8.2.1 Automotive Market Trends Analysis (2020-2032)
8.2.2 Automotive Market Size Estimates and Forecasts to 2032 (USD BILLION)
8.3 Military & Aerospace
8.3.1 Military & Aerospace Market Trends Analysis (2020-2032)
8.3.2 Military & Aerospace Market Size Estimates and Forecasts to 2032 (USD BILLION)
8.4 Electronics & Semiconductor
8.4.1 Electronics & Semiconductor Market Trends Analysis (2020-2032)
8.4.2 Electronics & Semiconductor Market Size Estimates and Forecasts to 2032 (USD BILLION)
8.5 Packaging
8.5.1 Packaging Market Trends Analysis (2020-2032)
8.5.2 Packaging Market Size Estimates and Forecasts to 2032 (USD BILLION)
8.6 Others
8.6.1 Others Market Trends Analysis (2020-2032)
8.6.2 Others Market Size Estimates and Forecasts to 2032 (USD BILLION)
9. Regional Analysis
9.1 Chapter Overview
9.2 North America
9.2.1 Trends Analysis
9.2.2 North America Photoelectric Sensor Market Estimates and Forecasts, by Country (2020-2032) (USD BILLION)
9.2.3 North America Photoelectric Sensor Market Estimates and Forecasts, By Technology (2020-2032) (USD BILLION)
9.2.4 North America Photoelectric Sensor Market Estimates and Forecasts, By End-use (2020-2032) (USD BILLION)
9.2.5 USA
9.2.5.1 USA Photoelectric Sensor Market Estimates and Forecasts, By Technology (2020-2032) (USD BILLION)
9.2.5.2 USA Photoelectric Sensor Market Estimates and Forecasts, By End-use (2020-2032) (USD BILLION)
9.2.6 Canada
9.2.6.1 Canada Photoelectric Sensor Market Estimates and Forecasts, By Technology (2020-2032) (USD BILLION)
9.2.6.2 Canada Photoelectric Sensor Market Estimates and Forecasts, By End-use (2020-2032) (USD BILLION)
9.2.7 Mexico
9.2.7.1 Mexico Photoelectric Sensor Market Estimates and Forecasts, By Technology (2020-2032) (USD BILLION)
9.2.7.2 Mexico Photoelectric Sensor Market Estimates and Forecasts, By End-use (2020-2032) (USD BILLION)
9.3 Europe
9.3.1 Eastern Europe
9.3.1.1 Trends Analysis
9.3.1.2 Eastern Europe Photoelectric Sensor Market Estimates and Forecasts, by Country (2020-2032) (USD BILLION)
9.3.1.3 Eastern Europe Photoelectric Sensor Market Estimates and Forecasts, By Technology (2020-2032) (USD BILLION)
9.3.1.4 Eastern Europe Photoelectric Sensor Market Estimates and Forecasts, By End-use (2020-2032) (USD BILLION)
9.3.1.5 Poland
9.3.1.5.1 Poland Photoelectric Sensor Market Estimates and Forecasts, By Technology (2020-2032) (USD BILLION)
9.3.1.5.2 Poland Photoelectric Sensor Market Estimates and Forecasts, By End-use (2020-2032) (USD BILLION)
9.3.1.6 Romania
9.3.1.6.1 Romania Photoelectric Sensor Market Estimates and Forecasts, By Technology (2020-2032) (USD BILLION)
9.3.1.6.2 Romania Photoelectric Sensor Market Estimates and Forecasts, By End-use (2020-2032) (USD BILLION)
9.3.1.7 Hungary
9.3.1.7.1 Hungary Photoelectric Sensor Market Estimates and Forecasts, By Technology (2020-2032) (USD BILLION)
9.3.1.7.2 Hungary Photoelectric Sensor Market Estimates and Forecasts, By End-use (2020-2032) (USD BILLION)
9.3.1.8 turkey
9.3.1.8.1 Turkey Photoelectric Sensor Market Estimates and Forecasts, By Technology (2020-2032) (USD BILLION)
9.3.1.8.2 Turkey Photoelectric Sensor Market Estimates and Forecasts, By End-use (2020-2032) (USD BILLION)
9.3.1.9 Rest of Eastern Europe
9.3.1.9.1 Rest of Eastern Europe Photoelectric Sensor Market Estimates and Forecasts, By Technology (2020-2032) (USD BILLION)
9.3.1.9.2 Rest of Eastern Europe Photoelectric Sensor Market Estimates and Forecasts, By End-use (2020-2032) (USD BILLION)
9.3.2 Western Europe
9.3.2.1 Trends Analysis
9.3.2.2 Western Europe Photoelectric Sensor Market Estimates and Forecasts, by Country (2020-2032) (USD BILLION)
9.3.2.3 Western Europe Photoelectric Sensor Market Estimates and Forecasts, By Technology (2020-2032) (USD BILLION)
9.3.2.4 Western Europe Photoelectric Sensor Market Estimates and Forecasts, By End-use (2020-2032) (USD BILLION)
9.3.2.5 Germany
9.3.2.5.1 Germany Photoelectric Sensor Market Estimates and Forecasts, By Technology (2020-2032) (USD BILLION)
9.3.2.5.2 Germany Photoelectric Sensor Market Estimates and Forecasts, By End-use (2020-2032) (USD BILLION)
9.3.2.6 France
9.3.2.6.1 France Photoelectric Sensor Market Estimates and Forecasts, By Technology (2020-2032) (USD BILLION)
9.3.2.6.2 France Photoelectric Sensor Market Estimates and Forecasts, By End-use (2020-2032) (USD BILLION)
9.3.2.7 UK
9.3.2.7.1 UK Photoelectric Sensor Market Estimates and Forecasts, By Technology (2020-2032) (USD BILLION)
9.3.2.7.2 UK Photoelectric Sensor Market Estimates and Forecasts, By End-use (2020-2032) (USD BILLION)
9.3.2.8 Italy
9.3.2.8.1 Italy Photoelectric Sensor Market Estimates and Forecasts, By Technology (2020-2032) (USD BILLION)
9.3.2.8.2 Italy Photoelectric Sensor Market Estimates and Forecasts, By End-use (2020-2032) (USD BILLION)
9.3.2.9 Spain
9.3.2.9.1 Spain Photoelectric Sensor Market Estimates and Forecasts, By Technology (2020-2032) (USD BILLION)
9.3.2.9.2 Spain Photoelectric Sensor Market Estimates and Forecasts, By End-use (2020-2032) (USD BILLION)
9.3.2.10 Netherlands
9.3.2.10.1 Netherlands Photoelectric Sensor Market Estimates and Forecasts, By Technology (2020-2032) (USD BILLION)
9.3.2.10.2 Netherlands Photoelectric Sensor Market Estimates and Forecasts, By End-use (2020-2032) (USD BILLION)
9.3.2.11 Switzerland
9.3.2.11.1 Switzerland Photoelectric Sensor Market Estimates and Forecasts, By Technology (2020-2032) (USD BILLION)
9.3.2.11.2 Switzerland Photoelectric Sensor Market Estimates and Forecasts, By End-use (2020-2032) (USD BILLION)
9.3.2.12 Austria
9.3.2.12.1 Austria Photoelectric Sensor Market Estimates and Forecasts, By Technology (2020-2032) (USD BILLION)
9.3.2.12.2 Austria Photoelectric Sensor Market Estimates and Forecasts, By End-use (2020-2032) (USD BILLION)
9.3.2.13 Rest of Western Europe
9.3.2.13.1 Rest of Western Europe Photoelectric Sensor Market Estimates and Forecasts, By Technology (2020-2032) (USD BILLION)
9.3.2.13.2 Rest of Western Europe Photoelectric Sensor Market Estimates and Forecasts, By End-use (2020-2032) (USD BILLION)
9.4 Asia Pacific
9.4.1 Trends Analysis
9.4.2 Asia Pacific Photoelectric Sensor Market Estimates and Forecasts, by Country (2020-2032) (USD BILLION)
9.4.3 Asia Pacific Photoelectric Sensor Market Estimates and Forecasts, By Technology (2020-2032) (USD BILLION)
9.4.4 Asia Pacific Photoelectric Sensor Market Estimates and Forecasts, By End-use (2020-2032) (USD BILLION)
9.4.5 China
9.4.5.1 China Photoelectric Sensor Market Estimates and Forecasts, By Technology (2020-2032) (USD BILLION)
9.4.5.2 China Photoelectric Sensor Market Estimates and Forecasts, By End-use (2020-2032) (USD BILLION)
9.4.6 India
9.4.5.1 India Photoelectric Sensor Market Estimates and Forecasts, By Technology (2020-2032) (USD BILLION)
9.4.5.2 India Photoelectric Sensor Market Estimates and Forecasts, By End-use (2020-2032) (USD BILLION)
9.4.5 Japan
9.4.5.1 Japan Photoelectric Sensor Market Estimates and Forecasts, By Technology (2020-2032) (USD BILLION)
9.4.5.2 Japan Photoelectric Sensor Market Estimates and Forecasts, By End-use (2020-2032) (USD BILLION)
9.4.6 South Korea
9.4.6.1 South Korea Photoelectric Sensor Market Estimates and Forecasts, By Technology (2020-2032) (USD BILLION)
9.4.6.2 South Korea Photoelectric Sensor Market Estimates and Forecasts, By End-use (2020-2032) (USD BILLION)
9.4.7 Vietnam
9.4.7.1 Vietnam Photoelectric Sensor Market Estimates and Forecasts, By Technology (2020-2032) (USD BILLION)
9.2.7.2 Vietnam Photoelectric Sensor Market Estimates and Forecasts, By End-use (2020-2032) (USD BILLION)
9.4.8 Singapore
9.4.8.1 Singapore Photoelectric Sensor Market Estimates and Forecasts, By Technology (2020-2032) (USD BILLION)
9.4.8.2 Singapore Photoelectric Sensor Market Estimates and Forecasts, By End-use (2020-2032) (USD BILLION)
9.4.9 Australia
9.4.9.1 Australia Photoelectric Sensor Market Estimates and Forecasts, By Technology (2020-2032) (USD BILLION)
9.4.9.2 Australia Photoelectric Sensor Market Estimates and Forecasts, By End-use (2020-2032) (USD BILLION)
9.4.10 Rest of Asia Pacific
9.4.10.1 Rest of Asia Pacific Photoelectric Sensor Market Estimates and Forecasts, By Technology (2020-2032) (USD BILLION)
9.4.10.2 Rest of Asia Pacific Photoelectric Sensor Market Estimates and Forecasts, By End-use (2020-2032) (USD BILLION)
9.5 Middle East and Africa
9.5.1 Middle East
9.5.1.1 Trends Analysis
9.5.1.2 Middle East Photoelectric Sensor Market Estimates and Forecasts, by Country (2020-2032) (USD BILLION)
9.5.1.3 Middle East Photoelectric Sensor Market Estimates and Forecasts, By Technology (2020-2032) (USD BILLION)
9.5.1.4 Middle East Photoelectric Sensor Market Estimates and Forecasts, By End-use (2020-2032) (USD BILLION)
9.5.1.5 UAE
9.5.1.5.1 UAE Photoelectric Sensor Market Estimates and Forecasts, By Technology (2020-2032) (USD BILLION)
9.5.1.5.2 UAE Photoelectric Sensor Market Estimates and Forecasts, By End-use (2020-2032) (USD BILLION)
9.5.1.6 Egypt
9.5.1.6.1 Egypt Photoelectric Sensor Market Estimates and Forecasts, By Technology (2020-2032) (USD BILLION)
9.5.1.6.2 Egypt Photoelectric Sensor Market Estimates and Forecasts, By End-use (2020-2032) (USD BILLION)
9.5.1.7 Saudi Arabia
9.5.1.7.1 Saudi Arabia Photoelectric Sensor Market Estimates and Forecasts, By Technology (2020-2032) (USD BILLION)
9.5.1.7.2 Saudi Arabia Photoelectric Sensor Market Estimates and Forecasts, By End-use (2020-2032) (USD BILLION)
9.5.1.8 Qatar
9.5.1.8.1 Qatar Photoelectric Sensor Market Estimates and Forecasts, By Technology (2020-2032) (USD BILLION)
9.5.1.8.2 Qatar Photoelectric Sensor Market Estimates and Forecasts, By End-use (2020-2032) (USD BILLION)
9.5.1.9 Rest of Middle East
9.5.1.9.1 Rest of Middle East Photoelectric Sensor Market Estimates and Forecasts, By Technology (2020-2032) (USD BILLION)
9.5.1.9.2 Rest of Middle East Photoelectric Sensor Market Estimates and Forecasts, By End-use (2020-2032) (USD BILLION)
9.5.2 Africa
9.5.2.1 Trends Analysis
9.5.2.2 Africa Photoelectric Sensor Market Estimates and Forecasts, by Country (2020-2032) (USD BILLION)
9.5.2.3 Africa Photoelectric Sensor Market Estimates and Forecasts, By Technology (2020-2032) (USD BILLION)
9.5.2.4 Africa Photoelectric Sensor Market Estimates and Forecasts, By End-use (2020-2032) (USD BILLION)
9.5.2.5 South Africa
9.5.2.5.1 South Africa Photoelectric Sensor Market Estimates and Forecasts, By Technology (2020-2032) (USD BILLION)
9.5.2.5.2 South Africa Photoelectric Sensor Market Estimates and Forecasts, By End-use (2020-2032) (USD BILLION)
9.5.2.6 Nigeria
9.5.2.6.1 Nigeria Photoelectric Sensor Market Estimates and Forecasts, By Technology (2020-2032) (USD BILLION)
9.5.2.6.2 Nigeria Photoelectric Sensor Market Estimates and Forecasts, By End-use (2020-2032) (USD BILLION)
9.5.2.7 Rest of Africa
9.5.2.7.1 Rest of Africa Photoelectric Sensor Market Estimates and Forecasts, By Technology (2020-2032) (USD BILLION)
9.5.2.7.2 Rest of Africa Photoelectric Sensor Market Estimates and Forecasts, By End-use (2020-2032) (USD BILLION)
9.6 Latin America
9.6.1 Trends Analysis
9.6.2 Latin America Photoelectric Sensor Market Estimates and Forecasts, by Country (2020-2032) (USD BILLION)
9.6.3 Latin America Photoelectric Sensor Market Estimates and Forecasts, By Technology (2020-2032) (USD BILLION)
9.6.4 Latin America Photoelectric Sensor Market Estimates and Forecasts, By End-use (2020-2032) (USD BILLION)
9.6.5 Brazil
9.6.5.1 Brazil Photoelectric Sensor Market Estimates and Forecasts, By Technology (2020-2032) (USD BILLION)
9.6.5.2 Brazil Photoelectric Sensor Market Estimates and Forecasts, By End-use (2020-2032) (USD BILLION)
9.6.6 Argentina
9.6.6.1 Argentina Photoelectric Sensor Market Estimates and Forecasts, By Technology (2020-2032) (USD BILLION)
9.6.6.2 Argentina Photoelectric Sensor Market Estimates and Forecasts, By End-use (2020-2032) (USD BILLION)
9.6.7 Colombia
9.6.7.1 Colombia Photoelectric Sensor Market Estimates and Forecasts, By Technology (2020-2032) (USD BILLION)
9.6.7.2 Colombia Photoelectric Sensor Market Estimates and Forecasts, By End-use (2020-2032) (USD BILLION)
9.6.8 Rest of Latin America
9.6.8.1 Rest of Latin America Photoelectric Sensor Market Estimates and Forecasts, By Technology (2020-2032) (USD BILLION)
9.6.8.2 Rest of Latin America Photoelectric Sensor Market Estimates and Forecasts, By End-use (2020-2032) (USD BILLION)
10. Company Profiles
10.1 Omron Corporation.
10.1.1 Company Overview
10.1.2 Financial
10.1.3 Products/ Services Offered
110.1.4 SWOT Analysis
10.2 Keyence Corporation
10.2.1 Company Overview
10.2.2 Financial
10.2.3 Products/ Services Offered
10.2.4 SWOT Analysis
10.3 Sick AG
10.3.1 Company Overview
10.3.2 Financial
10.3.3 Products/ Services Offered
10.3.4 SWOT Analysis
10.4 Panasonic Corporation
10.4.1 Company Overview
10.4.2 Financial
10.4.3 Products/ Services Offered
10.4.4 SWOT Analysis
10.5 Rockwell Automation, Inc
10.5.1 Company Overview
10.5.2 Financial
10.5.3 Products/ Services Offered
10.5.4 SWOT Analysis
10.6 Schneider Electric.
10.6.1 Company Overview
10.6.2 Financial
10.6.3 Products/ Services Offered
10.6.4 SWOT Analysis
10.7 Banner Engineering Corp.
10.7.1 Company Overview
10.7.2 Financial
10.7.3 Products/ Services Offered
10.7.4 SWOT Analysis
10.8 Pepperl+Fuchs
10.8.1 Company Overview
10.8.2 Financial
10.8.3 Products/ Services Offered
10.8.4 SWOT Analysis
10.9 IFM Electronic GmbH
10.9.1 Company Overview
10.9.2 Financial
10.9.3 Products/ Services Offered
10.9.4 SWOT Analysis
10.10 Balluff GmbH.
10.9.1 Company Overview
10.9.2 Financial
10.9.3 Products/ Services Offered
10.9.4 SWOT Analysis
11. Use Cases and Best Practices
12. Conclusion
An accurate research report requires proper strategizing as well as implementation. There are multiple factors involved in the completion of good and accurate research report and selecting the best methodology to compete the research is the toughest part. Since the research reports we provide play a crucial role in any company’s decision-making process, therefore we at SNS Insider always believe that we should choose the best method which gives us results closer to reality. This allows us to reach at a stage wherein we can provide our clients best and accurate investment to output ratio.
Each report that we prepare takes a timeframe of 350-400 business hours for production. Starting from the selection of titles through a couple of in-depth brain storming session to the final QC process before uploading our titles on our website we dedicate around 350 working hours. The titles are selected based on their current market cap and the foreseen CAGR and growth.
The 5 steps process:
Step 1: Secondary Research:
Secondary Research or Desk Research is as the name suggests is a research process wherein, we collect data through the readily available information. In this process we use various paid and unpaid databases which our team has access to and gather data through the same. This includes examining of listed companies’ annual reports, Journals, SEC filling etc. Apart from this our team has access to various associations across the globe across different industries. Lastly, we have exchange relationships with various university as well as individual libraries.

Step 2: Primary Research
When we talk about primary research, it is a type of study in which the researchers collect relevant data samples directly, rather than relying on previously collected data. This type of research is focused on gaining content specific facts that can be sued to solve specific problems. Since the collected data is fresh and first hand therefore it makes the study more accurate and genuine.
We at SNS Insider have divided Primary Research into 2 parts.
Part 1 wherein we interview the KOLs of major players as well as the upcoming ones across various geographic regions. This allows us to have their view over the market scenario and acts as an important tool to come closer to the accurate market numbers. As many as 45 paid and unpaid primary interviews are taken from both the demand and supply side of the industry to make sure we land at an accurate judgement and analysis of the market.
This step involves the triangulation of data wherein our team analyses the interview transcripts, online survey responses and observation of on filed participants. The below mentioned chart should give a better understanding of the part 1 of the primary interview.

Part 2: In this part of primary research the data collected via secondary research and the part 1 of the primary research is validated with the interviews from individual consultants and subject matter experts.
Consultants are those set of people who have at least 12 years of experience and expertise within the industry whereas Subject Matter Experts are those with at least 15 years of experience behind their back within the same space. The data with the help of two main processes i.e., FGDs (Focused Group Discussions) and IDs (Individual Discussions). This gives us a 3rd party nonbiased primary view of the market scenario making it a more dependable one while collation of the data pointers.
Step 3: Data Bank Validation
Once all the information is collected via primary and secondary sources, we run that information for data validation. At our intelligence centre our research heads track a lot of information related to the market which includes the quarterly reports, the daily stock prices, and other relevant information. Our data bank server gets updated every fortnight and that is how the information which we collected using our primary and secondary information is revalidated in real time.

Step 4: QA/QC Process
After all the data collection and validation our team does a final level of quality check and quality assurance to get rid of any unwanted or undesired mistakes. This might include but not limited to getting rid of the any typos, duplication of numbers or missing of any important information. The people involved in this process include technical content writers, research heads and graphics people. Once this process is completed the title gets uploader on our platform for our clients to read it.
Step 5: Final QC/QA Process:
This is the last process and comes when the client has ordered the study. In this process a final QA/QC is done before the study is emailed to the client. Since we believe in giving our clients a good experience of our research studies, therefore, to make sure that we do not lack at our end in any way humanly possible we do a final round of quality check and then dispatch the study to the client.
By Technology
Diffused
Retro-reflective
Thru-beam
By End-use
Automotive
Military & Aerospace
Electronics & Semiconductor
Packaging
Others
Request for Segment Customization as per your Business Requirement: Segment Customization Request
Regional Coverage:
North America
US
Canada
Mexico
Europe
Eastern Europe
Poland
Romania
Hungary
Turkey
Rest of Eastern Europe
Western Europe
Germany
France
UK
Italy
Spain
Netherlands
Switzerland
Austria
Rest of Western Europe
Asia Pacific
China
India
Japan
South Korea
Vietnam
Singapore
Australia
Rest of Asia Pacific
Middle East & Africa
Middle East
UAE
Egypt
Saudi Arabia
Qatar
Rest of Middle East
Africa
Nigeria
South Africa
Rest of Africa
Latin America
Brazil
Argentina
Colombia
Rest of Latin America
Request for Country Level Research Report: Country Level Customization Request
Available Customization
With the given market data, SNS Insider offers customization as per the company’s specific needs. The following customization options are available for the report:
Detailed Volume Analysis
Criss-Cross segment analysis (e.g. Product X Application)
Competitive Product Benchmarking
Geographic Analysis
Additional countries in any of the regions
Customized Data Representation
Detailed analysis and profiling of additional market players
The Automated Test Equipment Market size was valued at $7.39 Billion in 2023 & estimated to reach $10.68 Billion by 2032 at a CAGR of 4.21% during 2024-2032
The Photonics Market size was USD 910.70 billion in 2023 to USD 1642.58 billion by 2032 and grow at a CAGR of 6.83% over the forecast period of 2024-2032.
The Power Bank Market Size was valued at USD 15.22 Billion in 2023. It is estimated to reach USD 30.90 Billion by 2032, grow at 8.21% CAGR during 2024-2032.
The Automated Sortation System Market Size was valued at $4.00 Billion in 2023 and is expected to reach $5.68 Billion by 2032 at 3.99% CAGR, During 2024-2032
The Digital Inspection Market Size was valued at USD 24.49 Billion in 2023 and is expected to grow at a CAGR of 7.06% to reach USD 45.10 Billion by 2032.
The Refrigeration Monitoring Market Size was valued at USD 8.38 Billion in 2023 and is expected to grow at 7.84% CAGR to reach USD 16.46 Billion by 2032.

Hi! Click one of our member below to chat on Phone
© 2025 All Rights Reserved by SNS Insider Pvt Ltd


