Get More Information on Phenolic Resin Market - Request Sample Report
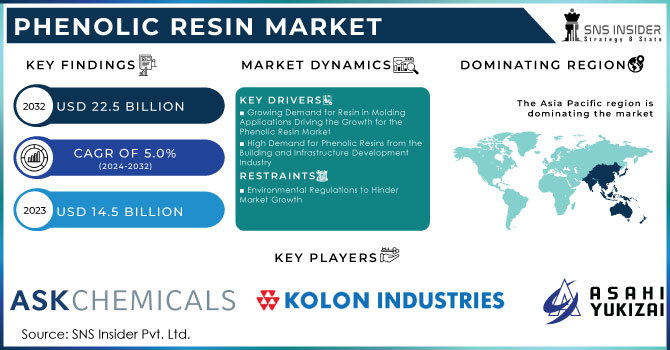
The Phenolic Resin Market was worth USD 14.5 billion in 2023 and is expected to grow to USD 22.5 billion by 2032, with a CAGR of 5.0% in the forecast period 2024-2032.
The Phenolic Resin Market is likely to witness significant consumption on account of its diversified use in various industries. Key factors include its high demand in the automobile sector, where phenolic resins are highly used in the manufacture of brake pads, clutch discs, and many other friction components that require resistance to heat. Key applications of the phenolic resins that are critical to helping their growth within the market include fire-resistant insulation foams and laminates used within the construction industry. Other applications proved very significant: the use of phenolic resins in the electronics sector includes circuit boards and other components, for which phenolic resins display excellent electrical insulation properties. Further to this, it was found that the Phenolic Resin market in the US was at a standstill in the second half of March as nothing considerable was altered in the market dynamics. The market was just drifting with prices falling as a result of weak consumer demand and ample material availability over previous weeks, but at last, it stabilized. Demand for phenolic resins has also improved from downstream markets, including the automotive and construction sectors, the government data showed. Commerce Department announced a 0.7% gain in investment in residential construction after a 0.1% rise in January. The overall market conditions were getting better, notwithstanding a 0.3% dip in the gauge of construction spending after an unrevised figure in January.
Such awareness of environmental regulations regarding sustainable materials has continued to drive the market, since these phenolic resins can be modified to meet green policies and thus ensure the durability and performance of products. Advancements in resin technology have generated low-emission and formaldehyde-free grades suitable for environmentally conscious end users and industries. The Asia-Pacific region is the largest phenolic resins market on account of rapid industrialization, particularly in China and India, which has led to an increased need for the resins in manufacturing as well as construction.
Current trends reveal how different key players have strategically collaborated and invested to expand production capacities for product portfolio enhancement. For example, collaborations between resin manufacturers and automotive OEMs to develop advanced friction materials illustrate ongoing market progress. Additionally, in April 2021, allnex announced a global price increase for all its phenolic resins due to substantial rises in raw material and logistics costs. Prices were set to increase by up to 15%, varying by grade and product family, with potential exceptions on a case-by-case basis. This increase was to apply to all shipments starting April 1, 2021, or as permitted by contracts. Such initiatives highlight the market's resilience and growth potential amid evolving industry demands and regulatory landscapes. As industries increasingly focus on performance, safety, and sustainability, phenolic resins are expected to play a crucial role in meeting these diverse requirements across various applications.
KEY DRIVERS:
Growing Demand for Resin in Molding Applications Driving the Growth for the Phenolic Resin Market
The growing demand for resin in molding is one of the major drivers boosting growth in the phenolic resin market. The resins are identified as having outstanding heat resistance, outstanding dimensional stability, as well as the best tough nature and are slowly becoming an indispensable part of molding applications in industry sectors around the globe. For instance, in the automotive sector, phenolic resins are used in huge amounts in the production of high-performance parts such as brake pads, clutch discs, and engine parts. These parts take advantage of the feature of the resin in withstanding heat and mechanical stresses, thereby achieving better security and performance of the vehicle. The construction sector has also witnessed an upsurge in the use of phenolic resins for molding high-temperature applications such as insulating foams, and laminates, among others, in the making of structural parts due to the fire-resistant feature and the structural integrity of the material. In the electronics field, phenolic resins are used to mold circuit boards and other electrical assemblies because they have high electrical insulation properties, increasing the reliability and lifespan of electronic devices. Subsequent developments in resin technology have led to the introduction of low-emission and formaldehyde-free phenolic resins so that all stringent environmental mandates can be met, making them attractive to ecology-sensitive manufacturers. With the increasing focus of industries toward performance, safety, and sustainability, the demand for phenolic resins is estimated to gear up in molding applications. The fast-growing demand for high-quality molding materials has driven markets the world over, with regional growth taking place, especially within the Asia-Pacific regions, which have fast industrialization and an increasing manufacturing sector in countries like China and India. These trends, coupled with continuous technological innovations projected to take place in the coming years and strategic partnerships between key market players, further suggest a robust growth trajectory for the phenolic resin market up to 2024, positioning it at the center of critical materials in molding applications across diverse industries.
High Demand for Phenolic Resins from the Building and Infrastructure Development Industry
High demand for phenolic resins from the construction industry has fueled the growth of the market, and applications within this industry deal with critical importance. Phenolic resins have applications in the development of insulation foams, critical to effective energy-efficient building design attributed to superior thermal insulating properties. In addition, these resins manufacture laminates and coatings to form barriers that are resistant to fires. Thus, they assure increases in terms of safety standards in most residential and commercial buildings. A good example is the use of phenolic resin-based laminates in durable fire-resistant wall panels, flooring, and countertops for modern construction. Demand has also expanded with the growing interest in sustainable building practices because phenolic resins can be formulated to meet environmental regulations without sacrificing performance. Innovatory products, like low-emission phenolic resins, are being increasingly sought for green building projects, in congruence with the green building initiative being pursued worldwide. The major impacts are from the construction boom in the fast-developing regions of the Asia-Pacific. The enormous rate of urbanization and infrastructure development in countries like China and India leads to substantial growth in the use of phenolic resins in construction materials. Besides, the demand for phenolic resins is further enriched by governments giving much emphasis on the infrastructure and housing sectors through various initiatives and investments. Phenolic resins continue to set the benchmark as the year 2024 approaches for this category of materials, providing structural integrity and inimitable attributes for guaranteed fire safety and even sustainability in construction applications. The increase in this mix is due to constant innovation and advancement in resin technology, making phenolic resins one of the cornerstones of modern construction practices. Those are supported by regulatory standards that oversee the overhauls faced by the construction industry.
RESTRAIN:
Environmental Regulations to Hinder Market Growth
Environmental regulatory considerations are also anticipated to act as a barrier to the growth trajectory in this particular market over the forecast period because guidelines are becoming increasingly strict on emissions and chemical use, likely impacting manufacturing processes and material formulations. Various governments across the globe are in the process of putting much more stringent regulations concerning volatile organic compounds and formaldehyde emissions—typical by-products in conventional phenolic resin manufacturing, respectively. For instance, the European Union's REACH regulation and equivalent standards in the United States require manufacturers to use low-emission and environmentally friendly phenolic resins, a development that can increase the cost and complexity of manufacturing. These types of regulatory pressures imply that companies would have to spend on research and development to make sustainable versions of the resin type—bio-based phenolic resins, free of formaldehyde—and can somewhat stymie the pace of expansion in the market. While the innovations are meant to become green, immediate growth might suffer a bit during the transition phase since some of the industries will need to acclimatize themselves to new standards and technologies. In the long term, there are likely to be gains from stable and resilient markets due to sustainable practices and compliance with environmental regulations.
By Type
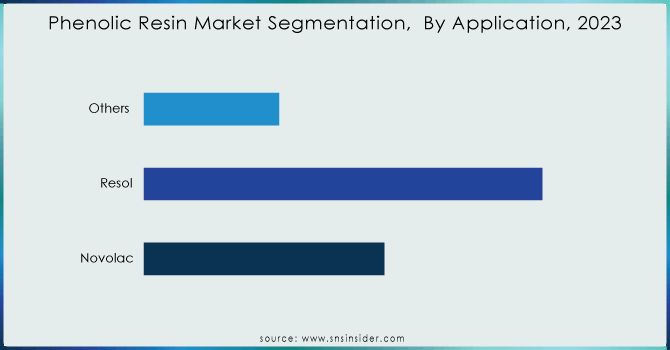
The novolac segment dominated the phenolic resin market and contributed the largest revenue share, at approximately 25.5% in 2023, and is prospective for significant growth during the forecast period. This material was experiencing increasing awareness of providing outstanding properties, being of lightweight composition with a very high level of thermal stability and improved heat resistance performance. Such unique features drive the interest of end-use industries like marine and construction in this material, thus surging its demand at an extremely high rate.
Need any customization research on Phenolic Resin Market - Enquiry Now
By Application
The molding segment dominated the market and held the largest share at over 24.8% in 2023. Phenolic resins suit well with molding techniques like compression molding and injection molding. The flexibility allows manufacturers to produce a wide variety of molded items for various sectors. The electrical insulation characteristics of phenol resins are well-accepted. Phenolic resins are favored in applications for excellent electrical insulation under molding for connections, switches, and insulators of electric parts. Growth in the phenolic molding segment is contributed very much by its application in the automotive industry. Molding with phenolic resins is used to drive many automobile components like brake components, engine parts, and interior automotive components. Phenolic resins are also used in other consumer products, like handles, knobs, and other parts.
By End Use Industry
In 2023, Automotive and transportation accounted for the largest market segment by revenue share of around 35%. The automotive and transportation end-user industry has a dominant share in the market due to the special properties of phenolic resins that are perfectly aligned with the dynamically changing needs of the automotive industry. Major strengths of phenolic resins include high thermal stability, optimal mechanical performance, and lightweight. The use of lightweight phenolic resins is high in demand with the growing importance of fuel efficiency and performance in the automotive industries. Automobiles developed using these lighter materials save on fuel consumption and reduce the effect of carbon, meeting the established objectives of a clean environment. These resins are also commonly used in industries as brake linings, clutch facings, and disc brake pads among many other different automobile components. They work toward enhancing the safety and performance of vital parts, supported by the fact of good resistance to pressure and heat, hence favoring its automotive market. Further, phenolic resins easily adapt to the whole process of molding and are flexible to the entire design, thus allowing the complexities of the automotive parts and enabling the car makers to innovate their designs to better and bigger vehicles.
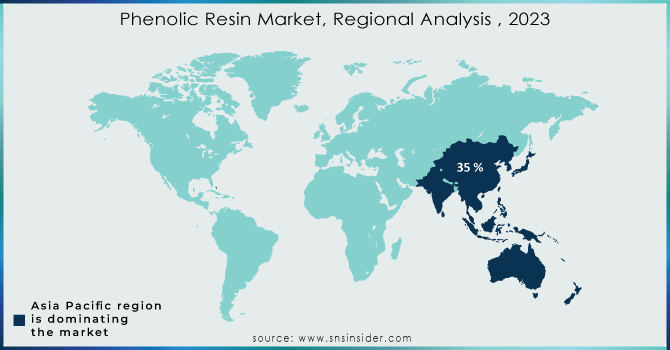
In 2023, Asia-Pacific held a market share of 35% of the Phenolic Resin Market because of rapidly increasing industrialization and high usage in several sectors. Countries like China and India lead this growth due to great manufacturing capabilities and growing construction activities. In the country of China, phenolic resins are of great use in the automotive sector, electronics, and construction due to very great thermal and mechanical capability. Large infrastructure projects, such as high-speed rail networks and urban expansion, put significant demand on phenolic resins in the construction industry for insulation and fireproof coatings. Because of the rapid industrialization and urbanization taking place in the country, India also consumes a considerable volume of phenolic resins in the automotive and electronic industries. Other countries underpinning the regional growth of phenolic resins in Southeast Asia are Vietnam and Indonesia—going further up the spectrum of new manufacturing hubs that are driving their growth via governmental industrial projects. The Asia-Pacific market remains the major player in the global phenolic resin business. Further technological advancement within the industry and major strategic investments from the key global manufacturers in expansion into production capacity have enhanced this market.
Moreover, North America is emerging as the fastest-growing region with a revenue share of about 29% in the Phenolic Resin Market, driven by strong demand from the automotive and construction sectors. Automotive would be the most important application area for the consumption of phenolic resins, which they find used in ensuring heat resistance and durability of components, like brake pads and clutch discs. As for these resins, they find application in providing insulating and laminating solutions that would pass the strict regulations for building safety from fires. In addition, developments in green resin formulations assist market growth. at the same time, investments made in manufacturing capacity on a strategic basis shall further add to its supply to meet the increased demand. that is also to say, the centrality of North America in driving increases in the phenolic resin market.
RECENT DEVELOPMENTS
January 2023: Hexion Inc. completed the acquisition of the phenolic resin business of Momentive Performance Materials, further strengthening its already leading position in global market presence.
January 2023: BASF SE expanded polymer dispersions capacity at its Merak, Indonesia site, to meet growing demand for high-quality packaging in ASEAN, and support local.
December 2022: ISCC PLUS certification was secured by Sumitomo Bakelite Europe NV for its phenolic resins, confirming its commitment to processing biobased and bio-circular materials in Europe.
November 2022: ASK Chemicals Group announced the acquisition of SI Group's industrial resins business was completed, which is expected to further strengthen its market position in the foundry segment and to provide the company with a footprint in phenolic industrial resins worldwide.
Kolon Industries Inc., Asahi Yukizai Corporation, Prefere Resins Holding GmbH, ASK Chemicals, Gunei Chemical Industry Co., Ltd, Kraton, Allnex GMBH, Seiko PMC Corporation, Bakelite Synthetics, Sumitomo Bakelite Co. Ltd.
Report Attributes | Details |
---|---|
Market Size in 2023 | US$ 14.5 Billion |
Market Size by 2032 | US$ 22.5 Billion |
CAGR | CAGR of 5.0% From 2024 to 2032 |
Base Year | 2022 |
Forecast Period | 2023-2032 |
Historical Data | 2020-2022 |
Report Scope & Coverage | Market Size, Segments Analysis, Competitive Landscape, Regional Analysis, DROC & SWOT Analysis, Forecast Outlook |
Key Segments | • By Type (Resol, Novolac [Liquid Resol Resin, Solid Resol Resin], Others) • By Application (Wood Adhesives, Laminates, Molding [Molding Compounds, Shell Molding], Foundry & Moldings, Paper Impregnation, Coatings, Insulations, Fiction, Abrasives, Composites, Carbon Binders, Tires & Rubber, Others) • By End Use Industry (Building & Construction, Furniture, Oil & Gas, Automotive & Transportation, Electrical & Electronics, Others) |
Regional Analysis/Coverage | North America (USA, Canada, Mexico), Europe (Germany, UK, France, Italy, Spain, Netherlands, Rest of Europe), Asia-Pacific (Japan, South Korea, China, India, Australia, Rest of Asia-Pacific), The Middle East & Africa (Israel, UAE, South Africa, Rest of Middle East & Africa), Latin America (Brazil, Argentina, Rest of Latin America) |
Company Profiles | Kolon Industries Inc., Asahi Yukizai Corporation, Prefere Resins Holding GmbH, ASK Chemicals, Gunei Chemical Industry Co., Ltd, Kraton, Allnex GMBH, Seiko PMC Corporation, Bakelite Synthetics, Sumitomo Bakelite Co. Ltd. |
Drivers |
• Growing Demand for Resin in Molding Applications Driving the Growth for the Phenolic Resin Market |
Restraints | • Environmental Regulations to Hinder Market Growth |
Ans: Manufacturers, Consultant, aftermarket players, association, Research institute, private and universities libraries, suppliers and distributors of the product.
Ans: Resol, Novolac and Others are the sub-segments of by type segment.
Ans: Key stakeholders considered in the study:
Raw material vendors
distributors/traders/wholesalers/suppliers
regulatory authorities, including government agencies and NGO
commercial research & development (r&d) institutions
importers and exporters
government organizations, research organizations, and consulting firms
trade/industrial associations
end-use industries are the stake holder of this report
Ans: Growing Demand for Resin in Molding Applications and High Demand for Phenolic Resins from the Building and Infrastructure Development Industry drive the Phenolic Resin Market.
Ans: Phenolic Resin Market Size was valued at USD 14.5 billion in 2023, and expected to reach USD 22.5 billion by 2032, and grow at a CAGR of 5.0% over the forecast period 2024-2032.
TABLE OF CONTENTS
1. Introduction
1.1 Market Definition
1.2 Scope
1.3 Research Assumptions
2. Industry Flowchart
3. Research Methodology
4. Market Dynamics
4.1 Drivers
4.2 Restraints
4.3 Opportunities
4.4 Challenges
5. Porter’s 5 Forces Model
6. Pest Analysis
7. Phenolic Resin Market Segmentation, By Type
7.1 Introduction
7.2 Novolac
7.3 Resol
7.3.1 Liquid Resol Resin
7.3.2 Solid Resol Resin
7.4 Others
8. Phenolic Resin Market Segmentation, By Application
8.1 Introduction
8.2 Wood Adhesives
8.3 Laminates
8.4 Molding
8.4.1 Molding Compounds
8.4.2 Shell Molding
8.5 Foundry & Moldings
8.6 Paper Impregnation
8.7 Coatings
8.8 Insulations
8.9 Fiction
8.10 Abrasives
8.11 Composites
8.12 Carbon Binders
8.13 Tires & Rubber
8.14 Others
9. Phenolic Resin Market Segmentation, By End Use Industry
9.1 Introduction
9.2 Building & Construction
9.3 Furniture
9.4 Oil & Gas
9.5 Automotive & Transportation
9.6 Electrical & Electronics
9.7 Others
10. Regional Analysis
10.1 Introduction
10.2 North America
10.2.1 Trend Analysis
10.2.2 North America Phenolic Resin Market by Country
10.2.3 North America Phenolic Resin Market By Type
10.2.4 North America Phenolic Resin Market By Application
10.2.5 North America Phenolic Resin Market By End use Industry
10.2.6 USA
10.2.6.1 USA Phenolic Resin Market By Type
10.2.6.2 USA Phenolic Resin Market By Application
10.2.6.3 USA Phenolic Resin Market By End use Industry
10.2.7 Canada
10.2.7.1 Canada Phenolic Resin Market By Type
10.2.7.2 Canada Phenolic Resin Market By Application
10.2.7.3 Canada Phenolic Resin Market By End use Industry
10.2.8 Mexico
10.2.8.1 Mexico Phenolic Resin Market By Type
10.2.8.2 Mexico Phenolic Resin Market By Application
10.2.8.3 Mexico Phenolic Resin Market By End use Industry
10.3 Europe
10.3.1 Trend Analysis
10.3.2 Eastern Europe
10.3.2.1 Eastern Europe Phenolic Resin Market by Country
10.3.2.2 Eastern Europe Phenolic Resin Market By Type
10.3.2.3 Eastern Europe Phenolic Resin Market By Application
10.3.2.4 Eastern Europe Phenolic Resin Market By End use Industry
10.3.2.5 Poland
10.3.2.5.1 Poland Phenolic Resin Market By Type
10.3.2.5.2 Poland Phenolic Resin Market By Application
10.3.2.5.3 Poland Phenolic Resin Market By End use Industry
10.3.2.6 Romania
10.3.2.6.1 Romania Phenolic Resin Market By Type
10.3.2.6.2 Romania Phenolic Resin Market By Application
10.3.2.6.4 Romania Phenolic Resin Market By End use Industry
10.3.2.7 Hungary
10.3.2.7.1 Hungary Phenolic Resin Market By Type
10.3.2.7.2 Hungary Phenolic Resin Market By Application
10.3.2.7.3 Hungary Phenolic Resin Market By End use Industry
10.3.2.8 Turkey
10.3.2.8.1 Turkey Phenolic Resin Market By Type
10.3.2.8.2 Turkey Phenolic Resin Market By Application
10.3.2.8.3 Turkey Phenolic Resin Market By End use Industry
10.3.2.9 Rest of Eastern Europe
10.3.2.9.1 Rest of Eastern Europe Phenolic Resin Market By Type
10.3.2.9.2 Rest of Eastern Europe Phenolic Resin Market By Application
10.3.2.9.3 Rest of Eastern Europe Phenolic Resin Market By End use Industry
10.3.3 Western Europe
10.3.3.1 Western Europe Phenolic Resin Market by Country
10.3.3.2 Western Europe Phenolic Resin Market By Type
10.3.3.3 Western Europe Phenolic Resin Market By Application
10.3.3.4 Western Europe Phenolic Resin Market By End use Industry
10.3.3.5 Germany
10.3.3.5.1 Germany Phenolic Resin Market By Type
10.3.3.5.2 Germany Phenolic Resin Market By Application
10.3.3.5.3 Germany Phenolic Resin Market By End use Industry
10.3.3.6 France
10.3.3.6.1 France Phenolic Resin Market By Type
10.3.3.6.2 France Phenolic Resin Market By Application
10.3.3.6.3 France Phenolic Resin Market By End use Industry
10.3.3.7 UK
10.3.3.7.1 UK Phenolic Resin Market By Type
10.3.3.7.2 UK Phenolic Resin Market By Application
10.3.3.7.3 UK Phenolic Resin Market By End use Industry
10.3.3.8 Italy
10.3.3.8.1 Italy Phenolic Resin Market By Type
10.3.3.8.2 Italy Phenolic Resin Market By Application
10.3.3.8.3 Italy Phenolic Resin Market By End use Industry
10.3.3.9 Spain
10.3.3.9.1 Spain Phenolic Resin Market By Type
10.3.3.9.2 Spain Phenolic Resin Market By Application
10.3.3.9.3 Spain Phenolic Resin Market By End use Industry
10.3.3.10 Netherlands
10.3.3.10.1 Netherlands Phenolic Resin Market By Type
10.3.3.10.2 Netherlands Phenolic Resin Market By Application
10.3.3.10.3 Netherlands Phenolic Resin Market By End use Industry
10.3.3.11 Switzerland
10.3.3.11.1 Switzerland Phenolic Resin Market By Type
10.3.3.11.2 Switzerland Phenolic Resin Market By Application
10.3.3.11.3 Switzerland Phenolic Resin Market By End use Industry
10.3.3.12 Austria
10.3.3.12.1 Austria Phenolic Resin Market By Type
10.3.3.12.2 Austria Phenolic Resin Market By Application
10.3.3.12.3 Austria Phenolic Resin Market By End use Industry
10.3.3.13 Rest of Western Europe
10.3.3.13.1 Rest of Western Europe Phenolic Resin Market By Type
10.3.3.13.2 Rest of Western Europe Phenolic Resin Market By Application
10.3.3.13.3 Rest of Western Europe Phenolic Resin Market By End use Industry
10.4 Asia-Pacific
10.4.1 Trend Analysis
10.4.2 Asia-Pacific Phenolic Resin Market by Country
10.4.3 Asia-Pacific Phenolic Resin Market By Type
10.4.4 Asia-Pacific Phenolic Resin Market By Application
10.4.5 Asia-Pacific Phenolic Resin Market By End use Industry
10.4.6 China
10.4.6.1 China Phenolic Resin Market By Type
10.4.6.2 China Phenolic Resin Market By Application
10.4.6.3 China Phenolic Resin Market By End use Industry
10.4.7 India
10.4.7.1 India Phenolic Resin Market By Type
10.4.7.2 India Phenolic Resin Market By Application
10.4.7.3 India Phenolic Resin Market By End use Industry
10.4.8 Japan
10.4.8.1 Japan Phenolic Resin Market By Type
10.4.8.2 Japan Phenolic Resin Market By Application
10.4.8.3 Japan Phenolic Resin Market By End use Industry
10.4.9 South Korea
10.4.9.1 South Korea Phenolic Resin Market By Type
10.4.9.2 South Korea Phenolic Resin Market By Application
10.4.9.3 South Korea Phenolic Resin Market By End use Industry
10.4.10 Vietnam
10.4.10.1 Vietnam Phenolic Resin Market By Type
10.4.10.2 Vietnam Phenolic Resin Market By Application
10.4.10.3 Vietnam Phenolic Resin Market By End use Industry
10.4.11 Singapore
10.4.11.1 Singapore Phenolic Resin Market By Type
10.4.11.2 Singapore Phenolic Resin Market By Application
10.4.11.3 Singapore Phenolic Resin Market By End use Industry
10.4.12 Australia
10.4.12.1 Australia Phenolic Resin Market By Type
10.4.12.2 Australia Phenolic Resin Market By Application
10.4.12.3 Australia Phenolic Resin Market By End use Industry
10.4.13 Rest of Asia-Pacific
10.4.13.1 Rest of Asia-Pacific Phenolic Resin Market By Type
10.4.13.2 Rest of Asia-Pacific Phenolic Resin Market By Application
10.4.13.3 Rest of Asia-Pacific Phenolic Resin Market By End use Industry
10.5 Middle East & Africa
10.5.1 Trend Analysis
10.5.2 Middle East
10.5.2.1 Middle East Phenolic Resin Market by Country
10.5.2.2 Middle East Phenolic Resin Market By Type
10.5.2.3 Middle East Phenolic Resin Market By Application
10.5.2.4 Middle East Phenolic Resin Market By End use Industry
10.5.2.5 UAE
10.5.2.5.1 UAE Phenolic Resin Market By Type
10.5.2.5.2 UAE Phenolic Resin Market By Application
10.5.2.5.3 UAE Phenolic Resin Market By End use Industry
10.5.2.6 Egypt
10.5.2.6.1 Egypt Phenolic Resin Market By Type
10.5.2.6.2 Egypt Phenolic Resin Market By Application
10.5.2.6.3 Egypt Phenolic Resin Market By End use Industry
10.5.2.7 Saudi Arabia
10.5.2.7.1 Saudi Arabia Phenolic Resin Market By Type
10.5.2.7.2 Saudi Arabia Phenolic Resin Market By Application
10.5.2.7.3 Saudi Arabia Phenolic Resin Market By End use Industry
10.5.2.8 Qatar
10.5.2.8.1 Qatar Phenolic Resin Market By Type
10.5.2.8.2 Qatar Phenolic Resin Market By Application
10.5.2.8.3 Qatar Phenolic Resin Market By End use Industry
10.5.2.9 Rest of Middle East
10.5.2.9.1 Rest of Middle East Phenolic Resin Market By Type
10.5.2.9.2 Rest of Middle East Phenolic Resin Market By Application
10.5.2.9.3 Rest of Middle East Phenolic Resin Market By End use Industry
10.5.3 Africa
10.5.3.1 Africa Phenolic Resin Market by Country
10.5.3.2 Africa Phenolic Resin Market By Type
10.5.3.3 Africa Phenolic Resin Market By Application
10.5.3.4 Africa Phenolic Resin Market By End use Industry
10.5.3.5 Nigeria
10.5.3.5.1 Nigeria Phenolic Resin Market By Type
10.5.3.5.2 Nigeria Phenolic Resin Market By Application
10.5.3.5.3 Nigeria Phenolic Resin Market By End use Industry
10.5.3.6 South Africa
10.5.3.6.1 South Africa Phenolic Resin Market By Type
10.5.3.6.2 South Africa Phenolic Resin Market By Application
10.5.3.6.3 South Africa Phenolic Resin Market By End use Industry
10.5.3.7 Rest of Africa
10.5.3.7.1 Rest of Africa Phenolic Resin Market By Type
10.5.3.7.2 Rest of Africa Phenolic Resin Market By Application
10.5.3.7.3 Rest of Africa Phenolic Resin Market By End use Industry
10.6 Latin America
10.6.1 Trend Analysis
10.6.2 Latin America Phenolic Resin Market by country
10.6.3 Latin America Phenolic Resin Market By Type
10.6.4 Latin America Phenolic Resin Market By Application
10.6.5 Latin America Phenolic Resin Market By End use Industry
10.6.6 Brazil
10.6.6.1 Brazil Phenolic Resin Market By Type
10.6.6.2 Brazil Phenolic Resin Market By Application
10.6.6.3 Brazil Phenolic Resin Market By End use Industry
10.6.7 Argentina
10.6.7.1 Argentina Phenolic Resin Market By Type
10.6.7.2 Argentina Phenolic Resin Market By Application
10.6.7.3 Argentina Phenolic Resin Market By End use Industry
10.6.8 Colombia
10.6.8.1 Colombia Phenolic Resin Market By Type
10.6.8.2 Colombia Phenolic Resin Market By Application
10.6.8.3 Colombia Phenolic Resin Market By End use Industry
10.6.9 Rest of Latin America
10.6.9.1 Rest of Latin America Phenolic Resin Market By Type
10.6.9.2 Rest of Latin America Phenolic Resin Market By Application
10.6.9.3 Rest of Latin America Phenolic Resin Market By End use Industry
11. Company Profiles
11.1 Kolon Industries Inc.
11.1.1 Company Overview
11.1.2 Financial
11.1.3 Products/ Services Offered
11.1.4 The SNS View
11.2 Asahi Yukizai Corporation
11.2.1 Company Overview
11.2.2 Financial
11.2.3 Products/ Services Offered
11.2.4 The SNS View
11.3 Prefere Resins Holding GmbH
11.3.1 Company Overview
11.3.2 Financial
11.3.3 Products/ Services Offered
11.3.4 The SNS View
11.4 ASK Chemicals
11.4.1 Company Overview
11.4.2 Financial
11.4.3 Products/ Services Offered
11.4.4 The SNS View
11.5 Gunei Chemical Industry Co., Ltd
11.5.1 Company Overview
11.5.2 Financial
11.5.3 Products/ Services Offered
11.5.4 The SNS View
11.6 Kraton
11.6.1 Company Overview
11.6.2 Financial
11.6.3 Products/ Services Offered
11.6.4 The SNS View
11.7 Allnex GMBH
11.7.1 Company Overview
11.7.2 Financial
11.7.3 Products/ Services Offered
11.7.4 The SNS View
11.8 Seiko PMC Corporation
11.8.1 Company Overview
11.8.2 Financial
11.8.3 Products/ Services Offered
11.8.4 The SNS View
11.9 Bakelite Synthetics
11.9.1 Company Overview
11.9.2 Financial
11.9.3 Products/ Services Offered
11.9.4 The SNS View
11.10 Sumitomo Bakelite Co. Ltd.
11.10.1 Company Overview
11.10.2 Financial
11.10.3 Products/ Services Offered
11.10.4 The SNS View
12. Competitive Landscape
12.1 Competitive Benchmarking
12.2 Market Share Analysis
12.3 Recent Developments
12.3.1 Industry News
12.3.2 Company News
12.3.3 Mergers & Acquisitions
13. Use Case and Best Practices
14. Conclusion
An accurate research report requires proper strategizing as well as implementation. There are multiple factors involved in the completion of good and accurate research report and selecting the best methodology to compete the research is the toughest part. Since the research reports we provide play a crucial role in any company’s decision-making process, therefore we at SNS Insider always believe that we should choose the best method which gives us results closer to reality. This allows us to reach at a stage wherein we can provide our clients best and accurate investment to output ratio.
Each report that we prepare takes a timeframe of 350-400 business hours for production. Starting from the selection of titles through a couple of in-depth brain storming session to the final QC process before uploading our titles on our website we dedicate around 350 working hours. The titles are selected based on their current market cap and the foreseen CAGR and growth.
The 5 steps process:
Step 1: Secondary Research:
Secondary Research or Desk Research is as the name suggests is a research process wherein, we collect data through the readily available information. In this process we use various paid and unpaid databases which our team has access to and gather data through the same. This includes examining of listed companies’ annual reports, Journals, SEC filling etc. Apart from this our team has access to various associations across the globe across different industries. Lastly, we have exchange relationships with various university as well as individual libraries.
Step 2: Primary Research
When we talk about primary research, it is a type of study in which the researchers collect relevant data samples directly, rather than relying on previously collected data. This type of research is focused on gaining content specific facts that can be sued to solve specific problems. Since the collected data is fresh and first hand therefore it makes the study more accurate and genuine.
We at SNS Insider have divided Primary Research into 2 parts.
Part 1 wherein we interview the KOLs of major players as well as the upcoming ones across various geographic regions. This allows us to have their view over the market scenario and acts as an important tool to come closer to the accurate market numbers. As many as 45 paid and unpaid primary interviews are taken from both the demand and supply side of the industry to make sure we land at an accurate judgement and analysis of the market.
This step involves the triangulation of data wherein our team analyses the interview transcripts, online survey responses and observation of on filed participants. The below mentioned chart should give a better understanding of the part 1 of the primary interview.
Part 2: In this part of primary research the data collected via secondary research and the part 1 of the primary research is validated with the interviews from individual consultants and subject matter experts.
Consultants are those set of people who have at least 12 years of experience and expertise within the industry whereas Subject Matter Experts are those with at least 15 years of experience behind their back within the same space. The data with the help of two main processes i.e., FGDs (Focused Group Discussions) and IDs (Individual Discussions). This gives us a 3rd party nonbiased primary view of the market scenario making it a more dependable one while collation of the data pointers.
Step 3: Data Bank Validation
Once all the information is collected via primary and secondary sources, we run that information for data validation. At our intelligence centre our research heads track a lot of information related to the market which includes the quarterly reports, the daily stock prices, and other relevant information. Our data bank server gets updated every fortnight and that is how the information which we collected using our primary and secondary information is revalidated in real time.
Step 4: QA/QC Process
After all the data collection and validation our team does a final level of quality check and quality assurance to get rid of any unwanted or undesired mistakes. This might include but not limited to getting rid of the any typos, duplication of numbers or missing of any important information. The people involved in this process include technical content writers, research heads and graphics people. Once this process is completed the title gets uploader on our platform for our clients to read it.
Step 5: Final QC/QA Process:
This is the last process and comes when the client has ordered the study. In this process a final QA/QC is done before the study is emailed to the client. Since we believe in giving our clients a good experience of our research studies, therefore, to make sure that we do not lack at our end in any way humanly possible we do a final round of quality check and then dispatch the study to the client.
Key Segments:
By Type
Novolac
Resol
Liquid Resol Resin
Solid Resol Resin
Others
By Application
Wood Adhesives
Laminates
Molding
Molding Compounds
Shell Molding
Foundry & Moldings
Paper Impregnation
Coatings
Insulations
Fiction
Abrasives
Composites
Carbon Binders
Tires & Rubber
Others
By End Use Industry
Building & Construction
Furniture
Oil & Gas
Automotive & Transportation
Electrical & Electronics
Others
Request for Segment Customization as per your Business Requirement: Segment Customization Request
Regional Coverage:
Regional Coverage
North America
US
Canada
Mexico
Europe
Eastern Europe
Poland
Romania
Hungary
Turkey
Rest of Eastern Europe
Western Europe
Germany
France
UK
Italy
Spain
Netherlands
Switzerland
Austria
Rest of Western Europe
Asia Pacific
China
India
Japan
South Korea
Vietnam
Singapore
Australia
Rest of Asia Pacific
Middle East & Africa
Middle East
UAE
Egypt
Saudi Arabia
Qatar
Rest of Middle East
Africa
Nigeria
South Africa
Rest of Africa
Latin America
Brazil
Argentina
Colombia
Rest of Latin America
Request for Country Level Research Report: Country Level Customization Request
Available Customization
With the given market data, SNS Insider offers customization as per the company’s specific needs. The following customization options are available for the report:
Product Analysis
Criss-Cross segment analysis (e.g. Product X Application)
Product Matrix which gives a detailed comparison of product portfolio of each company
Geographic Analysis
Additional countries in any of the regions
Company Information
Detailed analysis and profiling of additional market players (Up to five)
The Polyethylene Glycol Market Size was valued at USD 5.0 billion in 2023, and is expected to reach USD 8.4 billion by 2032, and grow at a CAGR of 6.0% over the forecast period 2024-2032.
The Hybrid Sealants and Adhesives Market Size was valued at USD 8.10 billion in 2023 and is expected to reach USD 15.81 billion by 2032 and grow at a CAGR of 8.86% over the forecast period 2024-2032.
Calcium Carbonate Market size was USD 45.6 billion in 2023 and is expected to reach USD 79.8 billion by 2032 and grow at a CAGR of 6.4% from 2024 to 2032.
Surface Disinfectant Market was valued at USD 5.4 billion in 2023 and is expected to reach USD 10.3 billion by 2032, growing at a CAGR of 7.5% from 2024-2032.
The Butyric Acid Market size was valued at USD 290.4 Million in 2023 and will reach to USD 715.6 Million by 2032 and grow at a CAGR of 10.6% by 2024-2032.
The Aluminum Nitride Market was Valued at USD 150.250 Million in 2023 and is now anticipated to grow to USD 245.58 Million by 2032, displaying a compound annual growth rate (CAGR) 4.98% of during the forecast Period 2024 - 2032.
Hi! Click one of our member below to chat on Phone