Get More Information on Phase-transfer Catalyst Market - Request Sample Report
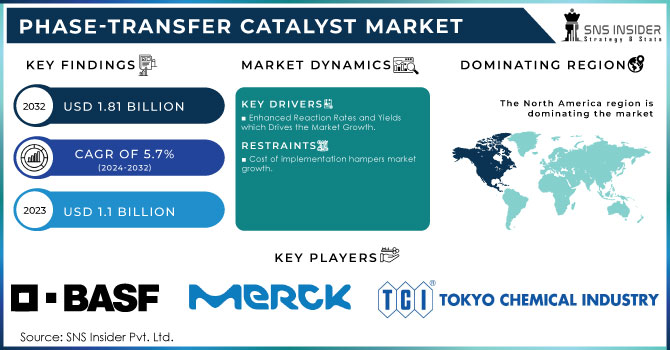
The Phase-transfer Catalyst Market size was valued at USD 1.1 Billion in 2023. It is expected to grow to USD 1.81 Billion by 2032 and grow at a CAGR of 5.7% over the forecast period of 2024-2032.
Phase-transfer catalysts are chemical compounds used in facilitating reactions between different phases of the reactants such as solid-liquid, liquid-liquid and gas-liquid systems. In this regard PTCs work by enhancing mass transfer of the reactants across phase boundaries. Indeed, this capacity to significantly increase the rate and yield of reactions helps industries reduce costs while optimizing efficiency in the production of several products, through processes that would be otherwise slow or impossible. Apparently, they become of high importance, and one of the key components of different industries such as chemicals, pharmaceuticals, polymers, agrochemicals, foods, and cosmetics.
The agrochemical sector serves a pivotal role in the expansion of the phase-transfer catalysts market. Phase-transfer catalysts are essential for increasing the synthesis of several agricultural chemicals, which include herbicides, insecticides, and fungicides. Generally, PTCs serve as a bridge between immiscible phases to facilitate chemical reaction by increasing the reactivity between water-soluble and oil-solubility reactants. This becomes essential in agrochemical synthesis given many active ingredients are either hydrophilic or lipophilic and direct reactions ultimately end up being inefficient. In light of the demand to produce agricultural produce sustainably in light of growing population worldwide, agrochemicals have become a desired demand
According to the U.S. Environmental Protection Agency (EPA), the adoption of organic chemistry practices, which includes the use of safer chemicals like sodium hydroxide in place of hazardous alternatives, can result in cost savings of up to 20-30% in chemical manufacturing due to reduced handling and disposal costs, as well as improved worker safety.
Industries are increasingly using phase-transfer catalysts, as they comply with the best practices of green chemistry. These catalysts make it possible for chemical reactions to proceed under milder conditions and with fewer or no hazardous solvents, which are potentially dangerous for human health and the environment.
The phase-transfer catalyst helps to reduce the toxicity of reactions between fewer reactants and thus consume less energy. Currently, this step is timely, as environmental and safety organizations of different countries, like the Environmental Protection Agency in the US, the European Chemicals Agency, and any others, enforce the use of organic processes with no waste and artefacts. These agencies genuinely attempt to reduce the ecological footprint of human activities and improve workplace safety.
In 2022, Nippon Chemical unveiled a customized phase-transfer catalyst for the polymer industry that reduces the need for hazardous solvents and enhances reaction conditions to minimize energy usage. This innovation helps manufacturers meet environmental and safety standards set by regulatory bodies worldwide.
Drivers
Enhanced Reaction Rates and Yields which Drives the Market Growth.
Phase transfer catalysts considerably increase the velocity of reactions. This speed-up is because the catalysts are allowed to bring into close contact reactants from different phases, for example, aqueous and organic, which at normal circumstances, would either be slow to juxtapose one another, or in some instances totally unreactive. For this reason, allowing the phases to react will increase reaction times boosting output. Therefore, the industries such as the pharmaceuticals, agrochemicals, specialty chemicals which thrive on high production and minimum wastes have therefore been in consideration. In waste production, a 20-30% reduction is realized when the efficiency of reactions is increased by catalysts for example PTCs. Therefore, the industries are able to conform to environmental regulations which have tightened in the recent past and provide sustainable production processes.
Evonik Industries AG introduced a bio-based PTC in 2023 that not only improves reaction rates but also supports sustainable chemical processes by using renewable resources. This development reflects the industry's commitment to both environmental and operational efficiency, addressing the growing need for faster, cleaner, and more cost-effective chemical processes that align with regulatory requirements and market demands.
Restraint
Cost of implementation hampers market growth.
The largest disadvantage of Phase-Transfer Catalysts is the cost of implementation. While the utilization of PTC should decrease the operational costs for companies across multiple industries and improve effectiveness over time, and it required investments in these solutions for them to be integrated. This includes the costs of experimental and theoretical research, that will be necessary for formulating new processes on the premise of these catalysts. They will also require employees to undergo training to safely and effectively operate these new systems in the company’s production processes. Furthermore, for smaller companies or larger companies with limited funding, it can be difficult to justify such an investment, especially if there are no major flaws in their already existing catalysts utilization process or if implementing PTC does not provide immediate benefits. Additionally, the costs of pilot testing and scaling up to a production scale that will be big enough to be worthy of these investments can further complicate the financial situation of such companies.
By Type
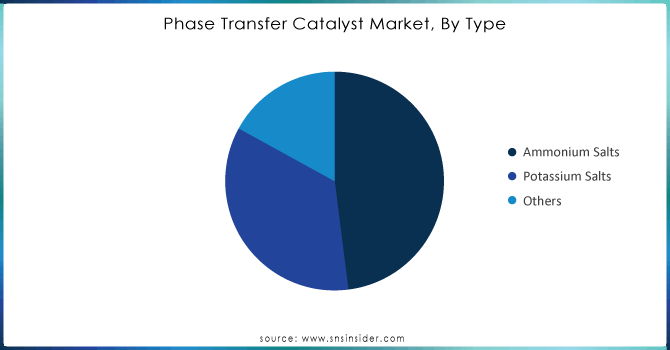
The ammonium salts held the largest market share around 50% in 2023. The reason for this is that ammonium salts are important reagents in the chemical and polymers industry. The chemical industry uses ammonium salts to help the transfer of anions from the organic phase to the aqueous phase in reactions like the synthesis of alkyl halides from alcohols. In the polymer industry, ammonium salts are used to help the transport of reactive species between two phases which differ in their affinity to these species, such as monomers.
Potassium salts, is also growing in market with a significant growth. It has the ability to form stable, water-soluble complexes and are often used for halogenation and esterification reactions. In the agrochemical industry, potassium salts are critical for the production of herbicides, insecticides, and pesticides. Importantly, the Food & Drug Administration has declared potassium salts to be ideal for chemical processes and industries. They are eco-friendly and safe to use in such processes, being non-toxic in nature.
Need Any Customization Research On Phase-Transfer Catalyst Market - Inquiry Now
By End-Use
Pharmaceuticals was the largest end-use segment, accounting for over 40% market share in 2023. In the drug formulation, synthesis, research & development, and other applications, the industry uses phase transfer catalysts. Tighter restrictions in Europe and North America with regard to use of harmful compounds have resulted to higher penetration of phase transfer catalysts. Due to restraining use of organic solvents.
Chemicals is a major consumer of PTCs as they increase the overall quality of chemical reactions, employing more control over its reaction rate. Additionally, these materials allow reactions to proceed in mild conditions and simple work-up procedures, facilitating their utilization in large-scale industrial applications. The main use of PTCs in the chemicals industry is for the production of specialty chemicals, such as the creation of crown ethers from the extraction and separation of aqueous solution salts.
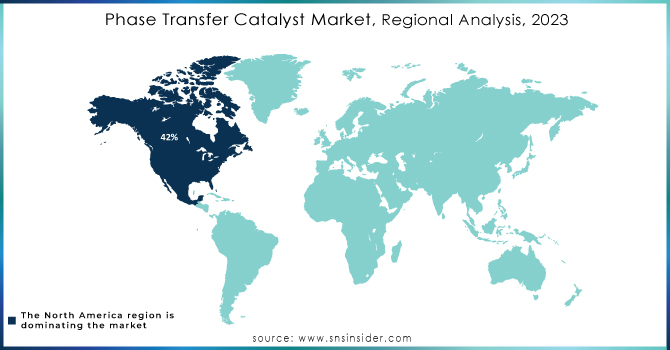
North America held the highest market share around 42% in 2023. It is due to advanced industrial infrastructure and a well-developed regulatory framework; the country provides a strong emphasis on research and development in chemical processes. The well-established pharmaceutical and agrochemical industries in this region are active markets for PTC; PTC is used to enhance reaction efficiency and comply with the environmental regulations of these developed countries. According to the US Environmental Protection Agency, the implementation of green chemistry technologies, including the use of PTC, has largely contributed to the 30% reduction in hazardous waste generation. Second, a well-established network of academic institutions and research organizations forms a competent force of scientists in the field of catalysis. Therefore, in 2021, the size of the development of the use of phase-transfer catalysts in various applications is positively affected in the short term by the themes of environmental friendliness.
BASF SE (Aliquat 336)
Merck KGaA (Triton B)
Tokyo Chemical Industry Co., Ltd. (TCI) (TBAB - Tetrabutylammonium Bromide)
Central Drug House (CDH) (Tetraethylammonium Bromide)
SACHEM, Inc. (QUAB)
Tatva Chintan Pharma Chem Ltd. (Methyltrioctylammonium Chloride)
Kantons AG (Crown Ether)
Strem Chemicals, Inc. (18-Crown-6)
Alfa Aesar (A Thermo Fisher Scientific Brand) (Tetrabutylammonium Hydrogen Sulfate)
Nippon Chemical Industrial Co., Ltd. (Tetrahexylammonium Bromide)
Apollo Scientific Ltd. (Tetraphenylphosphonium Bromide)
Dishman Group (Benzyltriethylammonium Chloride)
Heraeus Holding GmbH (Methyltricaprylammonium Chloride)
Solvay S.A. (Cyphos IL 101)
Tokyo Kasei Kogyo Co., Ltd. (Tetrabutylammonium Iodide)
Yokoyama Kogyo Co., Ltd. (Aliquat 336)
S.D. Fine-Chem Ltd. (Tetrabutylammonium Fluoride)
Eastman Chemical Company (Triethylbenzylammonium Chloride)
Pfaltz & Bauer, Inc. (Tetraoctylammonium Bromide)
Spectrum Chemical Manufacturing Corp. (Tetramethylammonium Bromide)
In 2023, BASF introduced a new range of environmentally friendly phase-transfer catalysts aimed at reducing energy consumption during chemical synthesis. This development reflects the growing demand for sustainable and efficient catalysts in various industries.
In 2023, Evonik launched a bio-based phase-transfer catalyst as part of its sustainability initiative. The new catalyst is derived from renewable resources, addressing the increasing regulatory pressure to minimize the environmental impact of chemical processes.
In 2022, Solvay expanded its product portfolio by adding a high-performance phase-transfer catalyst specifically designed for the pharmaceutical industry. This catalyst enhances reaction rates and yield, supporting the development of complex chemical processes in drug manufacturing.
Report Attributes | Details |
Market Size in 2023 | US$ 1.1 Billion |
Market Size by 2032 | US$ 1.8 Billion |
CAGR | CAGR of 5.7% From 2024 to 2032 |
Base Year | 2023 |
Forecast Period | 2024-2032 |
Historical Data | 2020-2022 |
Report Scope & Coverage | Market Size, Segments Analysis, Competitive Landscape, Regional Analysis, DROC & SWOT Analysis, Forecast Outlook |
Key Segments | • By Type (Ammonium Salts, Potassium Salts, and Other) • By End-Use (Pharmaceuticals, Agriculture, Chemical, and Others) |
Regional Analysis/Coverage | North America (US, Canada, Mexico), Europe (Eastern Europe [Poland, Romania, Hungary, Turkey, Rest of Eastern Europe] Western Europe [Germany, France, UK, Italy, Spain, Netherlands, Switzerland, Austria, Rest of Western Europe]), Asia Pacific (China, India, Japan, South Korea, Vietnam, Singapore, Australia, Rest of Asia Pacific), Middle East & Africa (Middle East [UAE, Egypt, Saudi Arabia, Qatar, Rest of Middle East], Africa [Nigeria, South Africa, Rest of Africa], Latin America (Brazil, Argentina, Colombia, Rest of Latin America) |
Company Profiles | BASF SE, Merck KGaA, Tokyo Chemical Industry Co., Ltd. (TCI), Central Drug House (CDH), SACHEM, Inc., Tatva Chintan Pharma Chem Ltd., Kantons AG, Strem Chemicals, Inc., Alfa Aesar (A Thermo Fisher Scientific Brand), Nippon Chemical Industrial Co., Ltd., Apollo Scientific Ltd., Dishman Group, Heraeus Holding GmbH, Solvay S.A., Tokyo Kasei Kogyo Co., Ltd., Yokoyama Kogyo Co., Ltd., S.D. Fine-Chem Ltd., Eastman Chemical Company, Pfaltz & Bauer, Inc., Spectrum Chemical Manufacturing Corp and Others |
Key Drivers | • Green Chemistry and Environmental Regulations • Enhanced Reaction Rates and Yields which Drives the Market Growth. |
RESTRAINTS | • Cost of implementation hampers market growth |
Ans: The Phase-transfer Catalyst Market was valued at USD 1.1 Billion in 2023.
Ans: The expected CAGR of the global Phase-transfer Catalyst Market during the forecast period is 5.7%.
Ans: The Ammonium Salts grow rapidly in the Phase-transfer Catalyst Market from 2024-2032
Ans: The digital catalyst revolution creates the opportunity in Phase-transfer Catalyst market.
Ans: The U.S. led the Phase-transfer Catalyst Market in North America region with the highest revenue share in 2023.
Table of Contents
1. Introduction
1.1 Market Definition
1.2 Scope (Inclusion and Exclusions)
1.3 Research Assumptions
2. Executive Summary
2.1 Market Overview
2.2 Regional Synopsis
2.3 Competitive Summary
3. Research Methodology
3.1 Top-Down Approach
3.2 Bottom-up Approach
3.3. Data Validation
3.4 Primary Interviews
4. Market Dynamics Impact Analysis
3.1 Market Driving Factors Analysis
3.1.2 Drivers
3.1.2 Restraints
3.1.3 Opportunities
3.1.4 Challenges
3.2 PESTLE Analysis
3.3 Porter’s Five Forces Model
5. Statistical Insights and Trends Reporting
5.1 Production Capacity and Utilization, by Country, by Type, 2023
5.2 Feedstock Prices, by Country, by Type, 2023
5.3 Regulatory Impact, by l Country, by Type, 2023.
5.4 Environmental Metrics: Emissions Data, Waste Management Practices, and Sustainability Initiatives, by Region
5.5 Innovation and R&D, by Type, 2023
6. Competitive Landscape
6.1 List of Major Companies, By Region
6.2 Market Share Analysis, By Region
6.3 Product Benchmarking
6.3.1 Product specifications and features
6.3.2 Pricing
6.4 Strategic Initiatives
6.4.1 Marketing and promotional activities
6.4.2 Distribution and supply chain strategies
6.4.3 Expansion plans and new Product launches
6.4.4 Strategic partnerships and collaborations
6.5 Technological Advancements
6.6 Market Positioning and Branding
7. Phase-transfer Catalyst Market Segmentation, by Type
7.1 Chapter Overview
7.2 Ammonium Salts
7.2.1 Ammonium Salts Market Trends Analysis (2020-2032)
7.2.2 Ammonium Salts Market Size Estimates and Forecasts to 2032 (USD Billion)
7.3 Potassium Salts
7.3.1 Potassium Salts Market Trends Analysis (2020-2032)
7.3.2 Potassium Salts Market Size Estimates and Forecasts to 2032 (USD Billion)
7.4 Others
7.4.1 Others Market Trends Analysis (2020-2032)
7.4.2 Others Market Size Estimates and Forecasts to 2032 (USD Billion)
8. Phase-transfer Catalyst Market Segmentation, by End-Use
8.1 Chapter Overview
8.2 Pharmaceuticals
8.2.1 Pharmaceuticals Market Trends Analysis (2020-2032)
8.2.2 Pharmaceuticals Market Size Estimates and Forecasts to 2032 (USD Billion)
8.3 Agriculture
8.3.1 Agriculture Market Trends Analysis (2020-2032)
8.3.2 Agriculture Market Size Estimates and Forecasts to 2032 (USD Billion)
8.4 Chemical
8.4.1 Chemical Market Trends Analysis (2020-2032)
8.4.2 Chemical Market Size Estimates and Forecasts to 2032 (USD Billion)
8.5 Others
8.5.1 Others Market Trends Analysis (2020-2032)
8.5.2 Others Market Size Estimates and Forecasts to 2032 (USD Billion)
9. Regional Analysis
9.1 Chapter Overview
9.2 North America
9.2.1 Trends Analysis
9.2.2 North America Phase-transfer Catalyst Market Estimates and Forecasts, by Country (2020-2032) (USD Billion)
9.2.3 North America Phase-transfer Catalyst Market Estimates and Forecasts, by Type (2020-2032) (USD Billion)
9.2.4 North America Phase-transfer Catalyst Market Estimates and Forecasts, by End-Use (2020-2032) (USD Billion)
9.2.5 USA
9.2.5.1 USA Phase-transfer Catalyst Market Estimates and Forecasts, by Type (2020-2032) (USD Billion)
9.2.5.2 USA Phase-transfer Catalyst Market Estimates and Forecasts, by End-Use (2020-2032) (USD Billion)
9.2.6 Canada
9.2.6.1 Canada Phase-transfer Catalyst Market Estimates and Forecasts, by Type (2020-2032) (USD Billion)
9.2.6.2 Canada Phase-transfer Catalyst Market Estimates and Forecasts, by End-Use (2020-2032) (USD Billion)
9.2.7 Mexico
9.2.7.1 Mexico Phase-transfer Catalyst Market Estimates and Forecasts, by Type (2020-2032) (USD Billion)
9.2.7.2 Mexico Phase-transfer Catalyst Market Estimates and Forecasts, by End-Use (2020-2032) (USD Billion)
9.3 Europe
9.3.1 Eastern Europe
9.3.1.1 Trends Analysis
9.3.1.2 Eastern Europe Phase-transfer Catalyst Market Estimates and Forecasts, by Country (2020-2032) (USD Billion)
9.3.1.3 Eastern Europe Phase-transfer Catalyst Market Estimates and Forecasts, by Type (2020-2032) (USD Billion)
9.3.1.4 Eastern Europe Phase-transfer Catalyst Market Estimates and Forecasts, by End-Use (2020-2032) (USD Billion)
9.3.1.5 Poland
9.3.1.5.1 Poland Phase-transfer Catalyst Market Estimates and Forecasts, by Type (2020-2032) (USD Billion)
9.3.1.5.2 Poland Phase-transfer Catalyst Market Estimates and Forecasts, by End-Use (2020-2032) (USD Billion)
9.3.1.6 Romania
9.3.1.6.1 Romania Phase-transfer Catalyst Market Estimates and Forecasts, by Type (2020-2032) (USD Billion)
9.3.1.6.2 Romania Phase-transfer Catalyst Market Estimates and Forecasts, by End-Use (2020-2032) (USD Billion)
9.3.1.7 Hungary
9.3.1.7.1 Hungary Phase-transfer Catalyst Market Estimates and Forecasts, by Type (2020-2032) (USD Billion)
9.3.1.7.2 Hungary Phase-transfer Catalyst Market Estimates and Forecasts, by End-Use (2020-2032) (USD Billion)
9.3.1.8 Turkey
9.3.1.8.1 Turkey Phase-transfer Catalyst Market Estimates and Forecasts, by Type (2020-2032) (USD Billion)
9.3.1.8.2 Turkey Phase-transfer Catalyst Market Estimates and Forecasts, by End-Use (2020-2032) (USD Billion)
9.3.1.9 Rest of Eastern Europe
9.3.1.9.1 Rest of Eastern Europe Phase-transfer Catalyst Market Estimates and Forecasts, by Type (2020-2032) (USD Billion)
9.3.1.9.2 Rest of Eastern Europe Phase-transfer Catalyst Market Estimates and Forecasts, by End-Use (2020-2032) (USD Billion)
9.3.2 Western Europe
9.3.2.1 Trends Analysis
9.3.2.2 Western Europe Phase-transfer Catalyst Market Estimates and Forecasts, by Country (2020-2032) (USD Billion)
9.3.2.3 Western Europe Phase-transfer Catalyst Market Estimates and Forecasts, by Type (2020-2032) (USD Billion)
9.3.2.4 Western Europe Phase-transfer Catalyst Market Estimates and Forecasts, by End-Use (2020-2032) (USD Billion)
9.3.2.5 Germany
9.3.2.5.1 Germany Phase-transfer Catalyst Market Estimates and Forecasts, by Type (2020-2032) (USD Billion)
9.3.2.5.2 Germany Phase-transfer Catalyst Market Estimates and Forecasts, by End-Use (2020-2032) (USD Billion)
9.3.2.6 France
9.3.2.6.1 France Phase-transfer Catalyst Market Estimates and Forecasts, by Type (2020-2032) (USD Billion)
9.3.2.6.2 France Phase-transfer Catalyst Market Estimates and Forecasts, by End-Use (2020-2032) (USD Billion)
9.3.2.7 UK
9.3.2.7.1 UK Phase-transfer Catalyst Market Estimates and Forecasts, by Type (2020-2032) (USD Billion)
9.3.2.7.2 UK Phase-transfer Catalyst Market Estimates and Forecasts, by End-Use (2020-2032) (USD Billion)
9.3.2.8 Italy
9.3.2.8.1 Italy Phase-transfer Catalyst Market Estimates and Forecasts, by Type (2020-2032) (USD Billion)
9.3.2.8.2 Italy Phase-transfer Catalyst Market Estimates and Forecasts, by End-Use (2020-2032) (USD Billion)
9.3.2.9 Spain
9.3.2.9.1 Spain Phase-transfer Catalyst Market Estimates and Forecasts, by Type (2020-2032) (USD Billion)
9.3.2.9.2 Spain Phase-transfer Catalyst Market Estimates and Forecasts, by End-Use (2020-2032) (USD Billion)
9.3.2.10 Netherlands
9.3.2.10.1 Netherlands Phase-transfer Catalyst Market Estimates and Forecasts, by Type (2020-2032) (USD Billion)
9.3.2.10.2 Netherlands Phase-transfer Catalyst Market Estimates and Forecasts, by End-Use (2020-2032) (USD Billion)
9.3.2.11 Switzerland
9.3.2.11.1 Switzerland Phase-transfer Catalyst Market Estimates and Forecasts, by Type (2020-2032) (USD Billion)
9.3.2.11.2 Switzerland Phase-transfer Catalyst Market Estimates and Forecasts, by End-Use (2020-2032) (USD Billion)
9.3.2.12 Austria
9.3.2.12.1 Austria Phase-transfer Catalyst Market Estimates and Forecasts, by Type (2020-2032) (USD Billion)
9.3.2.12.2 Austria Phase-transfer Catalyst Market Estimates and Forecasts, by End-Use (2020-2032) (USD Billion)
9.3.2.13 Rest of Western Europe
9.3.2.13.1 Rest of Western Europe Phase-transfer Catalyst Market Estimates and Forecasts, by Type (2020-2032) (USD Billion)
9.3.2.13.2 Rest of Western Europe Phase-transfer Catalyst Market Estimates and Forecasts, by End-Use (2020-2032) (USD Billion)
9.4 Asia Pacific
9.4.1 Trends Analysis
9.4.2 Asia Pacific Phase-transfer Catalyst Market Estimates and Forecasts, by Country (2020-2032) (USD Billion)
9.4.3 Asia Pacific Phase-transfer Catalyst Market Estimates and Forecasts, by Type (2020-2032) (USD Billion)
9.4.4 Asia Pacific Phase-transfer Catalyst Market Estimates and Forecasts, by End-Use (2020-2032) (USD Billion)
9.4.5 China
9.4.5.1 China Phase-transfer Catalyst Market Estimates and Forecasts, by Type (2020-2032) (USD Billion)
9.4.5.2 China Phase-transfer Catalyst Market Estimates and Forecasts, by End-Use (2020-2032) (USD Billion)
9.4.6 India
9.4.5.1 India Phase-transfer Catalyst Market Estimates and Forecasts, by Type (2020-2032) (USD Billion)
9.4.5.2 India Phase-transfer Catalyst Market Estimates and Forecasts, by End-Use (2020-2032) (USD Billion)
9.4.5 Japan
9.4.5.1 Japan Phase-transfer Catalyst Market Estimates and Forecasts, by Type (2020-2032) (USD Billion)
9.4.5.2 Japan Phase-transfer Catalyst Market Estimates and Forecasts, by End-Use (2020-2032) (USD Billion)
9.4.6 South Korea
9.4.6.1 South Korea Phase-transfer Catalyst Market Estimates and Forecasts, by Type (2020-2032) (USD Billion)
9.4.6.2 South Korea Phase-transfer Catalyst Market Estimates and Forecasts, by End-Use (2020-2032) (USD Billion)
9.4.7 Vietnam
9.4.7.1 Vietnam Phase-transfer Catalyst Market Estimates and Forecasts, by Type (2020-2032) (USD Billion)
9.2.7.2 Vietnam Phase-transfer Catalyst Market Estimates and Forecasts, by End-Use (2020-2032) (USD Billion)
9.4.8 Singapore
9.4.8.1 Singapore Phase-transfer Catalyst Market Estimates and Forecasts, by Type (2020-2032) (USD Billion)
9.4.8.2 Singapore Phase-transfer Catalyst Market Estimates and Forecasts, by End-Use (2020-2032) (USD Billion)
9.4.9 Australia
9.4.9.1 Australia Phase-transfer Catalyst Market Estimates and Forecasts, by Type (2020-2032) (USD Billion)
9.4.9.2 Australia Phase-transfer Catalyst Market Estimates and Forecasts, by End-Use (2020-2032) (USD Billion)
9.4.10 Rest of Asia Pacific
9.4.10.1 Rest of Asia Pacific Phase-transfer Catalyst Market Estimates and Forecasts, by Type (2020-2032) (USD Billion)
9.4.10.2 Rest of Asia Pacific Phase-transfer Catalyst Market Estimates and Forecasts, by End-Use (2020-2032) (USD Billion)
9.5 Middle East and Africa
9.5.1 Middle East
9.5.1.1 Trends Analysis
9.5.1.2 Middle East Phase-transfer Catalyst Market Estimates and Forecasts, by Country (2020-2032) (USD Billion)
9.5.1.3 Middle East Phase-transfer Catalyst Market Estimates and Forecasts, by Type (2020-2032) (USD Billion)
9.5.1.4 Middle East Phase-transfer Catalyst Market Estimates and Forecasts, by End-Use (2020-2032) (USD Billion)
9.5.1.5 UAE
9.5.1.5.1 UAE Phase-transfer Catalyst Market Estimates and Forecasts, by Type (2020-2032) (USD Billion)
9.5.1.5.2 UAE Phase-transfer Catalyst Market Estimates and Forecasts, by End-Use (2020-2032) (USD Billion)
9.5.1.6 Egypt
9.5.1.6.1 Egypt Phase-transfer Catalyst Market Estimates and Forecasts, by Type (2020-2032) (USD Billion)
9.5.1.6.2 Egypt Phase-transfer Catalyst Market Estimates and Forecasts, by End-Use (2020-2032) (USD Billion)
9.5.1.7 Saudi Arabia
9.5.1.7.1 Saudi Arabia Phase-transfer Catalyst Market Estimates and Forecasts, by Type (2020-2032) (USD Billion)
9.5.1.7.2 Saudi Arabia Phase-transfer Catalyst Market Estimates and Forecasts, by End-Use (2020-2032) (USD Billion)
9.5.1.8 Qatar
9.5.1.8.1 Qatar Phase-transfer Catalyst Market Estimates and Forecasts, by Type (2020-2032) (USD Billion)
9.5.1.8.2 Qatar Phase-transfer Catalyst Market Estimates and Forecasts, by End-Use (2020-2032) (USD Billion)
9.5.1.9 Rest of Middle East
9.5.1.9.1 Rest of Middle East Phase-transfer Catalyst Market Estimates and Forecasts, by Type (2020-2032) (USD Billion)
9.5.1.9.2 Rest of Middle East Phase-transfer Catalyst Market Estimates and Forecasts, by End-Use (2020-2032) (USD Billion)
9.5.2 Africa
9.5.2.1 Trends Analysis
9.5.2.2 Africa Phase-transfer Catalyst Market Estimates and Forecasts, by Country (2020-2032) (USD Billion)
9.5.2.3 Africa Phase-transfer Catalyst Market Estimates and Forecasts, by Type (2020-2032) (USD Billion)
9.5.2.4 Africa Phase-transfer Catalyst Market Estimates and Forecasts, by End-Use (2020-2032) (USD Billion)
9.5.2.5 South Africa
9.5.2.5.1 South Africa Phase-transfer Catalyst Market Estimates and Forecasts, by Type (2020-2032) (USD Billion)
9.5.2.5.2 South Africa Phase-transfer Catalyst Market Estimates and Forecasts, by End-Use (2020-2032) (USD Billion)
9.5.2.6 Nigeria
9.5.2.6.1 Nigeria Phase-transfer Catalyst Market Estimates and Forecasts, by Type (2020-2032) (USD Billion)
9.5.2.6.2 Nigeria Phase-transfer Catalyst Market Estimates and Forecasts, by End-Use (2020-2032) (USD Billion)
9.6 Latin America
9.6.1 Trends Analysis
9.6.2 Latin America Phase-transfer Catalyst Market Estimates and Forecasts, by Country (2020-2032) (USD Billion)
9.6.3 Latin America Phase-transfer Catalyst Market Estimates and Forecasts, by Type (2020-2032) (USD Billion)
9.6.4 Latin America Phase-transfer Catalyst Market Estimates and Forecasts, by End-Use (2020-2032) (USD Billion)
9.6.5 Brazil
9.6.5.1 Brazil Phase-transfer Catalyst Market Estimates and Forecasts, by Type (2020-2032) (USD Billion)
9.6.5.2 Brazil Phase-transfer Catalyst Market Estimates and Forecasts, by End-Use (2020-2032) (USD Billion)
9.6.6 Argentina
9.6.6.1 Argentina Phase-transfer Catalyst Market Estimates and Forecasts, by Type (2020-2032) (USD Billion)
9.6.6.2 Argentina Phase-transfer Catalyst Market Estimates and Forecasts, by End-Use (2020-2032) (USD Billion)
9.6.7 Colombia
9.6.7.1 Colombia Phase-transfer Catalyst Market Estimates and Forecasts, by Type (2020-2032) (USD Billion)
9.6.7.2 Colombia Phase-transfer Catalyst Market Estimates and Forecasts, by End-Use (2020-2032) (USD Billion)
9.6.8 Rest of Latin America
9.6.8.1 Rest of Latin America Phase-transfer Catalyst Market Estimates and Forecasts, by Type (2020-2032) (USD Billion)
9.6.8.2 Rest of Latin America Phase-transfer Catalyst Market Estimates and Forecasts, by End-Use (2020-2032) (USD Billion)
10. Company Profiles
10.1 BASF SE
10.1.1 Company Overview
10.1.2 Financial
10.1.3 Product / Services Offered
10.1.4 SWOT Analysis
10.2 Merck KGaA
10.2.1 Company Overview
10.2.2 Financial
10.2.3 Product / Services Offered
10.2.4 SWOT Analysis
10.3 Tokyo Chemical Industry Co., Ltd.
10.3.1 Company Overview
10.3.2 Financial
10.3.3 Product / Services Offered
10.3.4 SWOT Analysis
10.4 Central Drug House
10.4.1 Company Overview
10.4.2 Financial
10.4.3 Product / Services Offered
10.4.4 SWOT Analysis
10.5 Tatva Chintan Pharma Chem Ltd.
10.5.1 Company Overview
10.5.2 Financial
10.5.3 Product / Services Offered
10.5.4 SWOT Analysis
10.6 Strem Chemicals, Inc.
10.6.1 Company Overview
10.6.2 Financial
10.6.3 Product / Services Offered
10.6.4 SWOT Analysis
10.7 Nippon Chemical Industrial Co., Ltd.
10.7.1 Company Overview
10.7.2 Financial
10.7.3 Product / Services Offered
10.7.4 SWOT Analysis
10.8 Apollo Scientific Ltd.
10.8.1 Company Overview
10.8.2 Financial
10.8.3 Product / Services Offered
10.8.4 SWOT Analysis
10.9 Heraeus Holding GmbH
10.9.1 Company Overview
10.9.2 Financial
10.9.3 Product / Services Offered
10.9.4 SWOT Analysis
10.10 Tokyo Kasei Kogyo Co., Ltd.
10.10.1 Company Overview
10.10.2 Financial
10.10.3 Product / Services Offered
10.10.4 SWOT Analysis
11. Use Cases and Best Practices
12. Conclusion
An accurate research report requires proper strategizing as well as implementation. There are multiple factors involved in the completion of good and accurate research report and selecting the best methodology to compete the research is the toughest part. Since the research reports we provide play a crucial role in any company’s decision-making process, therefore we at SNS Insider always believe that we should choose the best method which gives us results closer to reality. This allows us to reach at a stage wherein we can provide our clients best and accurate investment to output ratio.
Each report that we prepare takes a timeframe of 350-400 business hours for production. Starting from the selection of titles through a couple of in-depth brain storming session to the final QC process before uploading our titles on our website we dedicate around 350 working hours. The titles are selected based on their current market cap and the foreseen CAGR and growth.
The 5 steps process:
Step 1: Secondary Research:
Secondary Research or Desk Research is as the name suggests is a research process wherein, we collect data through the readily available information. In this process we use various paid and unpaid databases which our team has access to and gather data through the same. This includes examining of listed companies’ annual reports, Journals, SEC filling etc. Apart from this our team has access to various associations across the globe across different industries. Lastly, we have exchange relationships with various university as well as individual libraries.
Step 2: Primary Research
When we talk about primary research, it is a type of study in which the researchers collect relevant data samples directly, rather than relying on previously collected data. This type of research is focused on gaining content specific facts that can be sued to solve specific problems. Since the collected data is fresh and first hand therefore it makes the study more accurate and genuine.
We at SNS Insider have divided Primary Research into 2 parts.
Part 1 wherein we interview the KOLs of major players as well as the upcoming ones across various geographic regions. This allows us to have their view over the market scenario and acts as an important tool to come closer to the accurate market numbers. As many as 45 paid and unpaid primary interviews are taken from both the demand and supply side of the industry to make sure we land at an accurate judgement and analysis of the market.
This step involves the triangulation of data wherein our team analyses the interview transcripts, online survey responses and observation of on filed participants. The below mentioned chart should give a better understanding of the part 1 of the primary interview.
Part 2: In this part of primary research the data collected via secondary research and the part 1 of the primary research is validated with the interviews from individual consultants and subject matter experts.
Consultants are those set of people who have at least 12 years of experience and expertise within the industry whereas Subject Matter Experts are those with at least 15 years of experience behind their back within the same space. The data with the help of two main processes i.e., FGDs (Focused Group Discussions) and IDs (Individual Discussions). This gives us a 3rd party nonbiased primary view of the market scenario making it a more dependable one while collation of the data pointers.
Step 3: Data Bank Validation
Once all the information is collected via primary and secondary sources, we run that information for data validation. At our intelligence centre our research heads track a lot of information related to the market which includes the quarterly reports, the daily stock prices, and other relevant information. Our data bank server gets updated every fortnight and that is how the information which we collected using our primary and secondary information is revalidated in real time.
Step 4: QA/QC Process
After all the data collection and validation our team does a final level of quality check and quality assurance to get rid of any unwanted or undesired mistakes. This might include but not limited to getting rid of the any typos, duplication of numbers or missing of any important information. The people involved in this process include technical content writers, research heads and graphics people. Once this process is completed the title gets uploader on our platform for our clients to read it.
Step 5: Final QC/QA Process:
This is the last process and comes when the client has ordered the study. In this process a final QA/QC is done before the study is emailed to the client. Since we believe in giving our clients a good experience of our research studies, therefore, to make sure that we do not lack at our end in any way humanly possible we do a final round of quality check and then dispatch the study to the client.
Key Segments:
By Type
Ammonium Salts
Potassium Salts
Others
By End-Use
Pharmaceuticals
Agriculture
Chemical
Others
Request for Segment Customization as per your Business Requirement: Segment Customization Request
Regional Coverage:
North America
US
Canada
Mexico
Europe
Eastern Europe
Poland
Romania
Hungary
Turkey
Rest of Eastern Europe
Western Europe
Germany
France
UK
Italy
Spain
Netherlands
Switzerland
Austria
Rest of Western Europe
Asia Pacific
China
India
Japan
South Korea
Vietnam
Singapore
Australia
Rest of Asia Pacific
Middle East & Africa
Middle East
UAE
Egypt
Saudi Arabia
Qatar
Rest of Middle East
Africa
Nigeria
South Africa
Rest of Africa
Latin America
Brazil
Argentina
Colombia
Rest of Latin America
Request for Country Level Research Report: Country Level Customization Request
Available Customization
With the given market data, SNS Insider offers customization as per the company’s specific needs. The following customization options are available for the report:
Product Analysis
Criss-Cross segment analysis (e.g. Product X Application)
Product Matrix which gives a detailed comparison of product portfolio of each company
Geographic Analysis
Additional countries in any of the regions
Company Information
Detailed analysis and profiling of additional market players (Up to five)
The Automotive Adhesives Market size was USD 4.8 Billion in 2023 and is expected to reach USD 7.9 Billion by 2032 and grow at a CAGR of 5.8% by 2024-2032.
The Fats & Oils Market Size was valued at USD 253.6 billion in 2023 and will reach USD 357.8 billion by 2032, and grow at a CAGR of 3.9% by 2024-2032.
The Antifreeze Market size was valued at USD 5.5 Billion in 2023. It is expected to grow to USD 9.9 Billion by 2032 & grow at a CAGR of 6.9% over the forecast period of 2024-2032.
Base Oil Market Size was valued at USD 20.86 billion in 2023. It is projected to reach USD 33.20 billion by 2032 and grow at a CAGR of 5.3% over the forecast period 2024-2032.
The Flexible Paper Market Size was valued at USD 62.90 billion in 2022 and is expected to reach USD 89.46 billion by 2030, and grow at a CAGR of 4.5% over the forecast period 2023-2030.
The Corrosion Under Insulation (CUI) & Spray-On Insulation (SOI) Coatings Market was valued at USD 1.99 billion in 2023 and is expected to reach USD 3.09 billion by 2032, growing at a CAGR of 5.03 % over the forecast period 2024-2032.
Hi! Click one of our member below to chat on Phone