Phase Change Material Market Analysis & Overview:
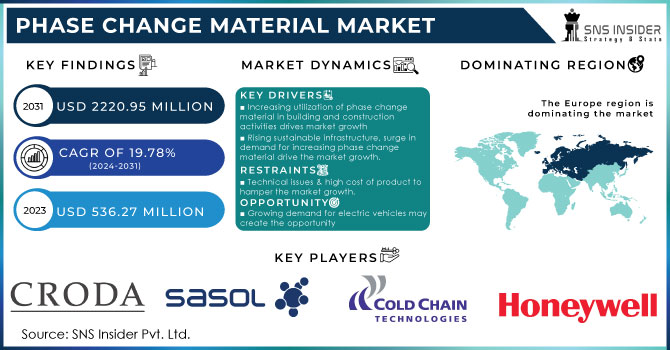
The Phase Change Material Market Size was valued at USD 536.3 Million in 2023 and is expected to reach USD 2,721.7 Million by 2032, growing at a CAGR of 19.8% over the forecast period of 2024-2032.
Get More Information on Phase Change Material Market - Request Sample Report
The phase change material market is influenced through a wide-ranging utility in various sectors. This report discusses the cost efficiency and its economic impact that results in energy-saving benefits. Shifting consumer awareness and education, regulatory frameworks, and sustainability initiatives shaping the industry are also covered. Moreover, the report delves into supply chain analysis with respect to phase change materials and scrutinizes the market dynamics that impact the demand and supply of phase change materials across the globe.
Phase Change Material Market Dynamics
Drivers
-
Growing demand for energy-efficient solutions in building and construction industry boosts the phase change material market growth
The phase change material market is majorly driven by a growing demand for energy-efficient solutions in the building and construction industry. With energy usage increasingly prioritized in the construction sector, Phase Change Materials are rapidly advancing in popularity, as they help store and release thermal energy. For the duration of a day, these materials absorb the heat from the sunlight, and when the sun goes down, they will give up their stored energy, allowing the heat to remain constant within your house, and saving money for further heating or cooling systems. This energy-saving feature is encouraging the use of Phase Change Materials (PCMs), especially in the construction of energy-efficient buildings and houses. Additionally, governments across the globe are tightening energy efficiency standards, which has also been driving demand for the materials in the construction and infrastructure sectors. The growth of the Phase Change Material market is driven, in part, by the increasing demand for energy-efficient products in the broader sustainable building solutions market.
Restraints
-
Lack of Standardization and Regulatory Frameworks Limits Market Growth and Product Development in Phase Change Material Industry
Lack of standards and regulations in the Phase Change Material industry is a factor hampering the market's growth. The broad diversity of applications of Phase Change Materials, from building construction to textiles, makes it difficult to establish standards and certification processes that are understood and universally accepted. The lack of uniformity in standards can complicate manufacturer accountability for the safety and effectiveness of their devices, leading to fragmentation of the market and inconsistencies in quality. Unstandardized testing procedures and regulations can lead to prolonged product evolution and limited market confidence, further delaying the integration of these applicable materials in multiple domains. There is no single way for product development and market standards, because companies are facing an uphill battle while trying to comply with a regulatory environment.
Opportunities
-
Expansion of Renewable Energy Applications Offers New Growth Opportunities for Phase Change Materials in Thermal Energy Storage
Growing global shift toward renewable energy sources has been providing strong opportunities for the Phase Change Material market over the coming years, especially in thermal energy storage eventualities. While the world witnesses the rise in use of renewable energy sources such as wind and solar, the intermittent nature of such energy sources calls for efficient energy storage systems. Abundance of heat energy can be stored and released in Phase Change Materials (PCMs) that significantly change their structure at a particular temperature during storing and releasing thermal energy, making them suitable candidates for thermal energy storage systems. Implementing Phase Change Materials into solar energy systems & other renewable technologies improves the energy storage efficiency and reliability. This could be a major growth opportunity for the Phase Change Material market, particularly in regions with increasing adoption of renewable energy.
Challenge
-
Consumer Perception and Adoption Barriers Due to High Initial Costs and Lack of Awareness Pose Challenges for Market Growth
Phase Change Materials also provide a long-term benefit, but consumer perception is a challenge for many companies due to higher initial costs and lack of consumer awareness regarding their benefits. This perception of high upfront investment is likely to put-off many potential customers, particularly with small to medium enterprises. Phase Change Materials are also less known to the general public this can limit them from reaching more places and showing their long-term energy efficiency and environmental benefits. Combined with slow education and awareness campaigns, this barrier to consumer adoption may cap the market potential. Finding ways to validate the technology and overcome these perception challenges is critical to the sustained adoption and growth of the Phase Change Material market.
Phase Change Material Market Segmental Analysis
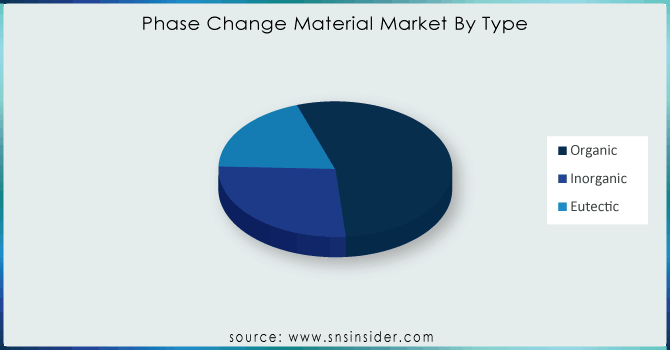
By Type
In 2023, Organic Phase Change Material held the largest market share of 45% due to their superior thermal performance, non-corrosive nature, and long-term stability. These materials primarily consist of paraffin and fatty acids and are commonly used in building insulation, electronics cooling, and thermal storage systems. Phase Change Materials (PCMs) have also seen their demand surge in the upcoming years on account of steps taken by organizations like the U.S. Department of Energy, that provided a promotional push to Organic PCMs in Building/Construction sector to achieve energy-efficient construction. Moreover, other companies including BASF and Croda International have also increased their bio-based paraffin portfolio to provide better thermal management solutions. The government policies promoted towards sustainable and energy-efficient materials have further facilitated the adoption of organic Phase Change Materials; thus, becoming the widely accepted choice in numerous industries.
By Encapsulation Technology
Macro-encapsulation technology accounted for a leading share of 43% of the total market share in 2023 owing to its superior thermal energy storage capacity and sturdiness. Due to their ease of integration & longer lifespan macro-encapsulated Phase Change Materials are widely used in building materials cold storage & HVAC systems. Fee funding towards government green building initiatives including the European Union’s Energy Performance of Buildings Directive (EPBD) have resulted in the adoption of macro-encapsulated solutions to achieve sustainable buildings. Major companies, including Climator Sweden AB and Rubitherm Technologies, have also been seen investing in macro-encapsulation technologies to improve thermal energy storage systems. Macro-encapsulation, owing to its greater efficiency and scalability, is the leading segment in Phase Change Materials.
By Application
The Building & Construction application segment accounted for the majority of the market share in 2023, at 32%, because of growing need for energy-efficient structures and stringent environmental regulations. Thermal energy storage companies are applying Phase Change Materials into walls and roofs, and were also used in floors to decrease heating and cooling costs. Notably, regulatory bodies including the U.S. Green Building Council and the European Commission have underscored the importance of adopting thermal energy storage materials to achieve carbon neutrality objectives. To facilitate green construction, companies such as DuPont and Phase Change Energy Solutions are quickly working on Phase Change Material-based insulation solutions. Increasing implementation of smart buildings and net-zero energy projects is also strengthening Building & Construction segment, thus dominating the Phase Change Material market.
Get Customized Report as per Your Business Requirement - Request For Customized Report
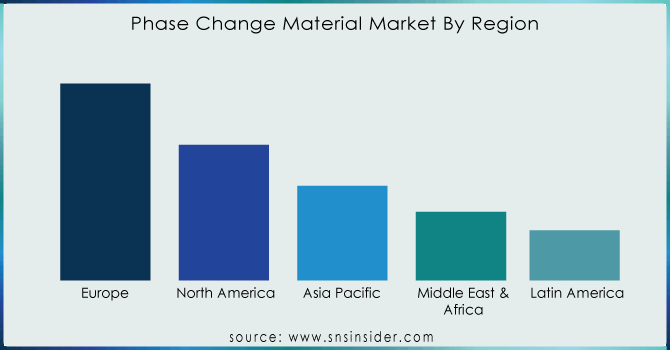
Phase Change Material Market Regional Outlook
In 2023, Europe dominated and had a 38% share in the Phase Change Material market, due to the stringent energy efficiency regulations, high adoption of green building initiatives, and the government’s supportive stance towards clean technologies in the region. Thermal energy storage solutions like Phase Change Materials have gained significant recognition for their ability to reduce the energy consumption, both for heating and cooling, of commercial and residential buildings under the European Union's Energy Performance of Buildings Directive (EPBD). Germany dominated with significant investments in sustainable construction and thermal energy storage technologies. Phase Change Materials are already used in nearly 40% of Germany’s buildings, according to the German Energy Agency (DENA), alongside energy-optimized insulation materials. United Kingdom is another significant country that has witnessed growing adoption of cold chain solutions owing to greater pharmaceutical and food logistics demands. Organization such as Croda International and Rubitherm Technologies is proactively making innovations for Phase Change Material based products to match the rigorous sustainability target in the region.
Asia Pacific emerged as the fastest-growing region in the Phase Change Material market and accounted for a significant growth rate. The growth can be credited to rapid industrialization, rising demand for energy-efficient buildings, and growing cold chain logistics. China’s government-backed energy conservation efforts and capital investments in sustainable construction put it ahead of the region. The Chinese Ministry of Housing and Urban-Rural Development has included energy-saving materials such as Phase Change Materials in the mandatory component for public infrastructure projects. India comes next, with huge growth driven by increasing demand for temperature-controlled packaging from the pharmaceutical and food sectors. India has been witnessing strong growth in its cold chain industry with CAGR between 17-18%, according to India Brand Equity Foundation (IBEF), which in turn is propelling demand for the Phase Change Materials. Japan is also playing a role in the expansion of the market with cutting-edge research into thermal energy storage solutions whilst firms such as Teappcm and Shin-Etsu Chemical are exploring new applications in electronics and automotive thermal management.
Recent Highlights
-
May 2023: Texas A&M University researchers created fundamental design guidelines for composite phase transition materials that enable quick thermal energy storage. The Office of Naval Research-funded theoretical framework offers three advantages for developing cylindrical composites, evaluating performance, and taking into consideration heat loads unique to thermal storage applications.
-
March 2023: BioLife Solutions launched the first-ever non-toxic, non-hazardous, and non-flammable phase change material (PCM) for -70°C ultra-low temperature (ULT) protection was introduced by BioLife Solutions as Ultra guard.
Key Players
-
AI Technology Inc. (Thermoelectric materials, Thermal Interface Materials)
-
Appvion Inc. (PCM-based papers, Thermoregulated packaging solutions)
-
Boyd Corporation (Thermal management materials, Heat exchangers)
-
Celgard LLC (Battery separator films, Lithium-ion battery separators)
-
Climator Sweden AB (Climator PCM modules, PCM-based thermal storage systems)
-
Cold Chain Technologies Inc. (Thermal packaging, Phase change material packs)
-
Cryopak (Thermal insulation products, PCM-based shipping solutions)
-
DuPont de Nemours, Inc. (Thermally conductive materials, PCM-based solutions)
-
Entropy Solutions (PURETemp PCM, Thermal energy storage systems)
-
Henkel AG & Company KGAA (Thermal interface materials, Thermal management adhesives)
-
Honeywell Electronic Materials Inc. (Phase change materials for electronics, Thermal interface materials)
-
Honeywell International Inc. (Thermal energy storage materials, Heat management solutions)
-
Laird Technologies, Inc. (Thermal management materials, PCM-based thermal solutions)
-
Microtek Laboratories Inc. (Thermal interface materials, Phase change materials for electronics)
-
Outlast Technologies LLC (Outlast PCM, Thermal regulation fabrics)
-
Phase Change Materials Products Ltd. (PCM-based products, Thermal management materials)
-
Phase Change Solutions (PURETemp PCM, Thermal storage solutions)
-
PureTemp LLC (PureTemp PCM, Temperature-regulated packaging)
-
Rubitherm Technologies GmbH (Rubitherm PCM, Thermal energy storage solutions)
-
Sasol Limited (PCM-based products, Thermal insulation materials)
| Report Attributes | Details |
|---|---|
| Market Size in 2023 | USD 536.3 Million |
| Market Size by 2032 | USD 2,721.7 Million |
| CAGR | CAGR of 19.8% From 2024 to 2032 |
| Base Year | 2023 |
| Forecast Period | 2024-2032 |
| Historical Data | 2020-2022 |
| Report Scope & Coverage | Market Size, Segments Analysis, Competitive Landscape, Regional Analysis, DROC & SWOT Analysis, Forecast Outlook |
| Key Segments | •By Type (Organic, Inorganic, Bio-based) •By Encapsulation Technology (Macro, Micro, Molecular) •By Application (Building & Construction, HVAC, Cold Chain & Packaging, Thermal Energy Storage, Refrigeration & Equipment, Textiles, Others) |
| Regional Analysis/Coverage | North America (US, Canada, Mexico), Europe (Eastern Europe [Poland, Romania, Hungary, Turkey, Rest of Eastern Europe] Western Europe] Germany, France, UK, Italy, Spain, Netherlands, Switzerland, Austria, Rest of Western Europe]), Asia Pacific (China, India, Japan, South Korea, Vietnam, Singapore, Australia, Rest of Asia Pacific), Middle East & Africa (Middle East [UAE, Egypt, Saudi Arabia, Qatar, Rest of Middle East], Africa [Nigeria, South Africa, Rest of Africa], Latin America (Brazil, Argentina, Colombia, Rest of Latin America) |
| Company Profiles | Honeywell International Inc., DuPont de Nemours, Inc., Croda International Plc, Boyd Corporation, Sasol Limited, Outlast Technologies LLC, Rubitherm Technologies GmbH, PureTemp LLC, Phase Change Solutions, Microtek Laboratories Inc. and other key players |
