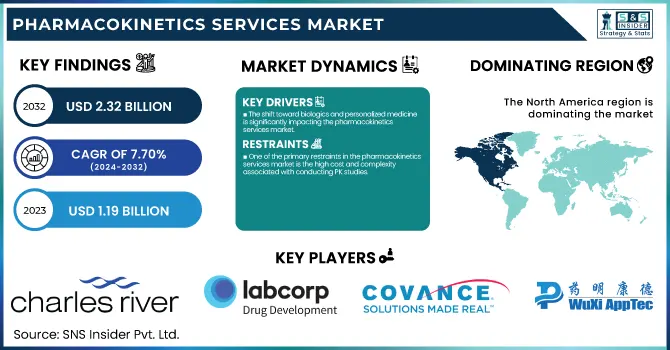
The Pharmacokinetics Services Market was valued at USD 1.19 billion in 2023 and is expected to reach USD 2.32 billion by 2032, growing at a CAGR of 7.70% from 2024-2032.
To Get more information on Pharmacokinetics Services Market - Request Free Sample Report
In this report, we present insightful information on the Pharmacokinetics Services Market, with an emphasis on major statistical parameters, including disease incidence and prevalence data for those that need pharmacokinetic studies, pointing to the need for such services during drug development. We also explore trends in prescriptions by region, presenting a regional distribution of pharmacokinetics services based on medication prescriptions. Furthermore, we incorporate drug development and clinical trial trends in our analysis, highlighting the use of pharmacokinetics data in all stages of clinical trials. We further discuss market adoption by industry sector and healthcare expenditure by region, presenting the economic investment and level of demand for pharmacokinetics services in drug safety and efficacy testing.
Drivers
The increasing complexity of drug development and the growing need for efficient pharmacokinetic (PK) studies to optimize drug efficacy and safety profiles are driving the demand for pharmacokinetics services.
The pharma sector is putting significant money into research, with world R&D expenditure totaling around USD 238 billion in 2023, up by 6% from the year before. Furthermore, the FDA approved 55 new drugs in 2023, which suggests a strong pipeline that necessitates stringent pharmacokinetic studies. The increasing incidence of chronic diseases like cancer, cardiovascular disease, and neurological disorders, which demand prolonged drug treatment, also accelerates the need for PK studies. Firms like WuXi AppTec and Covance are broadening their service portfolios, while the growing use of AI-based PK modeling is simplifying drug metabolism predictions, enhancing precision, and shortening development timelines. In addition, the growing number of clinical trials, which reached over 450,000 registered trials worldwide in 2023, underscores the expanding demand for pharmacokinetic evaluations to maintain regulatory compliance and maximize dosing regimens.
The shift toward biologics and personalized medicine is significantly impacting the pharmacokinetics services market.
Biopharmaceuticals represent almost 40% of total new drug approvals today, which requires highly specialized pharmacokinetic studies to match large-molecule drugs that are different in their behavior from classical small molecules. The monoclonal antibodies crossed around USD 200 billion globally in 2023, and the need for PK testing is increasing in line with the development of biosimilars, gene therapy, and RNA therapeutics. Demand for biosimilars is expected to increase, with more than 20 biologics blockbusters expiring their patents by 2030, further creating a need for PK and bioequivalence studies. For instance, in 2024, Charles River Laboratories diversified its bioanalytical offerings to facilitate cell and gene therapy development. The increasing focus on precision medicine, which is projected to capture more than 30% of new drug approvals by 2030, necessitates broad PK profiling to guarantee personalized drug regimens. Developments in microdosing, PBPK modeling, and organ-on-a-chip technologies are also revolutionizing pharmacokinetic testing to make it more predictive and cost-efficient.
Restraint
One of the primary restraints in the pharmacokinetics services market is the high cost and complexity associated with conducting PK studies.
The expense of early-stage pharmacokinetic analysis can be USD 500,000 to more than USD 2 million per study based on the nature of the drug, study complexity, and regulation. Sophisticated methods, including PBPK modeling, in-vivo animal model studies, and bioanalytical assays, involve cutting-edge instrumentation, highly trained manpower, and regulatory compliance at additional costs. Moreover, the growing need for biologics and personalized medicine has rendered PK studies more complex, as large molecules have nonlinear pharmacokinetics, necessitating specialized analytical techniques. Small biotech firms and startups usually have limited budgets, which restrict their capacity to invest in comprehensive PK testing. Furthermore, strict regulatory guidelines established by the FDA, EMA, and other organizations further increase costs, as compliance requires thorough validation and long-term studies. These issues have the potential to lengthen drug development timelines and impose entry barriers to new market entrants.
Opportunities
The growing focus on biologics, gene therapies, and personalized medicine presents a significant opportunity for the pharmacokinetics services market.
Biologics captured almost 40% of drug approvals in 2023, underscoring their growing prevalence in drug development. In contrast to small molecules, biologics have complex pharmacokinetic characteristics resulting from their sizeable molecular mass, immunogenicity, and distinct metabolic pathways. This has created a need for dedicated PK research, such as target-mediated drug disposition (TMDD), immunogenicity assays, and biodistribution studies. Additionally, the emergence of cell and gene therapies, which are expected to account for more than 15% of world pharmaceutical revenue by 2030, demands accurate PK/PD modeling to streamline dosing regimens. Consequently, CROs and bioanalytical laboratories are augmenting their capabilities in biologics-centric PK testing, providing novel solutions that cater to this fast-growing field.
Challenges
A key challenge in the pharmacokinetics services market is the regulatory complexity and lack of standardization across different global regions.
One of the most significant challenges in the market for pharmacokinetics services is regulatory complexity and non-standardization between global regions. Although regulatory bodies such as the FDA, EMA, and PMDA have clear guidelines for PK studies in small-molecule therapeutics, regulations for biologics, gene therapies, and new modalities are still fragmented and changing. Variances in bioequivalence study guidelines, analytical verification standards, and preclinical research requirements pose obstacles for pharmaceutical corporations that are involved in multicenter trials. Further, with evolving PK models like physiologically based pharmacokinetic (PBPK) modeling and artificial intelligence-based simulations on the rise, regulatory agencies have difficulty establishing unified acceptance criteria. This absence of harmonization leads to increased costs of compliance as well as longer drug approval processes, making it difficult for firms to harmonize their PK approach across markets.
By Drug Type
The small molecules segment dominated the pharmacokinetics services market with a 75.23% market share in 2023, owing to their extensive application in drug development, bioavailability, and cost efficiency. Most drugs are small-molecule drugs and account for a majority of worldwide pharmaceutical sales, with most blockbusters such as statins, antivirals, and oncology therapies being small-molecule drugs. Pharmacokinetic (PK) research is important for maximizing the absorption, distribution, metabolism, and excretion (ADME) profiles of these drugs, making them safe and effective. Moreover, regulatory bodies such as the U.S. FDA and EMA have strict guidelines for PK assessments, which further necessitate specialized PK services in small-molecule drug development. The presence of well-established PK models, analytical methods, and bioanalytical assays for small molecules has also helped them rule the market.
The small molecules segment is poised to maintain the fastest growth during the forecast period, fueled by continued drug innovation, generic drug approvals, and growing demand for oral therapeutics. Increased development of targeted treatments for chronic diseases like cancer, diabetes, and cardiovascular disease is driving large-scale PK studies of next-generation small molecules. Also, the growth of contract research organizations (CROs) in emerging markets such as China and India is increasing the availability and affordability of pharmacokinetics services, boosting small-molecule drug development. The increasing use of AI-based PK modeling, high-throughput screening, and in-silico PK simulations is further increasing the efficiency of small-molecule pharmacokinetics studies, making this segment poised for continued dominance and growth in the years to come.
By Application
The small & medium enterprise segment dominated the pharmacokinetics services market with 60.86% market share in 2023, driven largely by the increased number of biotech startups and mid-scale pharma firms working on new drug discovery and development. Such firms tend to outsource pharmacokinetics (PK) services to contract research organizations (CROs) to streamline expenses and tap into specialized skills. The rising trend of venture capital investment and government grants for early-stage drug development has further facilitated SMEs to invest in PK studies, maintaining regulatory compliance and maximizing drug efficacy. Moreover, SMEs are leaders in innovative drug development, such as orphan drugs, biologics, and targeted therapies, which necessitate comprehensive PK evaluations. More flexible, faster decision-making cycles and a focus on specialized therapeutic domains have made SMEs a powerful driver of the demand for pharmacokinetics services.
The large enterprise segment is anticipated to witness the fastest growth with 8.63% CAGR during the forecast period owing to the increasing global footprint of pharma titans, swelling R&D expenses, and embracing cutting-edge technologies such as AI-based PK modeling and high-throughput screening. Large pharma companies are increasing investment in biologics, biosimilars, and gene therapies, which need thorough PK analysis to be successful therapeutically. Moreover, mergers and acquisitions of large pharma and biotech companies are generating increased demand for in-house and outsourced PK services. The focus on precision medicine, companion diagnostics, and regulatory-compliant drug development is also driving PK service adoption in large enterprises. With growing global clinical trial networks and the rising use of automation in pharmacokinetics studies, large companies are set to experience tremendous growth, establishing their market position in the next few years.
By End Use
The academic & government research institutes segment dominated the market with 44.56% market share in 2023, largely because of growth in funding for drug research and development programs, partnership with regulatory agencies, and emphasis on basic pharmacokinetics studies. Government agencies and academia are important players in early drug discovery, toxicology studies, and clinical pharmacology research, which fuel the demand for pharmacokinetics services. In addition, public funding programs and research grants from institutions such as the National Institutes of Health (NIH), European Medicines Agency (EMA), and other international health agencies have driven pharmacokinetic research in various therapeutic areas, such as oncology, neurology, and infectious diseases. The focus on translational medicine, personalized treatments, and novel drug formulation approaches further entrenches the position of academic and government institutions in pharmacokinetics research.
The biotechnology & pharmaceutical companies segment is anticipated to see the fastest growth during the forecast period due to the increasing number of clinical trials, growth of biologics and biosimilars, and growing investments in drug development. As there is increased pressure to hasten drug pipelines and maximize therapeutic effectiveness, the pharma and biotech industries are significantly investing in sophisticated pharmacokinetic modeling, high-throughput screening, and artificial intelligence data analytics for improving drug ADME studies. Also, the growth of CROs and outsourcing alliances enables the companies to rationalize operations and concentrate on paradigm-shifting innovation. With precision medicine and targeted therapies gaining momentum, the demand for sound pharmacokinetic assessments is increasingly becoming imperative to ensure that biotech and pharmaceutical companies are ahead of the curve in market development.
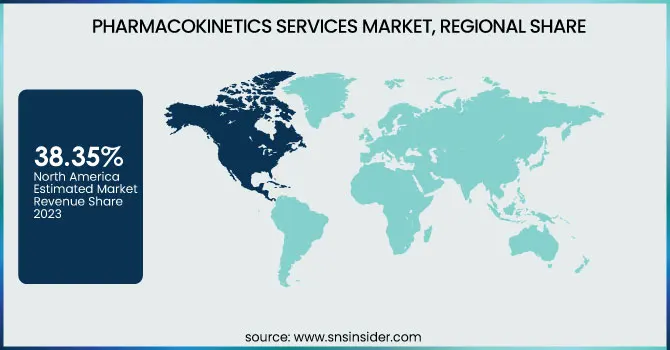
North America dominated the pharmacokinetics services market with 38.35% market share in 2023 due to its robust pharmaceutical and biotechnology sector, established clinical research infrastructure, and regulatory-friendly climate. North America holds a major portion of the world's drug development and clinical trials, with the U.S. FDA approving 55 new drugs in 2023, most needing extensive pharmacokinetics (PK) studies. Leading contract research organizations (CROs) like Charles River Laboratories, Labcorp, and ICON plc have a solid foothold in North America with end-to-end PK testing offerings. In addition, government drives such as the 21st Century Cures Act and growth in funding for biologics, gene therapies, and precision medicine have created a growing need for sophisticated PK studies. The high R&D spending of the region, which was more than $100 billion in 2023, combined with the increasing use of AI-based PK modeling, further consolidates North America's dominance in this market.
Asia Pacific is experiencing the fastest growth in the pharmacokinetics services market, with 8.84% CAGR throughout the forecast period, fueled by fast growth in clinical trials, cost benefits, and increasing drug discovery investments. China, India, and South Korea are becoming key locations for preclinical and clinical pharmacokinetics research, providing a cost-effective alternative to Western markets. WuXi AppTec in China and Syngene International in India have greatly diversified their bioanalytical and PK service offerings, serving both domestic and international pharmaceutical companies. The regulatory environment of the region is also changing, with India's CDSCO and China National Medical Products Administration (NMPA) facilitating streamlined drug approvals, thus facilitating the conduct of PK studies for foreign companies.
Get Customized Report as per Your Business Requirement - Enquiry Now
Charles River Laboratories (Preclinical PK Studies, Drug Metabolism & Pharmacokinetics Services)
Labcorp Drug Development (Pharmacokinetics Testing, Clinical PK Studies)
Covance (Bioanalytical Services, Early Clinical Services)
WuXi AppTec (Pharmacokinetic Studies, Bioanalytical Testing Services)
PRA Health Sciences (Pharmacokinetic Analysis, Drug Metabolism Studies)
Syneos Health (Clinical Pharmacokinetics, PK/PD Modeling)
Quotient Sciences (Pharmacokinetic Studies, Clinical Trials)
Medpace (Pharmacokinetics Services, Clinical Pharmacology)
Pharmaron (PK/PD Modeling & Simulation, Preclinical Pharmacokinetics)
KCR (Clinical PK Analysis, Preclinical Drug Testing)
Celerion (Clinical Pharmacokinetics Services, Bioanalytical Testing)
ICON plc (PK Study Design, Clinical Pharmacokinetic Services)
Eurofins Scientific (Pharmacokinetics Studies, Analytical Services)
Toxikon (Pharmacokinetic Testing, Drug Development Services)
Roche (Pharmacokinetics Modeling, Drug Metabolism Testing)
Boehringer Ingelheim (Pharmacokinetics Services, Preclinical Research)
Pharmalex (Clinical Pharmacokinetic Services, Preclinical Pharmacokinetic Studies)
Accelsiors (Pharmacokinetics Services, PK/PD Modeling)
XenoTech, LLC (In-vitro Pharmacokinetic Services, Metabolism & Transport Studies)
Bioreliance (Pharmacokinetics Testing, Drug Development Services)
Suppliers (These suppliers provide the necessary equipment, reagents, and services to support pharmacokinetics testing and services across the market.)
Thermo Fisher Scientific
Sigma-Aldrich (Merck KGaA)
Waters Corporation
Agilent Technologies
Sciex
PerkinElmer
Bio-Rad Laboratories
GE Healthcare
Shimadzu Corporation
Bruker Corporation
In December 2024, Syneos Health, a leading fully integrated biopharmaceutical solutions company, launched its 2025 Health Trends Report, Reimagining What's Possible. The report identifies the revolutionizing power of merging data, technology, and empathy in healthcare, from rare disease research to genetic medicine that can transform patient care and outcomes. It also delves into how filling gaps in care and redefining healthcare models can result in more accurate, individualized, and comprehensive approaches.
In May 2023, WuXi AppTec broadened its Drug Metabolism and Pharmacokinetics (DMPK) services with the opening of a new R&D center in Nantong, China. The center will specialize in large animal pharmacokinetic studies and non-GLP bioanalytical research services.
| Report Attributes | Details |
|---|---|
| Market Size in 2023 | US$ 1.19 billion |
| Market Size by 2032 | US$ 2.36 Billion |
| CAGR | CAGR of 7.70% From 2024 to 2032 |
| Base Year | 2023 |
| Forecast Period | 2024-2032 |
| Historical Data | 2020-2022 |
| Report Scope & Coverage | Market Size, Segments Analysis, Competitive Landscape, Regional Analysis, DROC & SWOT Analysis, Forecast Outlook |
| Key Segments | • By Drug Type (Small Molecules, Large Molecules) • By Application (Small & Medium Enterprise, Large Enterprise) • By End Use (Biotechnology & Pharmaceutical Companies, Academic & Government Research Institutes, Others) |
| Regional Analysis/Coverage | North America (US, Canada, Mexico), Europe (Eastern Europe [Poland, Romania, Hungary, Turkey, Rest of Eastern Europe] Western Europe] Germany, France, UK, Italy, Spain, Netherlands, Switzerland, Austria, Rest of Western Europe]), Asia Pacific (China, India, Japan, South Korea, Vietnam, Singapore, Australia, Rest of Asia Pacific), Middle East & Africa (Middle East [UAE, Egypt, Saudi Arabia, Qatar, Rest of Middle East], Africa [Nigeria, South Africa, Rest of Africa], Latin America (Brazil, Argentina, Colombia, Rest of Latin America) |
| Company Profiles | Charles River Laboratories, Labcorp Drug Development, Covance, WuXi AppTec, PRA Health Sciences, Syneos Health, Quotient Sciences, Medpace, Pharmaron, KCR, Celerion, ICON plc, Eurofins Scientific, Toxikon, Roche, Boehringer Ingelheim, Pharmalex, Accelsiors, XenoTech, LLC, Bioreliance, and other players. |
Ans: The Pharmacokinetics Services Market is expected to grow at a CAGR of 7.70% from 2024-2032.
Ans: The Pharmacokinetics Services Market was USD 1.19 billion in 2023 and is expected to reach USD 2.32 billion by 2032.
Ans: The shift toward biologics and personalized medicine is significantly impacting the pharmacokinetics services market.
Ans: The “Small & medium enterprise” segment dominated the Pharmacokinetics Services Market.
Ans: North America dominated the Pharmacokinetics Services Market in 2023
Table of Contents:
1. Introduction
1.1 Market Definition
1.2 Scope (Inclusion and Exclusions)
1.3 Research Assumptions
2. Executive Summary
2.1 Market Overview
2.2 Regional Synopsis
2.3 Competitive Summary
3. Research Methodology
3.1 Top-Down Approach
3.2 Bottom-up Approach
3.3. Data Validation
3.4 Primary Interviews
4. Market Dynamics Impact Analysis
4.1 Market Driving Factors Analysis
4.1.1 Drivers
4.1.2 Restraints
4.1.3 Opportunities
4.1.4 Challenges
4.2 PESTLE Analysis
4.3 Porter’s Five Forces Model
5. Statistical Insights and Trends Reporting
5.1 Incidence and Prevalence (2023)
5.2 Market Adoption by Industry Segment (2023)
5.3 Drug Development and Clinical Trials Trends (2020-2032)
5.4 Healthcare Spending by Region (2023)
6. Competitive Landscape
6.1 List of Major Companies, By Region
6.2 Market Share Analysis, By Region
6.3 Product Benchmarking
6.3.1 Product specifications and features
6.3.2 Pricing
6.4 Strategic Initiatives
6.4.1 Marketing and promotional activities
6.4.2 Distribution and Supply Chain Strategies
6.4.3 Expansion plans and new product launches
6.4.4 Strategic partnerships and collaborations
6.5 Technological Advancements
6.6 Market Positioning and Branding
7. Pharmacokinetics Services Market Segmentation by Drug Type
7.1 Chapter Overview
7.2 Small molecules
7.2.1 Small Molecules Market Trends Analysis (2020-2032)
7.2.2 Small Molecules Market Size Estimates and Forecasts to 2032 (USD Billion)
7.3 Large molecules (biopharmaceuticals)
7.3.1 Large Molecules (biopharmaceuticals) Market Trends Analysis (2020-2032)
7.3.2 Large molecules (biopharmaceuticals) Market Size Estimates and Forecasts to 2032 (USD Billion)
8. Pharmacokinetics Services Market Segmentation by Application
8.1 Chapter Overview
8.2 Small & medium enterprise
8.2.1 Small & Medium Enterprise Market Trends Analysis (2020-2032)
8.2.2 Small & Medium Enterprise Market Size Estimates and Forecasts to 2032 (USD Billion)
8.3 Large enterprise
8.3.1 Large Enterprise Market Trends Analysis (2020-2032)
8.3.2 Large Enterprise Market Size Estimates and Forecasts to 2032 (USD Billion)
9. Pharmacokinetics Services Market Segmentation by End User
9.1 Chapter Overview
9.2 Biotechnology & pharmaceutical companies
9.2.1 Biotechnology & Pharmaceutical Companies Market Trends Analysis (2020-2032)
9.2.2 Biotechnology & Pharmaceutical Companies Market Size Estimates and Forecasts to 2032 (USD Billion)
9.3 Academic & Government Research Institutes
9.3.1 Academic & Government Research Institutes Market Trends Analysis (2020-2032)
9.3.2 Academic & Government Research Institutes Market Size Estimates and Forecasts to 2032 (USD Billion)
9.4 Others
9.4.1 Others Market Trends Analysis (2020-2032)
9.4.2 Others Market Size Estimates and Forecasts to 2032 (USD Billion)
10. Regional Analysis
10.1 Chapter Overview
10.2 North America
10.2.1 Trends Analysis
10.2.2 North America Pharmacokinetics Services Market Estimates and Forecasts by Country (2020-2032) (USD Billion)
10.2.3 North America Pharmacokinetics Services Market Estimates and Forecasts by Drug Type (2020-2032) (USD Billion)
10.2.4 North America Pharmacokinetics Services Market Estimates and Forecasts by Application (2020-2032) (USD Billion)
10.2.5 North America Pharmacokinetics Services Market Estimates and Forecasts by End User (2020-2032) (USD Billion)
10.2.6 USA
10.2.6.1 USA Pharmacokinetics Services Market Estimates and Forecasts by Drug Type (2020-2032) (USD Billion)
10.2.6.2 USA Pharmacokinetics Services Market Estimates and Forecasts, by Application (2020-2032) (USD Billion)
10.2.6.3 USA Pharmacokinetics Services Market Estimates and Forecasts by End User (2020-2032) (USD Billion)
10.2.7 Canada
10.2.7.1 Canada Pharmacokinetics Services Market Estimates and Forecasts by Drug Type (2020-2032) (USD Billion)
10.2.7.2 Canada Pharmacokinetics Services Market Estimates and Forecasts, by Application (2020-2032) (USD Billion)
10.2.7.3 Canada Pharmacokinetics Services Market Estimates and Forecasts by End User (2020-2032) (USD Billion)
10.2.8 Mexico
10.2.8.1 Mexico Pharmacokinetics Services Market Estimates and Forecasts by Drug Type (2020-2032) (USD Billion)
10.2.8.2 Mexico Pharmacokinetics Services Market Estimates and Forecasts, by Application (2020-2032) (USD Billion)
10.2.8.3 Mexico Pharmacokinetics Services Market Estimates and Forecasts by End User (2020-2032) (USD Billion)
10.3 Europe
10.3.1 Eastern Europe
10.3.1.1 Trends Analysis
10.3.1.2 Eastern Europe Pharmacokinetics Services Market Estimates and Forecasts by Country (2020-2032) (USD Billion)
10.3.1.3 Eastern Europe Pharmacokinetics Services Market Estimates and Forecasts by Drug Type (2020-2032) (USD Billion)
10.3.1.4 Eastern Europe Pharmacokinetics Services Market Estimates and Forecasts, by Application (2020-2032) (USD Billion)
10.3.1.5 Eastern Europe Pharmacokinetics Services Market Estimates and Forecasts by End User (2020-2032) (USD Billion)
10.3.1.6 Poland
10.3.1.6.1 Poland Pharmacokinetics Services Market Estimates and Forecasts by Drug Type (2020-2032) (USD Billion)
10.3.1.6.2 Poland Pharmacokinetics Services Market Estimates and Forecasts, by Application (2020-2032) (USD Billion)
10.3.1.6.3 Poland Pharmacokinetics Services Market Estimates and Forecasts by End User (2020-2032) (USD Billion)
10.3.1.7 Romania
10.3.1.7.1 Romania Pharmacokinetics Services Market Estimates and Forecasts by Drug Type (2020-2032) (USD Billion)
10.3.1.7.2 Romania Pharmacokinetics Services Market Estimates and Forecasts, by Application (2020-2032) (USD Billion)
10.3.1.7.3 Romania Pharmacokinetics Services Market Estimates and Forecasts by End User (2020-2032) (USD Billion)
10.3.1.8 Hungary
10.3.1.8.1 Hungary Pharmacokinetics Services Market Estimates and Forecasts by Drug Type (2020-2032) (USD Billion)
10.3.1.8.2 Hungary Pharmacokinetics Services Market Estimates and Forecasts, by Application (2020-2032) (USD Billion)
10.3.1.8.3 Hungary Pharmacokinetics Services Market Estimates and Forecasts by End User (2020-2032) (USD Billion)
10.3.1.9 turkey
10.3.1.9.1 Turkey Pharmacokinetics Services Market Estimates and Forecasts by Drug Type (2020-2032) (USD Billion)
10.3.1.9.2 Turkey Pharmacokinetics Services Market Estimates and Forecasts, by Application (2020-2032) (USD Billion)
10.3.1.9.3 Turkey Pharmacokinetics Services Market Estimates and Forecasts by End User (2020-2032) (USD Billion)
10.3.1.10 Rest of Eastern Europe
10.3.1.10.1 Rest of Eastern Europe Pharmacokinetics Services Market Estimates and Forecasts by Drug Type (2020-2032) (USD Billion)
10.3.1.10.2 Rest of Eastern Europe Pharmacokinetics Services Market Estimates and Forecasts, by Application (2020-2032) (USD Billion)
10.3.1.10.3 Rest of Eastern Europe Pharmacokinetics Services Market Estimates and Forecasts by End User (2020-2032) (USD Billion)
10.3.2 Western Europe
10.3.2.1 Trends Analysis
10.3.2.2 Western Europe Pharmacokinetics Services Market Estimates and Forecasts by Country (2020-2032) (USD Billion)
10.3.2.3 Western Europe Pharmacokinetics Services Market Estimates and Forecasts by Drug Type (2020-2032) (USD Billion)
10.3.2.4 Western Europe Pharmacokinetics Services Market Estimates and Forecasts, by Application (2020-2032) (USD Billion)
10.3.2.5 Western Europe Pharmacokinetics Services Market Estimates and Forecasts by End User (2020-2032) (USD Billion)
10.3.2.6 Germany
10.3.2.6.1 Germany Pharmacokinetics Services Market Estimates and Forecasts by Drug Type (2020-2032) (USD Billion)
10.3.2.6.2 Germany Pharmacokinetics Services Market Estimates and Forecasts, by Application (2020-2032) (USD Billion)
10.3.2.6.3 Germany Pharmacokinetics Services Market Estimates and Forecasts by End User (2020-2032) (USD Billion)
10.3.2.7 France
10.3.2.7.1 France Pharmacokinetics Services Market Estimates and Forecasts by Drug Type (2020-2032) (USD Billion)
10.3.2.7.2 France Pharmacokinetics Services Market Estimates and Forecasts, by Application (2020-2032) (USD Billion)
10.3.2.7.3 France Pharmacokinetics Services Market Estimates and Forecasts by End User (2020-2032) (USD Billion)
10.3.2.8 UK
10.3.2.8.1 UK Pharmacokinetics Services Market Estimates and Forecasts by Drug Type (2020-2032) (USD Billion)
10.3.2.8.2 UK Pharmacokinetics Services Market Estimates and Forecasts, by Application (2020-2032) (USD Billion)
10.3.2.8.3 UK Pharmacokinetics Services Market Estimates and Forecasts by End User (2020-2032) (USD Billion)
10.3.2.9 Italy
10.3.2.9.1 Italy Pharmacokinetics Services Market Estimates and Forecasts by Drug Type (2020-2032) (USD Billion)
10.3.2.9.2 Italy Pharmacokinetics Services Market Estimates and Forecasts, by Application (2020-2032) (USD Billion)
10.3.2.9.3 Italy Pharmacokinetics Services Market Estimates and Forecasts by End User (2020-2032) (USD Billion)
10.3.2.10 Spain
10.3.2.10.1 Spain Pharmacokinetics Services Market Estimates and Forecasts by Drug Type (2020-2032) (USD Billion)
10.3.2.10.2 Spain Pharmacokinetics Services Market Estimates and Forecasts, by Application (2020-2032) (USD Billion)
10.3.2.10.3 Spain Pharmacokinetics Services Market Estimates and Forecasts by End User (2020-2032) (USD Billion)
10.3.2.11 Netherlands
10.3.2.11.1 Netherlands Pharmacokinetics Services Market Estimates and Forecasts by Drug Type (2020-2032) (USD Billion)
10.3.2.11.2 Netherlands Pharmacokinetics Services Market Estimates and Forecasts, by Application (2020-2032) (USD Billion)
10.3.2.11.3 Netherlands Pharmacokinetics Services Market Estimates and Forecasts by End User (2020-2032) (USD Billion)
10.3.2.12 Switzerland
10.3.2.12.1 Switzerland Pharmacokinetics Services Market Estimates and Forecasts by Drug Type (2020-2032) (USD Billion)
10.3.2.12.2 Switzerland Pharmacokinetics Services Market Estimates and Forecasts, by Application (2020-2032) (USD Billion)
10.3.2.12.3 Switzerland Pharmacokinetics Services Market Estimates and Forecasts by End User (2020-2032) (USD Billion)
10.3.2.13 Austria
10.3.2.13.1 Austria Pharmacokinetics Services Market Estimates and Forecasts by Drug Type (2020-2032) (USD Billion)
10.3.2.13.2 Austria Pharmacokinetics Services Market Estimates and Forecasts, by Application (2020-2032) (USD Billion)
10.3.2.13.3 Austria Pharmacokinetics Services Market Estimates and Forecasts by End User (2020-2032) (USD Billion)
10.3.2.14 Rest of Western Europe
10.3.2.14.1 Rest of Western Europe Pharmacokinetics Services Market Estimates and Forecasts by Drug Type (2020-2032) (USD Billion)
10.3.2.14.2 Rest of Western Europe Pharmacokinetics Services Market Estimates and Forecasts, by Application (2020-2032) (USD Billion)
10.3.2.14.3 Rest of Western Europe Pharmacokinetics Services Market Estimates and Forecasts by End User (2020-2032) (USD Billion)
10.4 Asia Pacific
10.4.1 Trends Analysis
10.4.2 Asia Pacific Pharmacokinetics Services Market Estimates and Forecasts by Country (2020-2032) (USD Billion)
10.4.3 Asia Pacific Pharmacokinetics Services Market Estimates and Forecasts by Drug Type (2020-2032) (USD Billion)
10.4.4 Asia Pacific Pharmacokinetics Services Market Estimates and Forecasts by Application (2020-2032) (USD Billion)
10.4.5 Asia Pacific Pharmacokinetics Services Market Estimates and Forecasts by End User (2020-2032) (USD Billion)
10.4.6 China
10.4.6.1 China Pharmacokinetics Services Market Estimates and Forecasts by Drug Type (2020-2032) (USD Billion)
10.4.6.2 China Pharmacokinetics Services Market Estimates and Forecasts by Application (2020-2032) (USD Billion)
10.4.6.3 China Pharmacokinetics Services Market Estimates and Forecasts by End User (2020-2032) (USD Billion)
10.4.7 India
10.4.7.1 India Pharmacokinetics Services Market Estimates and Forecasts by Drug Type (2020-2032) (USD Billion)
10.4.7.2 India Pharmacokinetics Services Market Estimates and Forecasts, by Application (2020-2032) (USD Billion)
10.4.7.3 India Pharmacokinetics Services Market Estimates and Forecasts by End User (2020-2032) (USD Billion)
10.4.8 japan
10.4.8.1 Japan Pharmacokinetics Services Market Estimates and Forecasts by Drug Type (2020-2032) (USD Billion)
10.4.8.2 Japan Pharmacokinetics Services Market Estimates and Forecasts, by Application (2020-2032) (USD Billion)
10.4.8.3 Japan Pharmacokinetics Services Market Estimates and Forecasts by End User (2020-2032) (USD Billion)
10.4.9 South Korea
10.4.9.1 South Korea Pharmacokinetics Services Market Estimates and Forecasts by Drug Type (2020-2032) (USD Billion)
10.4.9.2 South Korea Pharmacokinetics Services Market Estimates and Forecasts, by Application (2020-2032) (USD Billion)
10.4.9.3 South Korea Pharmacokinetics Services Market Estimates and Forecasts by End User (2020-2032) (USD Billion)
10.4.10 Vietnam
10.4.10.1 Vietnam Pharmacokinetics Services Market Estimates and Forecasts by Drug Type (2020-2032) (USD Billion)
10.4.10.2 Vietnam Pharmacokinetics Services Market Estimates and Forecasts by Application (2020-2032) (USD Billion)
10.4.10.3 Vietnam Pharmacokinetics Services Market Estimates and Forecasts by End User (2020-2032) (USD Billion)
10.4.11 Singapore
10.4.11.1 Singapore Pharmacokinetics Services Market Estimates and Forecasts by Drug Type (2020-2032) (USD Billion)
10.4.11.2 Singapore Pharmacokinetics Services Market Estimates and Forecasts, by Application (2020-2032) (USD Billion)
10.4.11.3 Singapore Pharmacokinetics Services Market Estimates and Forecasts by End User (2020-2032) (USD Billion)
10.4.12 Australia
10.4.12.1 Australia Pharmacokinetics Services Market Estimates and Forecasts by Drug Type (2020-2032) (USD Billion)
10.4.12.2 Australia Pharmacokinetics Services Market Estimates and Forecasts, by Application (2020-2032) (USD Billion)
10.4.12.3 Australia Pharmacokinetics Services Market Estimates and Forecasts by End User (2020-2032) (USD Billion)
10.4.13 Rest of Asia Pacific
10.4.13.1 Rest of Asia Pacific Pharmacokinetics Services Market Estimates and Forecasts by Drug Type (2020-2032) (USD Billion)
10.4.13.2 Rest of Asia Pacific Pharmacokinetics Services Market Estimates and Forecasts, by Application (2020-2032) (USD Billion)
10.4.13.3 Rest of Asia Pacific Pharmacokinetics Services Market Estimates and Forecasts, by End User (2020-2032) (USD Billion)
10.5 Middle East and Africa
10.5.1 Middle East
10.5.1.1 Trends Analysis
10.5.1.2 Middle East Pharmacokinetics Services Market Estimates and Forecasts, by Country (2020-2032) (USD Billion)
10.5.1.3 Middle East Pharmacokinetics Services Market Estimates and Forecasts, by Drug Type (2020-2032) (USD Billion)
10.5.1.4 Middle East Pharmacokinetics Services Market Estimates and Forecasts, by Application (2020-2032) (USD Billion)
10.5.1.5 Middle East Pharmacokinetics Services Market Estimates and Forecasts, by End User (2020-2032) (USD Billion)
10.5.1.6 UAE
10.5.1.6.1 UAE Pharmacokinetics Services Market Estimates and Forecasts, by Drug Type (2020-2032) (USD Billion)
10.5.1.6.2 UAE Pharmacokinetics Services Market Estimates and Forecasts, by Application (2020-2032) (USD Billion)
10.5.1.6.3 UAE Pharmacokinetics Services Market Estimates and Forecasts, by End User (2020-2032) (USD Billion)
10.5.1.7 Egypt
10.5.1.7.1 Egypt Pharmacokinetics Services Market Estimates and Forecasts, by Drug Type (2020-2032) (USD Billion)
10.5.1.7.2 Egypt Pharmacokinetics Services Market Estimates and Forecasts, by Application (2020-2032) (USD Billion)
10.5.1.7.3 Egypt Pharmacokinetics Services Market Estimates and Forecasts, by End User (2020-2032) (USD Billion)
10.5.1.8 Saudi Arabia
10.5.1.8.1 Saudi Arabia Pharmacokinetics Services Market Estimates and Forecasts, by Drug Type (2020-2032) (USD Billion)
10.5.1.8.2 Saudi Arabia Pharmacokinetics Services Market Estimates and Forecasts, by Application (2020-2032) (USD Billion)
10.5.1.8.3 Saudi Arabia Pharmacokinetics Services Market Estimates and Forecasts, by End User (2020-2032) (USD Billion)
10.5.1.9 Qatar
10.5.1.9.1 Qatar Pharmacokinetics Services Market Estimates and Forecasts, by Drug Type (2020-2032) (USD Billion)
10.5.1.9.2 Qatar Pharmacokinetics Services Market Estimates and Forecasts, by Application (2020-2032) (USD Billion)
10.5.1.9.3 Qatar Pharmacokinetics Services Market Estimates and Forecasts, by End User (2020-2032) (USD Billion)
10.5.1.10 Rest of Middle East
10.5.1.10.1 Rest of Middle East Pharmacokinetics Services Market Estimates and Forecasts, by Drug Type (2020-2032) (USD Billion)
10.5.1.10.2 Rest of Middle East Pharmacokinetics Services Market Estimates and Forecasts, by Application (2020-2032) (USD Billion)
10.5.1.10.3 Rest of Middle East Pharmacokinetics Services Market Estimates and Forecasts, by End User (2020-2032) (USD Billion)
10.5.2 Africa
10.5.2.1 Trends Analysis
10.5.2.2 Africa Pharmacokinetics Services Market Estimates and Forecasts, by Country (2020-2032) (USD Billion)
10.5.2.3 Africa Pharmacokinetics Services Market Estimates and Forecasts, by Drug Type (2020-2032) (USD Billion)
10.5.2.4 Africa Pharmacokinetics Services Market Estimates and Forecasts, by Application (2020-2032) (USD Billion)
10.5.2.5 Africa Pharmacokinetics Services Market Estimates and Forecasts, by End User (2020-2032) (USD Billion)
10.5.2.6 South Africa
10.5.2.6.1 South Africa Pharmacokinetics Services Market Estimates and Forecasts, by Drug Type (2020-2032) (USD Billion)
10.5.2.6.2 South Africa Pharmacokinetics Services Market Estimates and Forecasts, by Application (2020-2032) (USD Billion)
10.5.2.6.3 South Africa Pharmacokinetics Services Market Estimates and Forecasts, by End User (2020-2032) (USD Billion)
10.5.2.7 Nigeria
10.5.2.7.1 Nigeria Pharmacokinetics Services Market Estimates and Forecasts, by Drug Type (2020-2032) (USD Billion)
10.5.2.7.2 Nigeria Pharmacokinetics Services Market Estimates and Forecasts, by Application (2020-2032) (USD Billion)
10.5.2.7.3 Nigeria Pharmacokinetics Services Market Estimates and Forecasts, by End User (2020-2032) (USD Billion)
10.5.2.8 Rest of Africa
10.5.2.8.1 Rest of Africa Pharmacokinetics Services Market Estimates and Forecasts, by Drug Type (2020-2032) (USD Billion)
10.5.2.8.2 Rest of Africa Pharmacokinetics Services Market Estimates and Forecasts, by Application (2020-2032) (USD Billion)
10.5.2.8.3 Rest of Africa Pharmacokinetics Services Market Estimates and Forecasts, by End User (2020-2032) (USD Billion)
10.6 Latin America
10.6.1 Trends Analysis
10.6.2 Latin America Pharmacokinetics Services Market Estimates and Forecasts, by Country (2020-2032) (USD Billion)
10.6.3 Latin America Pharmacokinetics Services Market Estimates and Forecasts, by Drug Type (2020-2032) (USD Billion)
10.6.4 Latin America Pharmacokinetics Services Market Estimates and Forecasts, by Application (2020-2032) (USD Billion)
10.6.5 Latin America Pharmacokinetics Services Market Estimates and Forecasts, by End User (2020-2032) (USD Billion)
10.6.6 Brazil
10.6.6.1 Brazil Pharmacokinetics Services Market Estimates and Forecasts, by Drug Type (2020-2032) (USD Billion)
10.6.6.2 Brazil Pharmacokinetics Services Market Estimates and Forecasts, by Application (2020-2032) (USD Billion)
10.6.6.3 Brazil Pharmacokinetics Services Market Estimates and Forecasts, by End User (2020-2032) (USD Billion)
10.6.7 Argentina
10.6.7.1 Argentina Pharmacokinetics Services Market Estimates and Forecasts, by Drug Type (2020-2032) (USD Billion)
10.6.7.2 Argentina Pharmacokinetics Services Market Estimates and Forecasts, by Application (2020-2032) (USD Billion)
10.6.7.3 Argentina Pharmacokinetics Services Market Estimates and Forecasts, by End User (2020-2032) (USD Billion)
10.6.8 Colombia
10.6.8.1 Colombia Pharmacokinetics Services Market Estimates and Forecasts, by Drug Type (2020-2032) (USD Billion)
10.6.8.2 Colombia Pharmacokinetics Services Market Estimates and Forecasts, by Application (2020-2032) (USD Billion)
10.6.8.3 Colombia Pharmacokinetics Services Market Estimates and Forecasts, by End User (2020-2032) (USD Billion)
10.6.9 Rest of Latin America
10.6.9.1 Rest of Latin America Pharmacokinetics Services Market Estimates and Forecasts, by Drug Type (2020-2032) (USD Billion)
10.6.9.2 Rest of Latin America Pharmacokinetics Services Market Estimates and Forecasts, by Application (2020-2032) (USD Billion)
10.6.9.3 Rest of Latin America Pharmacokinetics Services Market Estimates and Forecasts, by End User (2020-2032) (USD Billion)
11. Company Profiles
11.1 Charles River Laboratories
11.1.1 Company Overview
11.1.2 Financial
11.1.3 Products/ Services Offered
11.1.4 SWOT Analysis
11.2 Labcorp Drug Development
11.2.1 Company Overview
11.2.2 Financial
11.2.3 Products/ Services Offered
11.2.4 SWOT Analysis
11.3 Covance
11.3.1 Company Overview
11.3.2 Financial
11.3.3 Products/ Services Offered
11.3.4 SWOT Analysis
11.4 WuXi AppTec
11.4.1 Company Overview
11.4.2 Financial
11.4.3 Products/ Services Offered
11.4.4 SWOT Analysis
11.5 PRA Health Sciences
11.5.1 Company Overview
11.5.2 Financial
11.5.3 Products/ Services Offered
11.5.4 SWOT Analysis
11.6 Syneos Health
11.6.1 Company Overview
11.6.2 Financial
11.6.3 Products/ Services Offered
11.6.4 SWOT Analysis
11.7 Quotient Sciences
11.7.1 Company Overview
11.7.2 Financial
11.7.3 Products/ Services Offered
11.7.4 SWOT Analysis
11.8 Medpace
11.8.1 Company Overview
11.8.2 Financial
11.8.3 Products/ Services Offered
11.8.4 SWOT Analysis
11.9 KCR
11.9.1 Company Overview
11.9.2 Financial
11.9.3 Products/ Services Offered
11.9.4 SWOT Analysis
11.10 Celerion
11.10.1 Company Overview
11.10.2 Financial
11.10.3 Products/ Services Offered
11.10.4 SWOT Analysis
12. Use Cases and Best Practices
13. Conclusion
An accurate research report requires proper strategizing as well as implementation. There are multiple factors involved in the completion of good and accurate research report and selecting the best methodology to compete the research is the toughest part. Since the research reports we provide play a crucial role in any company’s decision-making process, therefore we at SNS Insider always believe that we should choose the best method which gives us results closer to reality. This allows us to reach at a stage wherein we can provide our clients best and accurate investment to output ratio.
Each report that we prepare takes a timeframe of 350-400 business hours for production. Starting from the selection of titles through a couple of in-depth brain storming session to the final QC process before uploading our titles on our website we dedicate around 350 working hours. The titles are selected based on their current market cap and the foreseen CAGR and growth.
The 5 steps process:
Step 1: Secondary Research:
Secondary Research or Desk Research is as the name suggests is a research process wherein, we collect data through the readily available information. In this process we use various paid and unpaid databases which our team has access to and gather data through the same. This includes examining of listed companies’ annual reports, Journals, SEC filling etc. Apart from this our team has access to various associations across the globe across different industries. Lastly, we have exchange relationships with various university as well as individual libraries.

Step 2: Primary Research
When we talk about primary research, it is a type of study in which the researchers collect relevant data samples directly, rather than relying on previously collected data. This type of research is focused on gaining content specific facts that can be sued to solve specific problems. Since the collected data is fresh and first hand therefore it makes the study more accurate and genuine.
We at SNS Insider have divided Primary Research into 2 parts.
Part 1 wherein we interview the KOLs of major players as well as the upcoming ones across various geographic regions. This allows us to have their view over the market scenario and acts as an important tool to come closer to the accurate market numbers. As many as 45 paid and unpaid primary interviews are taken from both the demand and supply side of the industry to make sure we land at an accurate judgement and analysis of the market.
This step involves the triangulation of data wherein our team analyses the interview transcripts, online survey responses and observation of on filed participants. The below mentioned chart should give a better understanding of the part 1 of the primary interview.

Part 2: In this part of primary research the data collected via secondary research and the part 1 of the primary research is validated with the interviews from individual consultants and subject matter experts.
Consultants are those set of people who have at least 12 years of experience and expertise within the industry whereas Subject Matter Experts are those with at least 15 years of experience behind their back within the same space. The data with the help of two main processes i.e., FGDs (Focused Group Discussions) and IDs (Individual Discussions). This gives us a 3rd party nonbiased primary view of the market scenario making it a more dependable one while collation of the data pointers.
Step 3: Data Bank Validation
Once all the information is collected via primary and secondary sources, we run that information for data validation. At our intelligence centre our research heads track a lot of information related to the market which includes the quarterly reports, the daily stock prices, and other relevant information. Our data bank server gets updated every fortnight and that is how the information which we collected using our primary and secondary information is revalidated in real time.

Step 4: QA/QC Process
After all the data collection and validation our team does a final level of quality check and quality assurance to get rid of any unwanted or undesired mistakes. This might include but not limited to getting rid of the any typos, duplication of numbers or missing of any important information. The people involved in this process include technical content writers, research heads and graphics people. Once this process is completed the title gets uploader on our platform for our clients to read it.
Step 5: Final QC/QA Process:
This is the last process and comes when the client has ordered the study. In this process a final QA/QC is done before the study is emailed to the client. Since we believe in giving our clients a good experience of our research studies, therefore, to make sure that we do not lack at our end in any way humanly possible we do a final round of quality check and then dispatch the study to the client.
Key Market Segments:
By Drug Type
Small molecules
Large molecules (biopharmaceuticals)
By Application
Small & medium enterprise
Large enterprise
By End Use
Biotechnology & pharmaceutical companies
Academic & government research institutes
Others
Request for Segment Customization as per your Business Requirement: Segment Customization Request
Regional Coverage:
North America
US
Canada
Mexico
Europe
Eastern Europe
Poland
Romania
Hungary
Turkey
Rest of Eastern Europe
Western Europe
Germany
France
UK
Italy
Spain
Netherlands
Switzerland
Austria
Rest of Western Europe
Asia Pacific
China
India
Japan
South Korea
Vietnam
Singapore
Australia
Rest of Asia Pacific
Middle East & Africa
Middle East
UAE
Egypt
Saudi Arabia
Qatar
Rest of Middle East
Africa
Nigeria
South Africa
Rest of Africa
Latin America
Brazil
Argentina
Colombia
Rest of Latin America
Request for Country Level Research Report: Country Level Customization Request
Available Customization
With the given market data, SNS Insider offers customization as per the company’s specific needs. The following customization options are available for the report:
Detailed Volume Analysis
Criss-Cross segment analysis (e.g. Product X Application)
Competitive Product Benchmarking
Geographic Analysis
Additional countries in any of the regions
Customized Data Representation
Detailed analysis and profiling of additional market players
Medical Document Management Systems Market was valued at USD 0.63 Bn in 2023 and is expected to reach USD 1.81 Bn by 2032, growing at a CAGR of 12.48%.
The Smart Bandages Market was valued at USD 767.6 million in 2023 and is expected to reach USD 2111.5 million in 2032 and grow at a CAGR of 11.9% over the forecast period of 2024-2032.
The Dermal Fillers Market size was valued at USD 5.05 billion in 2023 and is expected to reach USD 10.26 billion by 2032 and grow at a CAGR of 8.2% by 2024-2032.
The Bleeding Disorders Treatment Market Size was USD 16.35 Bn in 2023 and is projected to reach USD 35.17 Bn by 2032, growing at 8.91% CAGR.
The MRNA Therapeutics Contract Development & Manufacturing Market Size was valued at USD 3.12 billion in 2023, expected to reach USD 8.09 billion by 2032, growing at an 11.18% CAGR.
The Cardiac Rhythm Management Devices Market was valued at USD 18.51 billion in 2023, projected to reach USD 32.35 billion by 2032, growing at a CAGR of 6.40%.

Hi! Click one of our member below to chat on Phone
© 2025 All Rights Reserved by SNS Insider Pvt Ltd


