Get more information on Pharmaceutical Gelatin Market - Request Sample Report
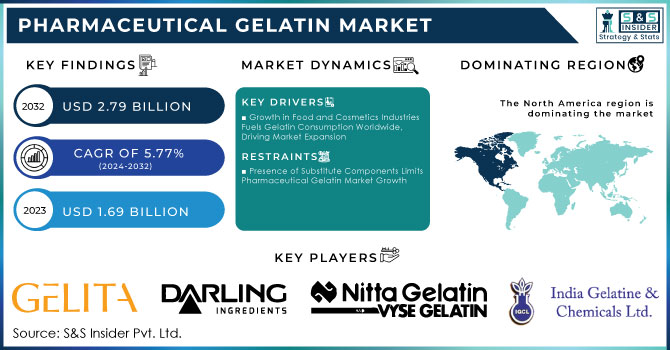
Pharmaceutical Gelatin Market was valued at USD 1.69 billion in 2023 and is expected to reach USD 2.79 billion by 2032, growing at a CAGR of 5.77% from 2024-2032.
The pharmaceutical gelatin market is witnessing substantial growth driven by rising demand for capsules and soft gels. In 2023, global research and development expenditures in the pharmaceutical sector are 300 billion U.S. dollars, indicating significant investment in drug formulations and delivery mechanisms. Consequently, with the spending on prescription medications increasing by 6.0% to 8.0% in 2023, the demand for pharmaceutical gelatin utilized for drug delivery will experience even greater growth. In 2023, it stood at 464,410 tons, establishing a robust foundation for continued growth in the years ahead.
The growing demand for plant-based diets has led to increased interest in gelatin, and pharmaceutical gelatin is no exception. This can be gauged from the fact that the vegan food market globally was valued at nearly USD 25 billion, with 70% of consumers considering plant-based protein healthier than others. Therefore, with pharmaceutical giants now directing their focus more toward vegan-friendly gelatin products, plant-based alternatives are likely to see an increased market share in the forthcoming years.
DRIVERS
Growth in Food and Cosmetics Industries Fuels Gelatin Consumption Worldwide, Driving Market Expansion
The food and cosmetic industries are fast-growing, which has raised tremendous demand for gelatin. In food production, gelatin is used mainly to create confectionery, dairy products, and desserts with the most desired textures in this bid. The rising global beauty market, where retail sales accounted for USD 446 billion in 2023 and had grown by 10%, also spurred interest in gelatin for use in skincare, haircare, and beauty formulations that provide hydrating and texturizing benefits. Aside from this, the international dairy trade is estimated to be at 84 million tonnes in 2023, thereby supporting gelatin demand since the former uses dairy. The gelatin market is further expected to grow shortly with expansion in these industries.
Rising Demand for Gelatin from Pharmaceutical and Nutraceutical Industries Drives Market Growth
The pharmaceutical and nutraceutical industries are now the new drivers of the increasing gelatin market. Gelatin has a broad application in the production of capsules and tablets and even other drug delivery systems, as it is a biocompatible, easily digestible product and stabilizes active ingredients. Moreover, in the nutraceutical sector, the usage of gelatin is witnessed in dietary supplements and functional foods mainly for its ability to enhance bioavailability and ensure product consistency. The demand for healthcare products is significantly increasing across the globe, with a particularly significant growing trend in regions that have an aging population. Therefore, application of gelatin-based solutions in pharmaceuticals and nutraceuticals will keep expanding in this market.
RESTRAINTS
Presence of Substitute Components Limits Pharmaceutical Gelatin Market Growth
The competitors in the pharmaceutical gelatin market also emerge through other materials, like hydroxypropyl methylcellulose (HPMC), pullulan, and starch-based capsules. Various plant-based alternatives that contribute to the production of vegan, vegetarian, and allergy-free products, which are most predominantly used in the nutraceutical and pharmaceutical industries, are in growing demand. Similarly, with higher demand from customers for products containing no animal-derived ingredients, increasing usage of these alternatives will cause a drag on the growth rate of the gelatin market, particularly in markets where vegans are extremely demanding or dietary restrictions are somewhat stricter. Synthetic and plant-based alternatives continue gaining prospects for further pressure on the gelatin market.
BY TYPE
Type B gelatin had the largest market share of approximately 63% by revenue in 2023. This is primarily because it enjoyed wide application in soft and hard capsules, besides being more favorable in specific applications due to stability and consistency in the pharmaceutical use of gelatin. Type B is considered a highly cost-effective gelatin product and is sourced from bovines.
Type A gelatin, sourced from porcine, is expected to witness growth at the highest CAGR of 6.39% during the period 2024-2032, driven by enhanced consumer preference for gelatin with higher gelling strength and its increasing application in emerging markets owing to its compatibility with a wide range of pharmaceutical formulations.
BY FUNCTION
The largest share in the Pharmaceutical Gelatin Market in 2023 was seen in stabilizing agents, accounting for around 47%. These agents play a critical role in providing structural stability and continuity to pharmaceutical products, particularly gelatin capsules and tablets. Stabilizing agents prevent gelatin from breaking, thereby providing shelf life, which is highly demanded by pharmaceutical manufacturing.
Gelling agents and functional additives will be the fastest-growing at a CAGR of 6.83% between 2024 and 2032. The advancements in gelatin, with increased strength in gelling, greater versatility in formulations, and the increasing trend of merging multiple functionalities into one product for more effective treatments, would form the basis of this growth.
BY APPLICATION
In 2023, hard capsules held the maximum revenue share at around 43% of the pharmaceutical gelatin market primarily due to widespread usage as part of encapsulating solid drugs, vitamins, and minerals. These are extremely versatile, inexpensive, and more easily scaled up in production, making them preferred for various pharmaceutical applications. The highest growth CAGR is expected to be 6.56% in soft capsules between 2024 and 2032. Growing demand for soft capsules in liquid and semi-liquid formulations will primarily help it stand out as the most demanded form during the forecast period. Soft capsules receive high appreciation due to their ability to enhance bioavailability and the stability of active ingredients, which has an application in nutraceuticals and complex drug delivery systems thereby boosting up.
BY SOURCE
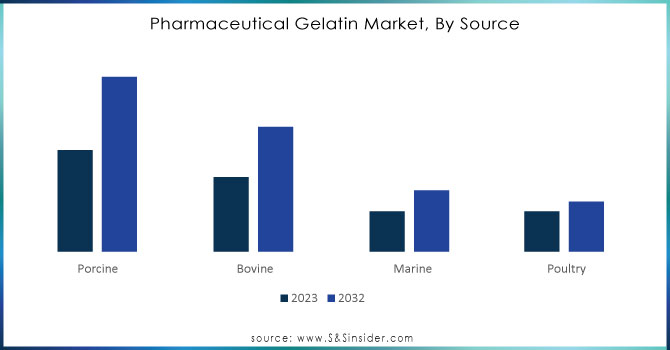
The 2023 market share for porcine gelatin was the largest in the pharmaceutical gelatin market and this goes to about 47% due to high availability, cost-effectiveness, and favorable gelling properties aligned to meet the divergent pharmaceutical needs. For these reasons, the main reasons include the fact that it has widely been utilized in capsules, tablets, and other medicinal products of porcine-derived gelatin.
Bovine gelatin is expected to grow at the highest CAGR of about 6.84% from 2024-2032. This is due to the growing demand from regions and applications where non-porcine sources are preferred for cultural, religious, and dietary reasons, thereby upgrading the appeal of bovine gelatin in the global market.
Need any customization research on Pharmaceutical Gelatin Market - Enquiry Now
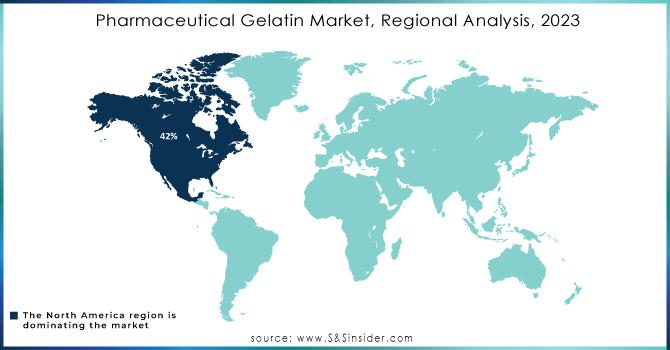
In 2023, North America dominated the pharmaceutical gelatin market with the highest revenue share at 42%. Its dominant market share can be ascribed to a large and well-established pharmaceutical industry in the region, high demand for advanced drug delivery systems, and sustained investments in the research and development stages. Additionally, the strong emphasis on quality standards and regulatory compliance in the region further increases the demand for pharmaceutical-grade gelatin, particularly as stabilizers in capsules and other medicinal formulations.
The Asia Pacific is poised to lead growth at a high CAGR of 7.31% in the forecast period 2024 to 2032. Growth in the region can be ascribed to increased healthcare spending, growing nutraceutical demand, and the burgeoning pharmaceutical manufacturing sector in developing economies such as China and India. Growing affordable healthcare solutions in the region present opportunities for gelatin-based products in all applications with the pharmaceutical end user, which drives growth in the market.
LATEST NEWS -
1] In 2024, Darling Ingredients launched Nextida™ GC collagen peptide as a bioactive health ingredient for pharmaceutical applications with controlled post-prandial glucose rise support.
2] Alsiano has collaborated with Trobas Gelatine BV in 2024 to build strength in gelatin supply for pharmaceuticals, nutraceuticals, and personal care across the Nordic markets.
KEY PLAYERS
Sterling Biotech Limited (Sterling Gelatin Capsules, Sterling Pharmaceutical Gelatin)
Gelita AG (Gelita Gelatin, Gelita Pharma Gelatin)
Darling Ingredients Inc. (Pharmaceutical Gelatin, Gelatin Capsules)
Nitta Gelatin Inc. (Nitta Gelatin Capsules, Nitta Pharmaceutical Gelatin)
India Gelatine & Chemicals (India Gelatin Capsules, Pharmaceutical Gelatin)
Tessenderlo Group (Tessenderlo Gelatin, Gelatin for Capsules)
PB Gelatins GmbH (PB Gelatin for Capsules, PB Pharmaceutical Gelatin)
Junca Gelatines S.L. (Junca Gelatin, Pharmaceutical Gelatin)
Trobas Gelatine BV (Trobas Gelatin Capsules, Pharmaceutical Gelatin)
Weishardt Holding SA (Weishardt Gelatin, Weishardt Pharma Gelatin)
Lapi Gelatine S.p.a. (Lapi Pharmaceutical Gelatin, Lapi Gelatin Capsules)
Italgel S.r.l (Italgel Pharmaceutical Gelatin, Italgel Gelatin Capsules)
Gelnex (Gelnex Gelatin, Gelnex Pharmaceutical Gelatin)
Rousselot (Rousselot Pharma Gelatin, Rousselot Gelatin Capsules)
Norland Products (Norland Gelatin, Norland Pharma Gelatin)
Collagen Solutions (Collagen Gelatin, Collagen Pharma Gelatin)
Qingdao Yuantong (Yuantong Pharmaceutical Gelatin, Yuantong Gelatin Capsules)
Shandong Tianli Pharmaceutical (Tianli Gelatin Capsules, Tianli Pharma Gelatin)
Haide Biochem (Haide Gelatin, Haide Pharmaceutical Gelatin)
KIMICA Corporation (KIMICA Pharmaceutical Gelatin, KimiGel Gelatin Capsules)
Report Attributes | Details |
---|---|
Market Size in 2023 | USD 1.69 Billion |
Market Size by 2032 | USD 2.79 Billion |
CAGR | CAGR of 5.77% From 2024 to 2032 |
Base Year | 2023 |
Forecast Period | 2024-2032 |
Historical Data | 2020-2022 |
Report Scope & Coverage | Market Size, Segments Analysis, Competitive Landscape, Regional Analysis, DROC & SWOT Analysis, Forecast Outlook |
Key Segments | • By Type (Type A, Type B) • By Product (Hard Capsules, Soft Capsules, Tablets, Absorbable Hemostats) • By Source (Porcine, Bovine, Marine, Poultry) • By Function (Stabilizing Agents, Thickening Agents, Gelling Agents & Other Functions) |
Regional Analysis/Coverage | North America (US, Canada, Mexico), Europe (Eastern Europe [Poland, Romania, Hungary, Turkey, Rest of Eastern Europe] Western Europe] Germany, France, UK, Italy, Spain, Netherlands, Switzerland, Austria, Rest of Western Europe]), Asia Pacific (China, India, Japan, South Korea, Vietnam, Singapore, Australia, Rest of Asia Pacific), Middle East & Africa (Middle East [UAE, Egypt, Saudi Arabia, Qatar, Rest of Middle East], Africa [Nigeria, South Africa, Rest of Africa], Latin America (Brazil, Argentina, Colombia, Rest of Latin America) |
Company Profiles | Sterling Biotech Limited, Gelita AG, Darling Ingredients Inc., Nitta Gelatin Inc., India Gelatine & Chemicals, Tessenderlo Group, PB Gelatins GmbH, Junca Gelatines S.L., Trobas Gelatine BV, Weishardt Holding SA, Lapi Gelatine S.p.a., Italgel S.r.l, Gelnex, Rousselot, Norland Products, Collagen Solutions, Qingdao Yuantong, Shandong Tianli Pharmaceutical, Haide Biochem, KIMICA Corporation. |
Key Drivers | • Growth in Food and Cosmetics Industries Fuels Gelatin Consumption Worldwide, Driving Market Expansion • Rising Demand for Gelatin from Pharmaceutical and Nutraceutical Industries Drives Market Growth |
RESTRAINTS | • Presence of Substitute Components Limits Pharmaceutical Gelatin Market Growth |
Pharmaceutical Gelatin Market was valued at USD 1.69 billion in 2023 and is expected to reach USD 2.79 billion by 2032, growing at a CAGR of 5.77% from 2024-2032.
Porcine gelatin held 47% of the pharmaceutical gelatin market share in 2023.
Soft capsules are expected to grow at a CAGR of 6.56% from 2024 to 2032.
Increased demand for vegan and allergy-free products is driving this shift.
North America dominated the market with a revenue share of 42% in 2023.
Table of Contents:
1. Introduction
1.1 Market Definition
1.2 Scope (Inclusion and Exclusions)
1.3 Research Assumptions
2. Executive Summary
2.1 Market Overview
2.2 Regional Synopsis
2.3 Competitive Summary
3. Research Methodology
3.1 Top-Down Approach
3.2 Bottom-up Approach
3.3. Data Validation
3.4 Primary Interviews
4. Market Dynamics Impact Analysis
4.1 Market Driving Factors Analysis
4.1.1 Drivers
4.1.2 Restraints
4.1.3 Opportunities
4.1.4 Challenges
4.2 PESTLE Analysis
4.3 Porter’s Five Forces Model
5. Statistical Insights and Trends Reporting
5.1 Incidence and Prevalence (2023)
5.2 Prescription Trends, (2023), by Region
5.3 Drug Volume: Production and usage volumes of pharmaceuticals.
5.4 Healthcare Spending: Expenditure data by government, insurers, and out-of-pocket by patients.
6. Competitive Landscape
6.1 List of Major Companies, By Region
6.2 Market Share Analysis, By Region
6.3 Product Benchmarking
6.3.1 Product specifications and features
6.3.2 Pricing
6.4 Strategic Initiatives
6.4.1 Marketing and promotional activities
6.4.2 Distribution and supply chain strategies
6.4.3 Expansion plans and new product launches
6.4.4 Strategic partnerships and collaborations
6.5 Technological Advancements
6.6 Market Positioning and Branding
7. Pharmaceutical Gelatin Market Segmentation, by Type
7.1 Chapter Overview
7.2 Type A
7.2.1 Type A Market Trends Analysis (2020-2032)
7.2.2 Type A Market Size Estimates and Forecasts to 2032 (USD Billion)
7.3 Type B
7.3.1 Type B Market Trends Analysis (2020-2032)
7.3.2 Type B Market Size Estimates and Forecasts to 2032 (USD Billion)
8. Pharmaceutical Gelatin Market Segmentation, by Application
8.1 Chapter Overview
8.2 Hard Capsules
8.2.1 Hard Capsules Market Trends Analysis (2020-2032)
8.2.2 Hard Capsules Market Size Estimates and Forecasts to 2032 (USD Billion)
8.3 Soft Capsules
8.3.1 Soft Capsules Market Trends Analysis (2020-2032)
8.3.2 Soft Capsules Market Size Estimates and Forecasts to 2032 (USD Billion)
8.4 Tablets
8.4.1 Tablets Market Trends Analysis (2020-2032)
8.4.2 Tablets Market Size Estimates and Forecasts to 2032 (USD Billion)
8.5 Absorbable Hemostats
8.5.1 Absorbable Hemostats Market Trends Analysis (2020-2032)
8.5.2 Absorbable Hemostats Market Size Estimates and Forecasts to 2032 (USD Billion)
9. Pharmaceutical Gelatin Market Segmentation, by Source
9.1 Chapter Overview
9.2 Porcine
9.2.1 Porcine Market Trends Analysis (2020-2032)
9.2.2 Porcine Market Size Estimates and Forecasts to 2032 (USD Billion)
9.3 Bovine
9.3.1 Bovine Market Trends Analysis (2020-2032)
9.3.2 Bovine Market Size Estimates and Forecasts to 2032 (USD Billion)
9.4 Marine
9.4.1 Marine Market Trends Analysis (2020-2032)
9.4.2 Marine Market Size Estimates and Forecasts to 2032 (USD Billion)
9.5 Poultry
9.5.1 Poultry Market Trends Analysis (2020-2032)
9.5.2 Poultry Market Size Estimates and Forecasts to 2032 (USD Billion)
10. Pharmaceutical Gelatin Market Segmentation, by Function
10.1 Chapter Overview
10.2 Stabilizing agents
10.2.1 Stabilizing agents Market Trends Analysis (2020-2032)
10.2.2 Stabilizing agents Market Size Estimates and Forecasts to 2032 (USD Billion)
10.3 Thickening agents
10.3.1 Thickening agents Market Trends Analysis (2020-2032)
10.3.2 Thickening agents Market Size Estimates and Forecasts to 2032 (USD Billion)
10.4 Gelling agents & Other Functions
10.4.1 Gelling agents & Other Functions Market Trends Analysis (2020-2032)
10.4.2 Gelling agents & Other Functions Market Size Estimates and Forecasts to 2032 (USD Billion)
11. Regional Analysis
11.1 Chapter Overview
11.2 North America
11.2.1 Trends Analysis
11.2.2 North America Pharmaceutical Gelatin Market Estimates and Forecasts, by Country (2020-2032) (USD Billion)
11.2.3 North America Pharmaceutical Gelatin Market Estimates and Forecasts, by Type (2020-2032) (USD Billion)
11.2.4 North America Pharmaceutical Gelatin Market Estimates and Forecasts, by Application (2020-2032) (USD Billion)
11.2.5 North America Pharmaceutical Gelatin Market Estimates and Forecasts, by Source (2020-2032) (USD Billion)
11.2.6 North America Pharmaceutical Gelatin Market Estimates and Forecasts, by Function (2020-2032) (USD Billion)
11.2.7 USA
11.2.7.1 USA Pharmaceutical Gelatin Market Estimates and Forecasts, by Type (2020-2032) (USD Billion)
11.2.7.2 USA Pharmaceutical Gelatin Market Estimates and Forecasts, by Application (2020-2032) (USD Billion)
11.2.7.3 USA Pharmaceutical Gelatin Market Estimates and Forecasts, by Source (2020-2032) (USD Billion)
11.2.7.4 USA Pharmaceutical Gelatin Market Estimates and Forecasts, by Function (2020-2032) (USD Billion)
11.2.8 Canada
11.2.8.1 Canada Pharmaceutical Gelatin Market Estimates and Forecasts, by Type (2020-2032) (USD Billion)
11.2.8.2 Canada Pharmaceutical Gelatin Market Estimates and Forecasts, by Application (2020-2032) (USD Billion)
11.2.8.3 Canada Pharmaceutical Gelatin Market Estimates and Forecasts, by Source (2020-2032) (USD Billion)
11.2.8.4 Canada Pharmaceutical Gelatin Market Estimates and Forecasts, by Function (2020-2032) (USD Billion)
11.2.9 Mexico
11.2.9.1 Mexico Pharmaceutical Gelatin Market Estimates and Forecasts, by Type (2020-2032) (USD Billion)
11.2.9.2 Mexico Pharmaceutical Gelatin Market Estimates and Forecasts, by Application (2020-2032) (USD Billion)
11.2.9.3 Mexico Pharmaceutical Gelatin Market Estimates and Forecasts, by Source (2020-2032) (USD Billion)
11.2.9.4 Mexico Pharmaceutical Gelatin Market Estimates and Forecasts, by Function (2020-2032) (USD Billion)
11.3 Europe
11.3.1 Eastern Europe
11.3.1.1 Trends Analysis
11.3.1.2 Eastern Europe Pharmaceutical Gelatin Market Estimates and Forecasts, by Country (2020-2032) (USD Billion)
11.3.1.3 Eastern Europe Pharmaceutical Gelatin Market Estimates and Forecasts, by Type (2020-2032) (USD Billion)
11.3.1.4 Eastern Europe Pharmaceutical Gelatin Market Estimates and Forecasts, by Application (2020-2032) (USD Billion)
11.3.1.5 Eastern Europe Pharmaceutical Gelatin Market Estimates and Forecasts, by Source (2020-2032) (USD Billion)
11.3.1.6 Eastern Europe Pharmaceutical Gelatin Market Estimates and Forecasts, by Function (2020-2032) (USD Billion)
11.3.1.7 Poland
11.3.1.7.1 Poland Pharmaceutical Gelatin Market Estimates and Forecasts, by Type (2020-2032) (USD Billion)
11.3.1.7.2 Poland Pharmaceutical Gelatin Market Estimates and Forecasts, by Application (2020-2032) (USD Billion)
11.3.1.7.3 Poland Pharmaceutical Gelatin Market Estimates and Forecasts, by Source (2020-2032) (USD Billion)
11.3.1.7.4 Poland Pharmaceutical Gelatin Market Estimates and Forecasts, by Function (2020-2032) (USD Billion)
11.3.1.8 Romania
11.3.1.8.1 Romania Pharmaceutical Gelatin Market Estimates and Forecasts, by Type (2020-2032) (USD Billion)
11.3.1.8.2 Romania Pharmaceutical Gelatin Market Estimates and Forecasts, by Application (2020-2032) (USD Billion)
11.3.1.8.3 Romania Pharmaceutical Gelatin Market Estimates and Forecasts, by Source (2020-2032) (USD Billion)
11.3.1.8.4 Romania Pharmaceutical Gelatin Market Estimates and Forecasts, by Function (2020-2032) (USD Billion)
11.3.1.9 Hungary
11.3.1.9.1 Hungary Pharmaceutical Gelatin Market Estimates and Forecasts, by Type (2020-2032) (USD Billion)
11.3.1.9.2 Hungary Pharmaceutical Gelatin Market Estimates and Forecasts, by Application (2020-2032) (USD Billion)
11.3.1.9.3 Hungary Pharmaceutical Gelatin Market Estimates and Forecasts, by Source (2020-2032) (USD Billion)
11.3.1.9.4 Hungary Pharmaceutical Gelatin Market Estimates and Forecasts, by Function (2020-2032) (USD Billion)
11.3.1.10 Turkey
11.3.1.10.1 Turkey Pharmaceutical Gelatin Market Estimates and Forecasts, by Type (2020-2032) (USD Billion)
11.3.1.10.2 Turkey Pharmaceutical Gelatin Market Estimates and Forecasts, by Application (2020-2032) (USD Billion)
11.3.1.10.3 Turkey Pharmaceutical Gelatin Market Estimates and Forecasts, by Source (2020-2032) (USD Billion)
11.3.1.10.4 Turkey Pharmaceutical Gelatin Market Estimates and Forecasts, by Function (2020-2032) (USD Billion)
11.3.1.11 Rest of Eastern Europe
11.3.1.11.1 Rest of Eastern Europe Pharmaceutical Gelatin Market Estimates and Forecasts, by Type (2020-2032) (USD Billion)
11.3.1.11.2 Rest of Eastern Europe Pharmaceutical Gelatin Market Estimates and Forecasts, by Application (2020-2032) (USD Billion)
11.3.1.11.3 Rest of Eastern Europe Pharmaceutical Gelatin Market Estimates and Forecasts, by Source (2020-2032) (USD Billion)
11.3.1.11.4 Rest of Eastern Europe Pharmaceutical Gelatin Market Estimates and Forecasts, by Function (2020-2032) (USD Billion)
11.3.2 Western Europe
11.3.2.1 Trends Analysis
11.3.2.2 Western Europe Pharmaceutical Gelatin Market Estimates and Forecasts, by Country (2020-2032) (USD Billion)
11.3.2.3 Western Europe Pharmaceutical Gelatin Market Estimates and Forecasts, by Type (2020-2032) (USD Billion)
11.3.2.4 Western Europe Pharmaceutical Gelatin Market Estimates and Forecasts, by Application (2020-2032) (USD Billion)
11.3.2.5 Western Europe Pharmaceutical Gelatin Market Estimates and Forecasts, by Source (2020-2032) (USD Billion)
11.3.2.6 Western Europe Pharmaceutical Gelatin Market Estimates and Forecasts, by Function (2020-2032) (USD Billion)
11.3.2.7 Germany
11.3.2.7.1 Germany Pharmaceutical Gelatin Market Estimates and Forecasts, by Type (2020-2032) (USD Billion)
11.3.2.7.2 Germany Pharmaceutical Gelatin Market Estimates and Forecasts, by Application (2020-2032) (USD Billion)
11.3.2.7.3 Germany Pharmaceutical Gelatin Market Estimates and Forecasts, by Source (2020-2032) (USD Billion)
11.3.2.7.4 Germany Pharmaceutical Gelatin Market Estimates and Forecasts, by Function (2020-2032) (USD Billion)
11.3.2.8 France
11.3.2.8.1 France Pharmaceutical Gelatin Market Estimates and Forecasts, by Type (2020-2032) (USD Billion)
11.3.2.8.2 France Pharmaceutical Gelatin Market Estimates and Forecasts, by Application (2020-2032) (USD Billion)
11.3.2.8.3 France Pharmaceutical Gelatin Market Estimates and Forecasts, by Source (2020-2032) (USD Billion)
11.3.2.8.4 France Pharmaceutical Gelatin Market Estimates and Forecasts, by Function (2020-2032) (USD Billion)
11.3.2.9 UK
11.3.2.9.1 UK Pharmaceutical Gelatin Market Estimates and Forecasts, by Type (2020-2032) (USD Billion)
11.3.2.9.2 UK Pharmaceutical Gelatin Market Estimates and Forecasts, by Application (2020-2032) (USD Billion)
11.3.2.9.3 UK Pharmaceutical Gelatin Market Estimates and Forecasts, by Source (2020-2032) (USD Billion)
11.3.2.9.4 UK Pharmaceutical Gelatin Market Estimates and Forecasts, by Function (2020-2032) (USD Billion)
11.3.2.10 Italy
11.3.2.10.1 Italy Pharmaceutical Gelatin Market Estimates and Forecasts, by Type (2020-2032) (USD Billion)
11.3.2.10.2 Italy Pharmaceutical Gelatin Market Estimates and Forecasts, by Application (2020-2032) (USD Billion)
11.3.2.10.3 Italy Pharmaceutical Gelatin Market Estimates and Forecasts, by Source (2020-2032) (USD Billion)
11.3.2.10.4 Italy Pharmaceutical Gelatin Market Estimates and Forecasts, by Function (2020-2032) (USD Billion)
11.3.2.11 Spain
11.3.2.11.1 Spain Pharmaceutical Gelatin Market Estimates and Forecasts, by Type (2020-2032) (USD Billion)
11.3.2.11.2 Spain Pharmaceutical Gelatin Market Estimates and Forecasts, by Application (2020-2032) (USD Billion)
11.3.2.11.3 Spain Pharmaceutical Gelatin Market Estimates and Forecasts, by Source (2020-2032) (USD Billion)
11.3.2.11.4 Spain Pharmaceutical Gelatin Market Estimates and Forecasts, by Function (2020-2032) (USD Billion)
11.3.2.12 Netherlands
11.3.2.12.1 Netherlands Pharmaceutical Gelatin Market Estimates and Forecasts, by Type (2020-2032) (USD Billion)
11.3.2.12.2 Netherlands Pharmaceutical Gelatin Market Estimates and Forecasts, by Application (2020-2032) (USD Billion)
11.3.2.12.3 Netherlands Pharmaceutical Gelatin Market Estimates and Forecasts, by Source (2020-2032) (USD Billion)
11.3.2.12.4 Netherlands Pharmaceutical Gelatin Market Estimates and Forecasts, by Function (2020-2032) (USD Billion)
11.3.2.13 Switzerland
11.3.2.13.1 Switzerland Pharmaceutical Gelatin Market Estimates and Forecasts, by Type (2020-2032) (USD Billion)
11.3.2.13.2 Switzerland Pharmaceutical Gelatin Market Estimates and Forecasts, by Application (2020-2032) (USD Billion)
11.3.2.13.3 Switzerland Pharmaceutical Gelatin Market Estimates and Forecasts, by Source (2020-2032) (USD Billion)
11.3.2.13.4 Switzerland Pharmaceutical Gelatin Market Estimates and Forecasts, by Function (2020-2032) (USD Billion)
11.3.2.14 Austria
11.3.2.14.1 Austria Pharmaceutical Gelatin Market Estimates and Forecasts, by Type (2020-2032) (USD Billion)
11.3.2.14.2 Austria Pharmaceutical Gelatin Market Estimates and Forecasts, by Application (2020-2032) (USD Billion)
11.3.2.14.3 Austria Pharmaceutical Gelatin Market Estimates and Forecasts, by Source (2020-2032) (USD Billion)
11.3.2.14.4 Austria Pharmaceutical Gelatin Market Estimates and Forecasts, by Function (2020-2032) (USD Billion)
11.3.2.15 Rest of Western Europe
11.3.2.15.1 Rest of Western Europe Pharmaceutical Gelatin Market Estimates and Forecasts, by Type (2020-2032) (USD Billion)
11.3.2.15.2 Rest of Western Europe Pharmaceutical Gelatin Market Estimates and Forecasts, by Application (2020-2032) (USD Billion)
11.3.2.15.3 Rest of Western Europe Pharmaceutical Gelatin Market Estimates and Forecasts, by Source (2020-2032) (USD Billion)
11.3.2.15.4 Rest of Western Europe Pharmaceutical Gelatin Market Estimates and Forecasts, by Function (2020-2032) (USD Billion)
11.4 Asia Pacific
11.4.1 Trends Analysis
11.4.2 Asia Pacific Pharmaceutical Gelatin Market Estimates and Forecasts, by Country (2020-2032) (USD Billion)
11.4.3 Asia Pacific Pharmaceutical Gelatin Market Estimates and Forecasts, by Type (2020-2032) (USD Billion)
11.4.4 Asia Pacific Pharmaceutical Gelatin Market Estimates and Forecasts, by Application (2020-2032) (USD Billion)
11.4.5 Asia Pacific Pharmaceutical Gelatin Market Estimates and Forecasts, by Source (2020-2032) (USD Billion)
11.4.6 Asia Pacific Pharmaceutical Gelatin Market Estimates and Forecasts, by Function (2020-2032) (USD Billion)
11.4.7 China
11.4.7.1 China Pharmaceutical Gelatin Market Estimates and Forecasts, by Type (2020-2032) (USD Billion)
11.4.7.2 China Pharmaceutical Gelatin Market Estimates and Forecasts, by Application (2020-2032) (USD Billion)
11.4.7.3 China Pharmaceutical Gelatin Market Estimates and Forecasts, by Source (2020-2032) (USD Billion)
11.4.7.4 China Pharmaceutical Gelatin Market Estimates and Forecasts, by Function (2020-2032) (USD Billion)
11.4.8 India
11.4.8.1 India Pharmaceutical Gelatin Market Estimates and Forecasts, by Type (2020-2032) (USD Billion)
11.4.8.2 India Pharmaceutical Gelatin Market Estimates and Forecasts, by Application (2020-2032) (USD Billion)
11.4.8.3 India Pharmaceutical Gelatin Market Estimates and Forecasts, by Source (2020-2032) (USD Billion)
11.4.8.4 India Pharmaceutical Gelatin Market Estimates and Forecasts, by Function (2020-2032) (USD Billion)
11.4.9 Japan
11.4.9.1 Japan Pharmaceutical Gelatin Market Estimates and Forecasts, by Type (2020-2032) (USD Billion)
11.4.9.2 Japan Pharmaceutical Gelatin Market Estimates and Forecasts, by Application (2020-2032) (USD Billion)
11.4.9.3 Japan Pharmaceutical Gelatin Market Estimates and Forecasts, by Source (2020-2032) (USD Billion)
11.4.9.4 Japan Pharmaceutical Gelatin Market Estimates and Forecasts, by Function (2020-2032) (USD Billion)
11.4.10 South Korea
11.4.10.1 South Korea Pharmaceutical Gelatin Market Estimates and Forecasts, by Type (2020-2032) (USD Billion)
11.4.10.2 South Korea Pharmaceutical Gelatin Market Estimates and Forecasts, by Application (2020-2032) (USD Billion)
11.4.10.3 South Korea Pharmaceutical Gelatin Market Estimates and Forecasts, by Source (2020-2032) (USD Billion)
11.4.10.4 South Korea Pharmaceutical Gelatin Market Estimates and Forecasts, by Function (2020-2032) (USD Billion)
11.4.11 Vietnam
11.4.11.1 Vietnam Pharmaceutical Gelatin Market Estimates and Forecasts, by Type (2020-2032) (USD Billion)
11.4.11.2 Vietnam Pharmaceutical Gelatin Market Estimates and Forecasts, by Application (2020-2032) (USD Billion)
11.4.11.3 Vietnam Pharmaceutical Gelatin Market Estimates and Forecasts, by Source (2020-2032) (USD Billion)
11.4.11.4 Vietnam Pharmaceutical Gelatin Market Estimates and Forecasts, by Function (2020-2032) (USD Billion)
11.4.12 Singapore
11.4.12.1 Singapore Pharmaceutical Gelatin Market Estimates and Forecasts, by Type (2020-2032) (USD Billion)
11.4.12.2 Singapore Pharmaceutical Gelatin Market Estimates and Forecasts, by Application (2020-2032) (USD Billion)
11.4.12.3 Singapore Pharmaceutical Gelatin Market Estimates and Forecasts, by Source (2020-2032) (USD Billion)
11.4.12.4 Singapore Pharmaceutical Gelatin Market Estimates and Forecasts, by Function (2020-2032) (USD Billion)
11.4.13 Australia
11.4.13.1 Australia Pharmaceutical Gelatin Market Estimates and Forecasts, by Type (2020-2032) (USD Billion)
11.4.13.2 Australia Pharmaceutical Gelatin Market Estimates and Forecasts, by Application (2020-2032) (USD Billion)
11.4.13.3 Australia Pharmaceutical Gelatin Market Estimates and Forecasts, by Source (2020-2032) (USD Billion)
11.4.13.4 Australia Pharmaceutical Gelatin Market Estimates and Forecasts, by Function (2020-2032) (USD Billion)
11.4.14 Rest of Asia Pacific
11.4.14.1 Rest of Asia Pacific Pharmaceutical Gelatin Market Estimates and Forecasts, by Type (2020-2032) (USD Billion)
11.4.14.2 Rest of Asia Pacific Pharmaceutical Gelatin Market Estimates and Forecasts, by Application (2020-2032) (USD Billion)
11.4.14.3 Rest of Asia Pacific Pharmaceutical Gelatin Market Estimates and Forecasts, by Source (2020-2032) (USD Billion)
11.4.14.4 Rest of Asia Pacific Pharmaceutical Gelatin Market Estimates and Forecasts, by Function (2020-2032) (USD Billion)
11.5 Middle East and Africa
11.5.1 Middle East
11.5.1.1 Trends Analysis
11.5.1.2 Middle East Pharmaceutical Gelatin Market Estimates and Forecasts, by Country (2020-2032) (USD Billion)
11.5.1.3 Middle East Pharmaceutical Gelatin Market Estimates and Forecasts, by Type (2020-2032) (USD Billion)
11.5.1.4 Middle East Pharmaceutical Gelatin Market Estimates and Forecasts, by Application (2020-2032) (USD Billion)
11.5.1.5 Middle East Pharmaceutical Gelatin Market Estimates and Forecasts, by Source (2020-2032) (USD Billion)
11.5.1.6 Middle East Pharmaceutical Gelatin Market Estimates and Forecasts, by Function (2020-2032) (USD Billion)
11.5.1.7 UAE
11.5.1.7.1 UAE Pharmaceutical Gelatin Market Estimates and Forecasts, by Type (2020-2032) (USD Billion)
11.5.1.7.2 UAE Pharmaceutical Gelatin Market Estimates and Forecasts, by Application (2020-2032) (USD Billion)
11.5.1.7.3 UAE Pharmaceutical Gelatin Market Estimates and Forecasts, by Source (2020-2032) (USD Billion)
11.5.1.7.4 UAE Pharmaceutical Gelatin Market Estimates and Forecasts, by Function (2020-2032) (USD Billion)
11.5.1.8 Egypt
11.5.1.8.1 Egypt Pharmaceutical Gelatin Market Estimates and Forecasts, by Type (2020-2032) (USD Billion)
11.5.1.8.2 Egypt Pharmaceutical Gelatin Market Estimates and Forecasts, by Application (2020-2032) (USD Billion)
11.5.1.8.3 Egypt Pharmaceutical Gelatin Market Estimates and Forecasts, by Source (2020-2032) (USD Billion)
11.5.1.8.4 Egypt Pharmaceutical Gelatin Market Estimates and Forecasts, by Function (2020-2032) (USD Billion)
11.5.1.9 Saudi Arabia
11.5.1.9.1 Saudi Arabia Pharmaceutical Gelatin Market Estimates and Forecasts, by Type (2020-2032) (USD Billion)
11.5.1.9.2 Saudi Arabia Pharmaceutical Gelatin Market Estimates and Forecasts, by Application (2020-2032) (USD Billion)
11.5.1.9.3 Saudi Arabia Pharmaceutical Gelatin Market Estimates and Forecasts, by Source (2020-2032) (USD Billion)
11.5.1.9.4 Saudi Arabia Pharmaceutical Gelatin Market Estimates and Forecasts, by Function (2020-2032) (USD Billion)
11.5.1.10 Qatar
11.5.1.10.1 Qatar Pharmaceutical Gelatin Market Estimates and Forecasts, by Type (2020-2032) (USD Billion)
11.5.1.10.2 Qatar Pharmaceutical Gelatin Market Estimates and Forecasts, by Application (2020-2032) (USD Billion)
11.5.1.10.3 Qatar Pharmaceutical Gelatin Market Estimates and Forecasts, by Source (2020-2032) (USD Billion)
11.5.1.10.4 Qatar Pharmaceutical Gelatin Market Estimates and Forecasts, by Function (2020-2032) (USD Billion)
11.5.1.11 Rest of Middle East
11.5.1.11.1 Rest of Middle East Pharmaceutical Gelatin Market Estimates and Forecasts, by Type (2020-2032) (USD Billion)
11.5.1.11.2 Rest of Middle East Pharmaceutical Gelatin Market Estimates and Forecasts, by Application (2020-2032) (USD Billion)
11.5.1.11.3 Rest of Middle East Pharmaceutical Gelatin Market Estimates and Forecasts, by Source (2020-2032) (USD Billion)
11.5.1.11.4 Rest of Middle East Pharmaceutical Gelatin Market Estimates and Forecasts, by Function (2020-2032) (USD Billion)
11.5.2 Africa
11.5.2.1 Trends Analysis
11.5.2.2 Africa Pharmaceutical Gelatin Market Estimates and Forecasts, by Country (2020-2032) (USD Billion)
11.5.2.3 Africa Pharmaceutical Gelatin Market Estimates and Forecasts, by Type (2020-2032) (USD Billion)
11.5.2.4 Africa Pharmaceutical Gelatin Market Estimates and Forecasts, by Application (2020-2032) (USD Billion)
11.5.2.5 Africa Pharmaceutical Gelatin Market Estimates and Forecasts, by Source (2020-2032) (USD Billion)
11.5.2.6 Africa Pharmaceutical Gelatin Market Estimates and Forecasts, by Function (2020-2032) (USD Billion)
11.5.2.7 South Africa
11.5.2.7.1 South Africa Pharmaceutical Gelatin Market Estimates and Forecasts, by Type (2020-2032) (USD Billion)
11.5.2.7.2 South Africa Pharmaceutical Gelatin Market Estimates and Forecasts, by Application (2020-2032) (USD Billion)
11.5.2.7.3 South Africa Pharmaceutical Gelatin Market Estimates and Forecasts, by Source (2020-2032) (USD Billion)
11.5.2.7.4 South Africa Pharmaceutical Gelatin Market Estimates and Forecasts, by Function (2020-2032) (USD Billion)
11.5.2.8 Nigeria
11.5.2.8.1 Nigeria Pharmaceutical Gelatin Market Estimates and Forecasts, by Type (2020-2032) (USD Billion)
11.5.2.8.2 Nigeria Pharmaceutical Gelatin Market Estimates and Forecasts, by Application (2020-2032) (USD Billion)
11.5.2.8.3 Nigeria Pharmaceutical Gelatin Market Estimates and Forecasts, by Source (2020-2032) (USD Billion)
11.5.2.8.4 Nigeria Pharmaceutical Gelatin Market Estimates and Forecasts, by Function (2020-2032) (USD Billion)
11.5.2.9 Rest of Africa
11.5.2.9.1 Rest of Africa Pharmaceutical Gelatin Market Estimates and Forecasts, by Type (2020-2032) (USD Billion)
11.5.2.9.2 Rest of Africa Pharmaceutical Gelatin Market Estimates and Forecasts, by Application (2020-2032) (USD Billion)
11.5.2.9.3 Rest of Africa Pharmaceutical Gelatin Market Estimates and Forecasts, by Source (2020-2032) (USD Billion)
11.5.2.9.4 Rest of Africa Pharmaceutical Gelatin Market Estimates and Forecasts, by Function (2020-2032) (USD Billion)
11.6 Latin America
11.6.1 Trends Analysis
11.6.2 Latin America Pharmaceutical Gelatin Market Estimates and Forecasts, by Country (2020-2032) (USD Billion)
11.6.3 Latin America Pharmaceutical Gelatin Market Estimates and Forecasts, by Type (2020-2032) (USD Billion)
11.6.4 Latin America Pharmaceutical Gelatin Market Estimates and Forecasts, by Application (2020-2032) (USD Billion)
11.6.5 Latin America Pharmaceutical Gelatin Market Estimates and Forecasts, by Source (2020-2032) (USD Billion)
11.6.6 Latin America Pharmaceutical Gelatin Market Estimates and Forecasts, by Function (2020-2032) (USD Billion)
11.6.7 Brazil
11.6.7.1 Brazil Pharmaceutical Gelatin Market Estimates and Forecasts, by Type (2020-2032) (USD Billion)
11.6.7.2 Brazil Pharmaceutical Gelatin Market Estimates and Forecasts, by Application (2020-2032) (USD Billion)
11.6.7.3 Brazil Pharmaceutical Gelatin Market Estimates and Forecasts, by Source (2020-2032) (USD Billion)
11.6.7.4 Brazil Pharmaceutical Gelatin Market Estimates and Forecasts, by Function (2020-2032) (USD Billion)
11.6.8 Argentina
11.6.8.1 Argentina Pharmaceutical Gelatin Market Estimates and Forecasts, by Type (2020-2032) (USD Billion)
11.6.8.2 Argentina Pharmaceutical Gelatin Market Estimates and Forecasts, by Application (2020-2032) (USD Billion)
11.6.8.3 Argentina Pharmaceutical Gelatin Market Estimates and Forecasts, by Source (2020-2032) (USD Billion)
11.6.8.4 Argentina Pharmaceutical Gelatin Market Estimates and Forecasts, by Function (2020-2032) (USD Billion)
11.6.9 Colombia
11.6.9.1 Colombia Pharmaceutical Gelatin Market Estimates and Forecasts, by Type (2020-2032) (USD Billion)
11.6.9.2 Colombia Pharmaceutical Gelatin Market Estimates and Forecasts, by Application (2020-2032) (USD Billion)
11.6.9.3 Colombia Pharmaceutical Gelatin Market Estimates and Forecasts, by Source (2020-2032) (USD Billion)
11.6.9.4 Colombia Pharmaceutical Gelatin Market Estimates and Forecasts, by Function (2020-2032) (USD Billion)
11.6.10 Rest of Latin America
11.6.10.1 Rest of Latin America Pharmaceutical Gelatin Market Estimates and Forecasts, by Type (2020-2032) (USD Billion)
11.6.10.2 Rest of Latin America Pharmaceutical Gelatin Market Estimates and Forecasts, by Application (2020-2032) (USD Billion)
11.6.10.3 Rest of Latin America Pharmaceutical Gelatin Market Estimates and Forecasts, by Source (2020-2032) (USD Billion)
11.6.10.4 Rest of Latin America Pharmaceutical Gelatin Market Estimates and Forecasts, by Function (2020-2032) (USD Billion)
12. Company Profiles
12.1 Sterling Biotech Limited
12.1.1 Company Overview
12.1.2 Financial
12.1.3 Products/ Services Offered
12.1.4 SWOT Analysis
12.2 Gelita AG
12.2.1 Company Overview
12.2.2 Financial
12.2.3 Products/ Services Offered
12.2.4 SWOT Analysis
12.3 Darling Ingredients Inc.
12.3.1 Company Overview
12.3.2 Financial
12.3.3 Products/ Services Offered
12.3.4 SWOT Analysis
12.4 Tessenderlo Group
12.4.1 Company Overview
12.4.2 Financial
12.4.3 Products/ Services Offered
12.4.4 SWOT Analysis
12.5 PB Gelatins GmbH
12.5.1 Company Overview
12.5.2 Financial
12.5.3 Products/ Services Offered
12.5.4 SWOT Analysis
12.6 Junca Gelatines S.L.
12.6.1 Company Overview
12.6.2 Financial
12.6.3 Products/ Services Offered
12.6.4 SWOT Analysis
12.7 Weishardt Holding SA
12.7.1 Company Overview
12.7.2 Financial
12.7.3 Products/ Services Offered
12.7.4 SWOT Analysis
12.8 Lapi Gelatine S.p.a
12.8.1 Company Overview
12.8.2 Financial
12.8.3 Products/ Services Offered
12.8.4 SWOT Analysis
12.9 Italgel S.r.l
12.9.1 Company Overview
12.9.2 Financial
12.9.3 Products/ Services Offered
12.9.4 SWOT Analysis
12.10 Gelnex
12.10.1 Company Overview
12.10.2 Financial
12.10.3 Products/ Services Offered
12.10.4 SWOT Analysis
13. Use Cases and Best Practices
14. Conclusion
An accurate research report requires proper strategizing as well as implementation. There are multiple factors involved in the completion of good and accurate research report and selecting the best methodology to compete the research is the toughest part. Since the research reports we provide play a crucial role in any company’s decision-making process, therefore we at SNS Insider always believe that we should choose the best method which gives us results closer to reality. This allows us to reach at a stage wherein we can provide our clients best and accurate investment to output ratio.
Each report that we prepare takes a timeframe of 350-400 business hours for production. Starting from the selection of titles through a couple of in-depth brain storming session to the final QC process before uploading our titles on our website we dedicate around 350 working hours. The titles are selected based on their current market cap and the foreseen CAGR and growth.
The 5 steps process:
Step 1: Secondary Research:
Secondary Research or Desk Research is as the name suggests is a research process wherein, we collect data through the readily available information. In this process we use various paid and unpaid databases which our team has access to and gather data through the same. This includes examining of listed companies’ annual reports, Journals, SEC filling etc. Apart from this our team has access to various associations across the globe across different industries. Lastly, we have exchange relationships with various university as well as individual libraries.
Step 2: Primary Research
When we talk about primary research, it is a type of study in which the researchers collect relevant data samples directly, rather than relying on previously collected data. This type of research is focused on gaining content specific facts that can be sued to solve specific problems. Since the collected data is fresh and first hand therefore it makes the study more accurate and genuine.
We at SNS Insider have divided Primary Research into 2 parts.
Part 1 wherein we interview the KOLs of major players as well as the upcoming ones across various geographic regions. This allows us to have their view over the market scenario and acts as an important tool to come closer to the accurate market numbers. As many as 45 paid and unpaid primary interviews are taken from both the demand and supply side of the industry to make sure we land at an accurate judgement and analysis of the market.
This step involves the triangulation of data wherein our team analyses the interview transcripts, online survey responses and observation of on filed participants. The below mentioned chart should give a better understanding of the part 1 of the primary interview.
Part 2: In this part of primary research the data collected via secondary research and the part 1 of the primary research is validated with the interviews from individual consultants and subject matter experts.
Consultants are those set of people who have at least 12 years of experience and expertise within the industry whereas Subject Matter Experts are those with at least 15 years of experience behind their back within the same space. The data with the help of two main processes i.e., FGDs (Focused Group Discussions) and IDs (Individual Discussions). This gives us a 3rd party nonbiased primary view of the market scenario making it a more dependable one while collation of the data pointers.
Step 3: Data Bank Validation
Once all the information is collected via primary and secondary sources, we run that information for data validation. At our intelligence centre our research heads track a lot of information related to the market which includes the quarterly reports, the daily stock prices, and other relevant information. Our data bank server gets updated every fortnight and that is how the information which we collected using our primary and secondary information is revalidated in real time.
Step 4: QA/QC Process
After all the data collection and validation our team does a final level of quality check and quality assurance to get rid of any unwanted or undesired mistakes. This might include but not limited to getting rid of the any typos, duplication of numbers or missing of any important information. The people involved in this process include technical content writers, research heads and graphics people. Once this process is completed the title gets uploader on our platform for our clients to read it.
Step 5: Final QC/QA Process:
This is the last process and comes when the client has ordered the study. In this process a final QA/QC is done before the study is emailed to the client. Since we believe in giving our clients a good experience of our research studies, therefore, to make sure that we do not lack at our end in any way humanly possible we do a final round of quality check and then dispatch the study to the client.
Key Segments:
By Application
Hard Capsules
Soft Capsules
Tablets
Absorbable Hemostats
By Source
Porcine
Bovine
Marine
Poultry
By Function
Stabilizing agents
Thickening agents
Gelling agents & Other Functions
By Type
Type A
Type B
Request for Segment Customization as per your Business Requirement: Segment Customization Request
Regional Coverage:
North America
US
Canada
Mexico
Europe
Eastern Europe
Poland
Romania
Hungary
Turkey
Rest of Eastern Europe
Western Europe
Germany
France
UK
Italy
Spain
Netherlands
Switzerland
Austria
Rest of Western Europe
Asia Pacific
China
India
Japan
South Korea
Vietnam
Singapore
Australia
Rest of Asia Pacific
Middle East & Africa
Middle East
UAE
Egypt
Saudi Arabia
Qatar
Rest of the Middle East
Africa
Nigeria
South Africa
Rest of Africa
Latin America
Brazil
Argentina
Colombia
Rest of Latin America
Request for Country Level Research Report: Country Level Customization Request
Available Customization
With the given market data, SNS Insider offers customization as per the company’s specific needs. The following customization options are available for the report:
Product Analysis
Criss-Cross segment analysis (e.g. Product X Application)
Product Matrix which gives a detailed comparison of the product portfolio of each company
Geographic Analysis
Additional countries in any of the regions
Company Information
Detailed analysis and profiling of additional market players (Up to five)
The Irritable Bowel Syndrome Treatment Market Size was valued at USD 1.47 billion in 2022, and is expected to reach USD 2.81 billion by 2030, and grow at a CAGR of 8.4% over the forecast period 2023-2030.
The Cryoablation Devices Market size will reach $1295.34 Mn by 2032, was valued at $489.53 Mn in 2023 & growing at a CAGR of 10.26% over 2024-2032.
The Animal Genetic Market was estimated at USD 6.5 billion in 2023 and is poised to reach USD 11.59 billion in 2031 anticipated to expand at a compound annual growth rate CAGR of 7.5% for the forecast period of 2024-2031.
The Artificial Tears Market size was USD 3.28 Billion in 2023 and is expected to reach USD 5.51 Billion by 2032 and grow at a CAGR of 5.96% over the forecast period of 2024-2032.
The Capnography Devices Market size was valued at USD 605.37 million in 2023 and is expected to reach USD 1460.84 million by 2032 and grow at a CAGR of 10.28% over the forecast period 2024-2032.
The Digital X-Ray Systems Market Size was valued at USD 7.9 billion in 2023 and is expected to reach USD 15.4 billion by 2032 and grow at a CAGR of 7.8% over the forecast period 2024-2032.
Hi! Click one of our member below to chat on Phone