Get More Information on Pharmaceutical and Life Sciences in Global Capability Centers (GCCs) Market - Request Sample Report
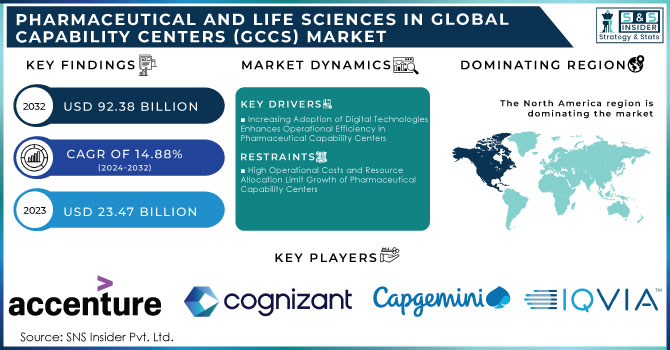
The Pharmaceutical and Life Sciences in Global Capability Centers (GCCs) Market Size was valued at USD 23.47 billion in 2023 and is expected to reach USD 92.38 billion by 2032 and grow at a CAGR of 14.88% over the forecast period 2024-2032.
The Pharmaceutical and Life Sciences in Global Capability Centers (GCCs) market are increasingly pivotal in enhancing operational efficiencies, fostering innovation, and accelerating the drug development process. These centers serve as strategic hubs that leverage technology, data analytics, and industry expertise to support various functions within pharmaceutical and life sciences organizations. As companies seek to adapt to rapidly changing market conditions and consumer demands, capability centers are becoming essential for driving competitive advantage. This shift is largely driven by the rising need for digital transformation, increased regulatory scrutiny, and the growing importance of personalized medicine. Organizations are focusing on optimizing their supply chains, improving research and development efficiency, and utilizing advanced technologies to meet these demands.
A significant development in the Pharmaceutical and Life Sciences in Global Capability Centers (GCCs) market is the establishment of an AI-driven capability center by Boehringer Ingelheim in June 2024. This initiative aims to harness artificial intelligence to streamline research processes and improve patient outcomes. By integrating AI technologies into their operations, the center is positioned to enhance drug discovery and development, facilitating quicker responses to market needs. Furthermore, it aims to train personnel in advanced data analytics techniques, emphasizing the need for a skilled workforce adept in leveraging these technologies. This shift highlights the increasing reliance on AI and data-driven solutions in enhancing operational capabilities and supporting innovation in the pharmaceutical sector.
In September 2024, L&T Technology Services launched a new capability center focusing on generative AI to transform global research processes. This center aims to accelerate innovation by utilizing generative AI models that can synthesize new compounds, predict drug interactions, and optimize clinical trial designs. By collaboration between cross-functional teams and harnessing advanced technologies, the center intends to enhance the speed and efficiency of research initiatives. The establishment of this center signifies a strategic investment in next-generation technologies, underscoring the industry's shift towards a more integrated and innovative approach to drug development and patient care.
Moreover, organizations are increasingly investing in their capability centers to enable better decision-making through data integration and analysis. The emphasis on creating a data-driven culture within these centers allows for real-time insights that inform strategic decisions. The pharmaceutical companies are focusing on the alignment of their capability centers with business objectives to ensure that they drive value and facilitate innovation. This alignment is crucial as it helps organizations navigate complex regulatory environments and adapt to emerging trends in patient-centric healthcare. As the pharmaceutical and life sciences landscape continues to evolve, capability centers will remain integral in shaping the future of the industry, ensuring that companies can effectively respond to the challenges and opportunities that lie ahead.
Drivers:
Increasing Adoption of Digital Technologies Enhances Operational Efficiency in Pharmaceutical Capability Centers
The increasing adoption of digital technologies is significantly enhancing operational efficiency within pharmaceutical capability centers. Organizations are leveraging advanced technologies like artificial intelligence (AI), machine learning (ML), and big data analytics to streamline their processes. These digital tools facilitate better data management, real-time insights, and automation of repetitive tasks, allowing teams to focus on more strategic initiatives. For instance, AI algorithms can analyze vast datasets to identify potential drug candidates more quickly than traditional methods, thus expediting the research and development phase. Moreover, automation can optimize supply chain logistics, improving inventory management and reducing operational costs. By embracing these technologies, pharmaceutical companies can enhance their responsiveness to market changes and consumer needs, leading to improved product quality and shorter time-to-market for new therapies. As a result, the demand for capability centers that support digital transformation is likely to grow, positioning organizations to maintain a competitive edge in a rapidly evolving industry landscape.
Growing Focus on Patient-Centric Approaches Drives Innovation in Pharmaceutical Capability Centers
The growing focus on patient-centric approaches in healthcare is driving innovation within pharmaceutical capability centers. As patients become more informed and involved in their treatment decisions, pharmaceutical companies are prioritizing the development of therapies that cater to individual needs. Capability centers play a crucial role in this transformation by fostering collaborative environments that bring together multidisciplinary teams, including clinicians, researchers, and data scientists. These teams work together to gather patient insights, analyze treatment outcomes, and refine drug development processes based on real-world data. The emphasis on personalized medicine encourages the creation of tailored therapies, which can significantly enhance patient adherence and satisfaction. Additionally, capability centers are instrumental in conducting patient engagement initiatives, ensuring that patients' voices are heard throughout the drug development lifecycle. By prioritizing patient-centricity, pharmaceutical companies can improve their reputation, drive loyalty, and ultimately achieve better health outcomes, further validating the importance of capability centers in the modern pharmaceutical landscape.
Restraint:
High Operational Costs and Resource Allocation Limit Growth of Pharmaceutical Capability Centers
High operational costs and resource allocation challenges are significant restraints impacting the growth of capability centers in the pharmaceutical sector. Establishing and maintaining these centers often requires substantial investments in technology, infrastructure, and skilled personnel. The need for advanced technological tools, such as sophisticated data analytics platforms and AI systems, demands ongoing financial commitment, which can be prohibitive for smaller organizations or startups. Additionally, attracting and retaining top talent in data science and analytics can further strain budgets, as competition for skilled professionals intensifies. Resource allocation becomes a critical issue when companies must balance investments in capability centers with other business priorities, such as research and development or marketing initiatives. Consequently, the pressure to achieve rapid return on investment may lead some organizations to reconsider or delay their plans to develop capability centers. This dynamic can stifle innovation and limit the potential benefits of enhanced operational efficiency, ultimately impacting the overall competitiveness of firms in the pharmaceutical industry.
Opportunity:
Expanding Regulatory Support for Innovation in Drug Development Enhances Capability Center Potential
The expanding regulatory support for innovation in drug development presents a significant opportunity for capability centers within the pharmaceutical sector. Regulatory agencies are increasingly recognizing the need to streamline approval processes and encourage the adoption of innovative technologies that can improve patient outcomes. Initiatives such as accelerated approval pathways and guidance on the use of real-world evidence are paving the way for pharmaceutical companies to bring new therapies to market more efficiently. Capability centers are uniquely positioned to leverage this regulatory support by integrating cutting-edge technologies into their operations and adapting their strategies to comply with evolving regulations. By focusing on innovative solutions, these centers can enhance collaboration with regulatory bodies, ensuring that their research methodologies align with regulatory expectations. This proactive approach not only expedites the development of new drugs but also enhances the credibility of pharmaceutical companies in the eyes of regulators and patients alike. As a result, the potential for capability centers to drive innovation and facilitate faster access to ground breaking therapies is becoming increasingly pronounced.
Challenge:
Navigating Complex Regulatory Landscapes Poses Significant Hurdles for Capability Centers
Navigating complex regulatory landscapes remains a significant challenge for Pharmaceutical and Life Sciences in Global Capability Centers (GCCs) market. The pharmaceutical industry is subject to stringent regulations that vary by region, requiring companies to adapt their operations accordingly. This complexity can hinder the efficiency of capability centers, as teams must ensure compliance with a multitude of guidelines and standards throughout the drug development process. Moreover, as technology continues to evolve, regulatory bodies are also adapting their frameworks, creating additional uncertainties for organizations trying to stay ahead of the curve. The need to constantly update protocols, invest in compliance training, and monitor regulatory changes can divert resources and attention away from innovation and operational improvements. Consequently, capability centers may struggle to strike a balance between adhering to regulatory requirements and fostering an environment that encourages experimentation and rapid development. This ongoing challenge necessitates a strategic approach to compliance, collaboration with regulatory agencies, and a commitment to staying informed about regulatory changes to mitigate potential disruptions to their operations and growth trajectories.
By Service
In 2023, the IT and Digital Transformation Services segment dominated the Pharmaceutical and Life Sciences in Global Capability Centers (GCCs) Market, holding an estimated market share of approximately 38.60%. This dominance is driven by the rapid adoption of advanced digital technologies such as artificial intelligence (AI), machine learning (ML), and cloud computing to streamline operations, enhance data management, and drive innovation. For instance, Pfizer’s investment in AI-driven platforms and Roche’s digital health initiatives exemplify how IT and digital transformation services are being utilized to accelerate research and development, improve drug discovery processes, and optimize patient engagement strategies. These advancements are crucial in maintaining competitiveness, especially as companies aim to reduce costs and increase the efficiency of their operations.
By Function
In 2023, the Research & Development function segment dominated the Capability Centers within the Pharmaceutical and Life Sciences Market, accounting for an estimated market share of around 36.80%. This dominance is attributed to the increasing focus on innovation and personalized medicine, as well as the rising demand for faster drug development and clinical trials. Pharmaceutical giants like Boehringer Ingelheim and Novartis have heavily invested in their R&D capabilities through capability centers that focus on advanced analytics, AI, and real-world evidence to expedite the drug discovery process. The establishment of R&D-focused capability centers allows companies to harness cutting-edge technologies, optimize their research workflows, and shorten time-to-market for critical therapies, aligning with evolving healthcare demands.
By Organizational Model
In 2023, the Captive Centers segment dominated the Pharmaceutical and Life Sciences in Global Capability Centers (GCCs) Market, holding an estimated market share of approximately 58.30%. Captive centers, owned and operated directly by pharmaceutical companies, provide greater control over sensitive operations such as R&D, regulatory compliance, and data security. Companies like Roche and Pfizer have established captive centers to centralize their innovation efforts and maintain intellectual property control while ensuring alignment with company-wide strategies. The focus on in-house expertise and proprietary technologies in these centers enables pharmaceutical companies to better manage risk, enhance innovation, and ensure compliance with regulatory requirements, which is crucial in this highly regulated industry.
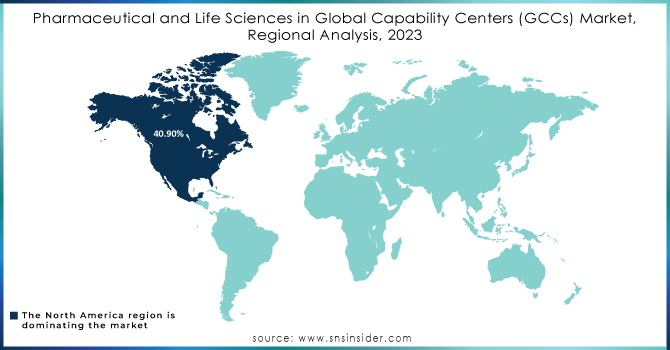
In 2023, North America dominated the Pharmaceutical and Life Sciences in Global Capability Centers (GCCs) market, with an estimated market share of 40.90%. This region's leadership is attributed to its robust pharmaceutical industry, extensive investment in research and development, and the presence of major pharmaceutical companies and biotechnology firms. For instance, the United States is home to several global players, including Pfizer and Johnson & Johnson, which leverage capability centers to enhance innovation, streamline operations, and improve patient outcomes. Additionally, favorable government policies, strong intellectual property protection, and access to advanced technologies have further bolstered the establishment and expansion of capability centers in North America, enabling companies to maintain a competitive edge in drug development and manufacturing.
Moreover, the Asia-Pacific region emerged as the fastest-growing area in the Pharmaceutical and Life Sciences in Global Capability Centers (GCCs) market in 2023, with an estimated CAGR of 16.32%. This growth is primarily driven by increasing investments in healthcare infrastructure, rising demand for pharmaceutical products, and the expansion of clinical trials in countries like India and China. Many global pharmaceutical companies are establishing capability centers in this region to tap into the large, skilled workforce and to benefit from cost efficiencies. For example, companies such as Novartis and Roche have expanded their operations in Asia-Pacific, focusing on R&D and manufacturing to serve not only local markets but also global supply chains. The combination of economic growth, technological advancements, and supportive government policies makes Asia-Pacific an attractive hub for pharmaceutical innovation and operational efficiency.
Need Any Customization Research On Pharmaceutical and Life Sciences in Global Capability Centers (GCCs) Market - Inquiry Now
Accenture (Intelligent Patient Services, Cloud for Pharmaceuticals, Digital Data Insights)
Cognizant (Cognizant Life Sciences Cloud, Smart Patient Engagement, Digital Transformation Solutions)
Wipro (Wipro HOLMES AI Platform, Pharma Analytics, Life Sciences R&D Solutions)
IBM (IBM Watson for Drug Discovery, IBM Clinical Development, Watson Health)
Tata Consultancy Services (TCS) (TCS BaNCS for Life Sciences, TCS Digital Twin, TCS HOBS)
Capgemini (Life Sciences Data Platform, Capgemini HealthTech, Digital Manufacturing Solutions)
IQVIA (IQVIA Orchestrated Customer Engagement, IQVIA CORE, IQVIA Technologies)
Pfizer (Pfizer Digital Solutions, Pfizeromics, Clinical Trial Innovation Platform)
Roche (Roche Diagnostics Solutions, Roche Sequencing Solutions, Roche Digital Health)
Boehringer Ingelheim (BI Connect, Boehringer Ingelheim Data Science Platform, Digital Innovation Hub)
| Report Attributes | Details |
|---|---|
| Market Size in 2023 | US$ 23.47 Billion |
| Market Size by 2032 | US$ 92.38 Billion |
| CAGR | CAGR of 14.88% From 2024 to 2032 |
| Base Year | 2023 |
| Forecast Period | 2024-2032 |
| Historical Data | 2020-2022 |
| Report Scope & Coverage | Market Size, Segments Analysis, Competitive Landscape, Regional Analysis, DROC & SWOT Analysis, Forecast Outlook |
| Key Segments | • By Service (IT and Digital Transformation Services, Business Process Management (BPM), Knowledge Process Outsourcing (KPO)) • By Function (Research & Development, Manufacturing & Operations, Sales & Marketing, Regulatory Compliance & Quality Assurance) • By Organizational Model (Captive Centers, Hybrid Centers, Outsourced Centers) |
| Regional Analysis/Coverage | North America (US, Canada, Mexico), Europe (Eastern Europe [Poland, Romania, Hungary, Turkey, Rest of Eastern Europe] Western Europe [Germany, France, UK, Italy, Spain, Netherlands, Switzerland, Austria, Rest of Western Europe]), Asia Pacific (China, India, Japan, South Korea, Vietnam, Singapore, Australia, Rest of Asia Pacific), Middle East & Africa (Middle East [UAE, Egypt, Saudi Arabia, Qatar, Rest of Middle East], Africa [Nigeria, South Africa, Rest of Africa], Latin America (Brazil, Argentina, Colombia, Rest of Latin America) |
| Company Profiles | Accenture, Cognizant, Wipro, IBM, Tata Consultancy Services (TCS), Capgemini, IQVIA, Pfizer, Roche, Boehringer Ingelheimand other key players |
| Key Drivers | • Increasing Adoption of Digital Technologies Enhances Operational Efficiency in Pharmaceutical Capability Centers • Growing Focus on Patient-Centric Approaches Drives Innovation in Pharmaceutical Capability Centers |
| Restraint | • High Operational Costs and Resource Allocation Limit Growth of Pharmaceutical Capability Centers |
Ans: The Pharmaceutical and Life Sciences in Global Capability Centers (GCCs) Market is expected to grow at a CAGR of 14.88%
Ans: The Pharmaceutical and Life Sciences in Global Capability Centers (GCCs) Market Size was valued at USD 23.47 billion in 2023 and is expected to reach USD 92.38 billion by 2032.
Ans: Expanding Regulatory Support for Innovation in Drug Development Enhances Capability Center Potential
Ans: Navigating Complex Regulatory Landscapes Poses Significant Hurdles for Capability Centers
Ans: The North American region dominated the Pharmaceutical and Life Sciences in Global Capability Centers (GCCs) market holding the largest market share of about 40.90% during the forecast period.
1. Introduction
1.1 Market Definition
1.2 Scope (Inclusion and Exclusions)
1.3 Research Assumptions
2. Executive Summary
2.1 Market Overview
2.2 Regional Synopsis
2.3 Competitive Summary
3. Research Methodology
3.1 Top-Down Approach
3.2 Bottom-up Approach
3.3. Data Validation
3.4 Primary Interviews
4. Market Dynamics Impact Analysis
4.1 Market Driving Factors Analysis
4.1.1 Drivers
4.1.2 Restraints
4.1.3 Opportunities
4.1.4 Challenges
4.2 PESTLE Analysis
4.3 Porter’s Five Forces Model
5. Statistical Insights and Trends Reporting
5.1 Production Capacity and Utilization Analysis by Region
5.2 Feedstock Prices Analysis by Region
5.3 Regulatory Impact: Effects of regulations on production and usage.
5.4 Environmental Metrics Analysis by Region
5.5 Innovation and R&D
6. Competitive Landscape
6.1 List of Major Companies, By Region
6.2 Market Share Analysis, By Region
6.3 Product Benchmarking
6.3.1 Product specifications and features
6.3.2 Pricing
6.4 Strategic Initiatives
6.4.1 Marketing and promotional activities
6.4.2 Distribution and supply chain strategies
6.4.3 Expansion plans and new product launches
6.4.4 Strategic partnerships and collaborations
6.5 Technological Advancements
6.6 Market Positioning and Branding
7. Pharmaceutical and Life Sciences in Global Capability Centers (GCCs) Market Segmentation, by Service
7.1 Chapter Overview
7.2 IT and Digital Transformation Services
7.2.1 IT and Digital Transformation Services Market Trends Analysis (2020-2032)
7.2.2 IT and Digital Transformation Services Market Size Estimates and Forecasts to 2032 (USD Billion)
7.3 Business Process Management (BPM)
7.3.1 Business Process Management (BPM) Market Trends Analysis (2020-2032)
7.3.2 Business Process Management (BPM) Market Size Estimates and Forecasts to 2032 (USD Billion)
7.4 Knowledge Process Outsourcing (KPO)
7.4.1 Knowledge Process Outsourcing (KPO) Market Trends Analysis (2020-2032)
7.4.2 Knowledge Process Outsourcing (KPO) Market Size Estimates and Forecasts to 2032 (USD Billion)
8. Pharmaceutical and Life Sciences in Global Capability Centers (GCCs) Market Segmentation, by Function
8.1 Chapter Overview
8.2 Research & Development
8.2.1 Research & Development Market Trends Analysis (2020-2032)
8.2.2 Research & Development Market Size Estimates and Forecasts to 2032 (USD Billion)
8.3 Manufacturing & Operations
8.3.1 Manufacturing & Operations Market Trends Analysis (2020-2032)
8.3.2 Manufacturing & Operations Market Size Estimates and Forecasts to 2032 (USD Billion)
8.4 Sales & Marketing
8.4.1 Sales & Marketing Market Trends Analysis (2020-2032)
8.4.2 Sales & Marketing Market Size Estimates and Forecasts to 2032 (USD Billion)
8.5 Regulatory Compliance & Quality Assurance
8.5.1 Regulatory Compliance & Quality Assurance Market Trends Analysis (2020-2032)
8.5.2 Regulatory Compliance & Quality Assurance Market Size Estimates and Forecasts to 2032 (USD Billion)
9. Pharmaceutical and Life Sciences in Global Capability Centers (GCCs) Market Segmentation, by Organizational Model
9.1 Chapter Overview
9.2 Captive Centers
9.2.1 Captive Centers Market Trends Analysis (2020-2032)
9.2.2 Captive Centers Market Size Estimates and Forecasts to 2032 (USD Billion)
9.3 Hybrid Centers
9.3.1 Hybrid Centers Market Trends Analysis (2020-2032)
9.3.2 Hybrid Centers Market Size Estimates and Forecasts to 2032 (USD Billion)
9.4 Outsourced Centers
9.4.1 Outsourced Centers Market Trends Analysis (2020-2032)
9.4.2 Outsourced Centers Market Size Estimates and Forecasts to 2032 (USD Billion)
10. Regional Analysis
10.1 Chapter Overview
10.2 North America
10.2.1 Trends Analysis
10.2.2 North America Pharmaceutical and Life Sciences in Global Capability Centers (GCCs) Market Estimates and Forecasts, by Country (2020-2032) (USD Billion)
10.2.3 North America Pharmaceutical and Life Sciences in Global Capability Centers (GCCs) Market Estimates and Forecasts, by Service (2020-2032) (USD Billion)
10.2.4 North America Pharmaceutical and Life Sciences in Global Capability Centers (GCCs) Market Estimates and Forecasts, by Function (2020-2032) (USD Billion)
10.2.5 North America Pharmaceutical and Life Sciences in Global Capability Centers (GCCs) Market Estimates and Forecasts, by Organizational Model (2020-2032) (USD Billion)
10.2.6 USA
10.2.6.1 USA Pharmaceutical and Life Sciences in Global Capability Centers (GCCs) Market Estimates and Forecasts, by Service (2020-2032) (USD Billion)
10.2.6.2 USA Pharmaceutical and Life Sciences in Global Capability Centers (GCCs) Market Estimates and Forecasts, by Function (2020-2032) (USD Billion)
10.2.6.3 USA Pharmaceutical and Life Sciences in Global Capability Centers (GCCs) Market Estimates and Forecasts, by Organizational Model (2020-2032) (USD Billion)
10.2.7 Canada
10.2.7.1 Canada Pharmaceutical and Life Sciences in Global Capability Centers (GCCs) Market Estimates and Forecasts, by Service (2020-2032) (USD Billion)
10.2.7.2 Canada Pharmaceutical and Life Sciences in Global Capability Centers (GCCs) Market Estimates and Forecasts, by Function (2020-2032) (USD Billion)
10.2.7.3 Canada Pharmaceutical and Life Sciences in Global Capability Centers (GCCs) Market Estimates and Forecasts, by Organizational Model (2020-2032) (USD Billion)
10.2.8 Mexico
10.2.8.1 Mexico Pharmaceutical and Life Sciences in Global Capability Centers (GCCs) Market Estimates and Forecasts, by Service (2020-2032) (USD Billion)
10.2.8.2 Mexico Pharmaceutical and Life Sciences in Global Capability Centers (GCCs) Market Estimates and Forecasts, by Function (2020-2032) (USD Billion)
10.2.8.3 Mexico Pharmaceutical and Life Sciences in Global Capability Centers (GCCs) Market Estimates and Forecasts, by Organizational Model (2020-2032) (USD Billion)
10.3 Europe
10.3.1 Eastern Europe
10.3.1.1 Trends Analysis
10.3.1.2 Eastern Europe Pharmaceutical and Life Sciences in Global Capability Centers (GCCs) Market Estimates and Forecasts, by Country (2020-2032) (USD Billion)
10.3.1.3 Eastern Europe Pharmaceutical and Life Sciences in Global Capability Centers (GCCs) Market Estimates and Forecasts, by Service (2020-2032) (USD Billion)
10.3.1.4 Eastern Europe Pharmaceutical and Life Sciences in Global Capability Centers (GCCs) Market Estimates and Forecasts, by Function (2020-2032) (USD Billion)
10.3.1.5 Eastern Europe Pharmaceutical and Life Sciences in Global Capability Centers (GCCs) Market Estimates and Forecasts, by Organizational Model (2020-2032) (USD Billion)
10.3.1.6 Poland
10.3.1.6.1 Poland Pharmaceutical and Life Sciences in Global Capability Centers (GCCs) Market Estimates and Forecasts, by Service (2020-2032) (USD Billion)
10.3.1.6.2 Poland Pharmaceutical and Life Sciences in Global Capability Centers (GCCs) Market Estimates and Forecasts, by Function (2020-2032) (USD Billion)
10.3.1.6.3 Poland Pharmaceutical and Life Sciences in Global Capability Centers (GCCs) Market Estimates and Forecasts, by Organizational Model (2020-2032) (USD Billion)
10.3.1.7 Romania
10.3.1.7.1 Romania Pharmaceutical and Life Sciences in Global Capability Centers (GCCs) Market Estimates and Forecasts, by Service (2020-2032) (USD Billion)
10.3.1.7.2 Romania Pharmaceutical and Life Sciences in Global Capability Centers (GCCs) Market Estimates and Forecasts, by Function (2020-2032) (USD Billion)
10.3.1.7.3 Romania Pharmaceutical and Life Sciences in Global Capability Centers (GCCs) Market Estimates and Forecasts, by Organizational Model (2020-2032) (USD Billion)
10.3.1.8 Hungary
10.3.1.8.1 Hungary Pharmaceutical and Life Sciences in Global Capability Centers (GCCs) Market Estimates and Forecasts, by Service (2020-2032) (USD Billion)
10.3.1.8.2 Hungary Pharmaceutical and Life Sciences in Global Capability Centers (GCCs) Market Estimates and Forecasts, by Function (2020-2032) (USD Billion)
10.3.1.8.3 Hungary Pharmaceutical and Life Sciences in Global Capability Centers (GCCs) Market Estimates and Forecasts, by Organizational Model (2020-2032) (USD Billion)
10.3.1.9 Turkey
10.3.1.9.1 Turkey Pharmaceutical and Life Sciences in Global Capability Centers (GCCs) Market Estimates and Forecasts, by Service (2020-2032) (USD Billion)
10.3.1.9.2 Turkey Pharmaceutical and Life Sciences in Global Capability Centers (GCCs) Market Estimates and Forecasts, by Function (2020-2032) (USD Billion)
10.3.1.9.3 Turkey Pharmaceutical and Life Sciences in Global Capability Centers (GCCs) Market Estimates and Forecasts, by Organizational Model (2020-2032) (USD Billion)
10.3.1.10 Rest of Eastern Europe
10.3.1.10.1 Rest of Eastern Europe Pharmaceutical and Life Sciences in Global Capability Centers (GCCs) Market Estimates and Forecasts, by Service (2020-2032) (USD Billion)
10.3.1.10.2 Rest of Eastern Europe Pharmaceutical and Life Sciences in Global Capability Centers (GCCs) Market Estimates and Forecasts, by Function (2020-2032) (USD Billion)
10.3.1.10.3 Rest of Eastern Europe Pharmaceutical and Life Sciences in Global Capability Centers (GCCs) Market Estimates and Forecasts, by Organizational Model (2020-2032) (USD Billion)
10.3.2 Western Europe
10.3.2.1 Trends Analysis
10.3.2.2 Western Europe Pharmaceutical and Life Sciences in Global Capability Centers (GCCs) Market Estimates and Forecasts, by Country (2020-2032) (USD Billion)
10.3.2.3 Western Europe Pharmaceutical and Life Sciences in Global Capability Centers (GCCs) Market Estimates and Forecasts, by Service (2020-2032) (USD Billion)
10.3.2.4 Western Europe Pharmaceutical and Life Sciences in Global Capability Centers (GCCs) Market Estimates and Forecasts, by Function (2020-2032) (USD Billion)
10.3.2.5 Western Europe Pharmaceutical and Life Sciences in Global Capability Centers (GCCs) Market Estimates and Forecasts, by Organizational Model (2020-2032) (USD Billion)
10.3.2.6 Germany
10.3.2.6.1 Germany Pharmaceutical and Life Sciences in Global Capability Centers (GCCs) Market Estimates and Forecasts, by Service (2020-2032) (USD Billion)
10.3.2.6.2 Germany Pharmaceutical and Life Sciences in Global Capability Centers (GCCs) Market Estimates and Forecasts, by Function (2020-2032) (USD Billion)
10.3.2.6.3 Germany Pharmaceutical and Life Sciences in Global Capability Centers (GCCs) Market Estimates and Forecasts, by Organizational Model (2020-2032) (USD Billion)
10.3.2.7 France
10.3.2.7.1 France Pharmaceutical and Life Sciences in Global Capability Centers (GCCs) Market Estimates and Forecasts, by Service (2020-2032) (USD Billion)
10.3.2.7.2 France Pharmaceutical and Life Sciences in Global Capability Centers (GCCs) Market Estimates and Forecasts, by Function (2020-2032) (USD Billion)
10.3.2.7.3 France Pharmaceutical and Life Sciences in Global Capability Centers (GCCs) Market Estimates and Forecasts, by Organizational Model (2020-2032) (USD Billion)
10.3.2.8 UK
10.3.2.8.1 UK Pharmaceutical and Life Sciences in Global Capability Centers (GCCs) Market Estimates and Forecasts, by Service (2020-2032) (USD Billion)
10.3.2.8.2 UK Pharmaceutical and Life Sciences in Global Capability Centers (GCCs) Market Estimates and Forecasts, by Function (2020-2032) (USD Billion)
10.3.2.8.3 UK Pharmaceutical and Life Sciences in Global Capability Centers (GCCs) Market Estimates and Forecasts, by Organizational Model (2020-2032) (USD Billion)
10.3.2.9 Italy
10.3.2.9.1 Italy Pharmaceutical and Life Sciences in Global Capability Centers (GCCs) Market Estimates and Forecasts, by Service (2020-2032) (USD Billion)
10.3.2.9.2 Italy Pharmaceutical and Life Sciences in Global Capability Centers (GCCs) Market Estimates and Forecasts, by Function (2020-2032) (USD Billion)
10.3.2.9.3 Italy Pharmaceutical and Life Sciences in Global Capability Centers (GCCs) Market Estimates and Forecasts, by Organizational Model (2020-2032) (USD Billion)
10.3.2.10 Spain
10.3.2.10.1 Spain Pharmaceutical and Life Sciences in Global Capability Centers (GCCs) Market Estimates and Forecasts, by Service (2020-2032) (USD Billion)
10.3.2.10.2 Spain Pharmaceutical and Life Sciences in Global Capability Centers (GCCs) Market Estimates and Forecasts, by Function (2020-2032) (USD Billion)
10.3.2.10.3 Spain Pharmaceutical and Life Sciences in Global Capability Centers (GCCs) Market Estimates and Forecasts, by Organizational Model (2020-2032) (USD Billion)
10.3.2.11 Netherlands
10.3.2.11.1 Netherlands Pharmaceutical and Life Sciences in Global Capability Centers (GCCs) Market Estimates and Forecasts, by Service (2020-2032) (USD Billion)
10.3.2.11.2 Netherlands Pharmaceutical and Life Sciences in Global Capability Centers (GCCs) Market Estimates and Forecasts, by Function (2020-2032) (USD Billion)
10.3.2.11.3 Netherlands Pharmaceutical and Life Sciences in Global Capability Centers (GCCs) Market Estimates and Forecasts, by Organizational Model (2020-2032) (USD Billion)
10.3.2.12 Switzerland
10.3.2.12.1 Switzerland Pharmaceutical and Life Sciences in Global Capability Centers (GCCs) Market Estimates and Forecasts, by Service (2020-2032) (USD Billion)
10.3.2.12.2 Switzerland Pharmaceutical and Life Sciences in Global Capability Centers (GCCs) Market Estimates and Forecasts, by Function (2020-2032) (USD Billion)
10.3.2.12.3 Switzerland Pharmaceutical and Life Sciences in Global Capability Centers (GCCs) Market Estimates and Forecasts, by Organizational Model (2020-2032) (USD Billion)
10.3.2.13 Austria
10.3.2.13.1 Austria Pharmaceutical and Life Sciences in Global Capability Centers (GCCs) Market Estimates and Forecasts, by Service (2020-2032) (USD Billion)
10.3.2.13.2 Austria Pharmaceutical and Life Sciences in Global Capability Centers (GCCs) Market Estimates and Forecasts, by Function (2020-2032) (USD Billion)
10.3.2.13.3 Austria Pharmaceutical and Life Sciences in Global Capability Centers (GCCs) Market Estimates and Forecasts, by Organizational Model (2020-2032) (USD Billion)
10.3.2.14 Rest of Western Europe
10.3.2.14.1 Rest of Western Europe Pharmaceutical and Life Sciences in Global Capability Centers (GCCs) Market Estimates and Forecasts, by Service (2020-2032) (USD Billion)
10.3.2.14.2 Rest of Western Europe Pharmaceutical and Life Sciences in Global Capability Centers (GCCs) Market Estimates and Forecasts, by Function (2020-2032) (USD Billion)
10.3.2.14.3 Rest of Western Europe Pharmaceutical and Life Sciences in Global Capability Centers (GCCs) Market Estimates and Forecasts, by Organizational Model (2020-2032) (USD Billion)
10.4 Asia Pacific
10.4.1 Trends Analysis
10.4.2 Asia Pacific Pharmaceutical and Life Sciences in Global Capability Centers (GCCs) Market Estimates and Forecasts, by Country (2020-2032) (USD Billion)
10.4.3 Asia Pacific Pharmaceutical and Life Sciences in Global Capability Centers (GCCs) Market Estimates and Forecasts, by Service (2020-2032) (USD Billion)
10.4.4 Asia Pacific Pharmaceutical and Life Sciences in Global Capability Centers (GCCs) Market Estimates and Forecasts, by Function (2020-2032) (USD Billion)
10.4.5 Asia Pacific Pharmaceutical and Life Sciences in Global Capability Centers (GCCs) Market Estimates and Forecasts, by Organizational Model (2020-2032) (USD Billion)
10.4.6 China
10.4.6.1 China Pharmaceutical and Life Sciences in Global Capability Centers (GCCs) Market Estimates and Forecasts, by Service (2020-2032) (USD Billion)
10.4.6.2 China Pharmaceutical and Life Sciences in Global Capability Centers (GCCs) Market Estimates and Forecasts, by Function (2020-2032) (USD Billion)
10.4.6.3 China Pharmaceutical and Life Sciences in Global Capability Centers (GCCs) Market Estimates and Forecasts, by Organizational Model (2020-2032) (USD Billion)
10.4.7 India
10.4.7.1 India Pharmaceutical and Life Sciences in Global Capability Centers (GCCs) Market Estimates and Forecasts, by Service (2020-2032) (USD Billion)
10.4.7.2 India Pharmaceutical and Life Sciences in Global Capability Centers (GCCs) Market Estimates and Forecasts, by Function (2020-2032) (USD Billion)
10.4.7.3 India Pharmaceutical and Life Sciences in Global Capability Centers (GCCs) Market Estimates and Forecasts, by Organizational Model (2020-2032) (USD Billion)
10.4.8 Japan
10.4.8.1 Japan Pharmaceutical and Life Sciences in Global Capability Centers (GCCs) Market Estimates and Forecasts, by Service (2020-2032) (USD Billion)
10.4.8.2 Japan Pharmaceutical and Life Sciences in Global Capability Centers (GCCs) Market Estimates and Forecasts, by Function (2020-2032) (USD Billion)
10.4.8.3 Japan Pharmaceutical and Life Sciences in Global Capability Centers (GCCs) Market Estimates and Forecasts, by Organizational Model (2020-2032) (USD Billion)
10.4.9 South Korea
10.4.9.1 South Korea Pharmaceutical and Life Sciences in Global Capability Centers (GCCs) Market Estimates and Forecasts, by Service (2020-2032) (USD Billion)
10.4.9.2 South Korea Pharmaceutical and Life Sciences in Global Capability Centers (GCCs) Market Estimates and Forecasts, by Function (2020-2032) (USD Billion)
10.4.9.3 South Korea Pharmaceutical and Life Sciences in Global Capability Centers (GCCs) Market Estimates and Forecasts, by Organizational Model (2020-2032) (USD Billion)
10.4.10 Vietnam
10.4.10.1 Vietnam Pharmaceutical and Life Sciences in Global Capability Centers (GCCs) Market Estimates and Forecasts, by Service (2020-2032) (USD Billion)
10.4.10.2 Vietnam Pharmaceutical and Life Sciences in Global Capability Centers (GCCs) Market Estimates and Forecasts, by Function (2020-2032) (USD Billion)
10.4.10.3 Vietnam Pharmaceutical and Life Sciences in Global Capability Centers (GCCs) Market Estimates and Forecasts, by Organizational Model (2020-2032) (USD Billion)
10.4.11 Singapore
10.4.11.1 Singapore Pharmaceutical and Life Sciences in Global Capability Centers (GCCs) Market Estimates and Forecasts, by Service (2020-2032) (USD Billion)
10.4.11.2 Singapore Pharmaceutical and Life Sciences in Global Capability Centers (GCCs) Market Estimates and Forecasts, by Function (2020-2032) (USD Billion)
10.4.11.3 Singapore Pharmaceutical and Life Sciences in Global Capability Centers (GCCs) Market Estimates and Forecasts, by Organizational Model (2020-2032) (USD Billion)
10.4.12 Australia
10.4.12.1 Australia Pharmaceutical and Life Sciences in Global Capability Centers (GCCs) Market Estimates and Forecasts, by Service (2020-2032) (USD Billion)
10.4.12.2 Australia Pharmaceutical and Life Sciences in Global Capability Centers (GCCs) Market Estimates and Forecasts, by Function (2020-2032) (USD Billion)
10.4.12.3 Australia Pharmaceutical and Life Sciences in Global Capability Centers (GCCs) Market Estimates and Forecasts, by Organizational Model (2020-2032) (USD Billion)
10.4.13 Rest of Asia Pacific
10.4.13.1 Rest of Asia Pacific Pharmaceutical and Life Sciences in Global Capability Centers (GCCs) Market Estimates and Forecasts, by Service (2020-2032) (USD Billion)
10.4.13.2 Rest of Asia Pacific Pharmaceutical and Life Sciences in Global Capability Centers (GCCs) Market Estimates and Forecasts, by Function (2020-2032) (USD Billion)
10.4.13.3 Rest of Asia Pacific Pharmaceutical and Life Sciences in Global Capability Centers (GCCs) Market Estimates and Forecasts, by Organizational Model (2020-2032) (USD Billion)
10.5 Middle East and Africa
10.5.1 Middle East
10.5.1.1 Trends Analysis
10.5.1.2 Middle East Pharmaceutical and Life Sciences in Global Capability Centers (GCCs) Market Estimates and Forecasts, by Country (2020-2032) (USD Billion)
10.5.1.3 Middle East Pharmaceutical and Life Sciences in Global Capability Centers (GCCs) Market Estimates and Forecasts, by Service (2020-2032) (USD Billion)
10.5.1.4 Middle East Pharmaceutical and Life Sciences in Global Capability Centers (GCCs) Market Estimates and Forecasts, by Function (2020-2032) (USD Billion)
10.5.1.5 Middle East Pharmaceutical and Life Sciences in Global Capability Centers (GCCs) Market Estimates and Forecasts, by Organizational Model (2020-2032) (USD Billion)
10.5.1.6 UAE
10.5.1.6.1 UAE Pharmaceutical and Life Sciences in Global Capability Centers (GCCs) Market Estimates and Forecasts, by Service (2020-2032) (USD Billion)
10.5.1.6.2 UAE Pharmaceutical and Life Sciences in Global Capability Centers (GCCs) Market Estimates and Forecasts, by Function (2020-2032) (USD Billion)
10.5.1.6.3 UAE Pharmaceutical and Life Sciences in Global Capability Centers (GCCs) Market Estimates and Forecasts, by Organizational Model (2020-2032) (USD Billion)
10.5.1.7 Egypt
10.5.1.7.1 Egypt Pharmaceutical and Life Sciences in Global Capability Centers (GCCs) Market Estimates and Forecasts, by Service (2020-2032) (USD Billion)
10.5.1.7.2 Egypt Pharmaceutical and Life Sciences in Global Capability Centers (GCCs) Market Estimates and Forecasts, by Function (2020-2032) (USD Billion)
10.5.1.7.3 Egypt Pharmaceutical and Life Sciences in Global Capability Centers (GCCs) Market Estimates and Forecasts, by Organizational Model (2020-2032) (USD Billion)
10.5.1.8 Saudi Arabia
10.5.1.8.1 Saudi Arabia Pharmaceutical and Life Sciences in Global Capability Centers (GCCs) Market Estimates and Forecasts, by Service (2020-2032) (USD Billion)
10.5.1.8.2 Saudi Arabia Pharmaceutical and Life Sciences in Global Capability Centers (GCCs) Market Estimates and Forecasts, by Function (2020-2032) (USD Billion)
10.5.1.8.3 Saudi Arabia Pharmaceutical and Life Sciences in Global Capability Centers (GCCs) Market Estimates and Forecasts, by Organizational Model (2020-2032) (USD Billion)
10.5.1.9 Qatar
10.5.1.9.1 Qatar Pharmaceutical and Life Sciences in Global Capability Centers (GCCs) Market Estimates and Forecasts, by Service (2020-2032) (USD Billion)
10.5.1.9.2 Qatar Pharmaceutical and Life Sciences in Global Capability Centers (GCCs) Market Estimates and Forecasts, by Function (2020-2032) (USD Billion)
10.5.1.9.3 Qatar Pharmaceutical and Life Sciences in Global Capability Centers (GCCs) Market Estimates and Forecasts, by Organizational Model (2020-2032) (USD Billion)
10.5.1.10 Rest of Middle East
10.5.1.10.1 Rest of Middle East Pharmaceutical and Life Sciences in Global Capability Centers (GCCs) Market Estimates and Forecasts, by Service (2020-2032) (USD Billion)
10.5.1.10.2 Rest of Middle East Pharmaceutical and Life Sciences in Global Capability Centers (GCCs) Market Estimates and Forecasts, by Function (2020-2032) (USD Billion)
10.5.1.10.3 Rest of Middle East Pharmaceutical and Life Sciences in Global Capability Centers (GCCs) Market Estimates and Forecasts, by Organizational Model (2020-2032) (USD Billion)
10.5.2 Africa
10.5.2.1 Trends Analysis
10.5.2.2 Africa Pharmaceutical and Life Sciences in Global Capability Centers (GCCs) Market Estimates and Forecasts, by Country (2020-2032) (USD Billion)
10.5.2.3 Africa Pharmaceutical and Life Sciences in Global Capability Centers (GCCs) Market Estimates and Forecasts, by Service (2020-2032) (USD Billion)
10.5.2.4 Africa Pharmaceutical and Life Sciences in Global Capability Centers (GCCs) Market Estimates and Forecasts, by Function (2020-2032) (USD Billion)
10.5.2.5 Africa Pharmaceutical and Life Sciences in Global Capability Centers (GCCs) Market Estimates and Forecasts, by Organizational Model (2020-2032) (USD Billion)
10.5.2.6 South Africa
10.5.2.6.1 South Africa Pharmaceutical and Life Sciences in Global Capability Centers (GCCs) Market Estimates and Forecasts, by Service (2020-2032) (USD Billion)
10.5.2.6.2 South Africa Pharmaceutical and Life Sciences in Global Capability Centers (GCCs) Market Estimates and Forecasts, by Function (2020-2032) (USD Billion)
10.5.2.6.3 South Africa Pharmaceutical and Life Sciences in Global Capability Centers (GCCs) Market Estimates and Forecasts, by Organizational Model (2020-2032) (USD Billion)
10.5.2.7 Nigeria
10.5.2.7.1 Nigeria Pharmaceutical and Life Sciences in Global Capability Centers (GCCs) Market Estimates and Forecasts, by Service (2020-2032) (USD Billion)
10.5.2.7.2 Nigeria Pharmaceutical and Life Sciences in Global Capability Centers (GCCs) Market Estimates and Forecasts, by Function (2020-2032) (USD Billion)
10.5.2.7.3 Nigeria Pharmaceutical and Life Sciences in Global Capability Centers (GCCs) Market Estimates and Forecasts, by Organizational Model (2020-2032) (USD Billion)
10.5.2.8 Rest of Africa
10.5.2.8.1 Rest of Africa Pharmaceutical and Life Sciences in Global Capability Centers (GCCs) Market Estimates and Forecasts, by Service (2020-2032) (USD Billion)
10.5.2.8.2 Rest of Africa Pharmaceutical and Life Sciences in Global Capability Centers (GCCs) Market Estimates and Forecasts, by Function (2020-2032) (USD Billion)
10.5.2.8.3 Rest of Africa Pharmaceutical and Life Sciences in Global Capability Centers (GCCs) Market Estimates and Forecasts, by Organizational Model (2020-2032) (USD Billion)
10.6 Latin America
10.6.1 Trends Analysis
10.6.2 Latin America Pharmaceutical and Life Sciences in Global Capability Centers (GCCs) Market Estimates and Forecasts, by Country (2020-2032) (USD Billion)
10.6.3 Latin America Pharmaceutical and Life Sciences in Global Capability Centers (GCCs) Market Estimates and Forecasts, by Service (2020-2032) (USD Billion)
10.6.4 Latin America Pharmaceutical and Life Sciences in Global Capability Centers (GCCs) Market Estimates and Forecasts, by Function (2020-2032) (USD Billion)
10.6.5 Latin America Pharmaceutical and Life Sciences in Global Capability Centers (GCCs) Market Estimates and Forecasts, by Organizational Model (2020-2032) (USD Billion)
10.6.6 Brazil
10.6.6.1 Brazil Pharmaceutical and Life Sciences in Global Capability Centers (GCCs) Market Estimates and Forecasts, by Service (2020-2032) (USD Billion)
10.6.6.2 Brazil Pharmaceutical and Life Sciences in Global Capability Centers (GCCs) Market Estimates and Forecasts, by Function (2020-2032) (USD Billion)
10.6.6.3 Brazil Pharmaceutical and Life Sciences in Global Capability Centers (GCCs) Market Estimates and Forecasts, by Organizational Model (2020-2032) (USD Billion)
10.6.7 Argentina
10.6.7.1 Argentina Pharmaceutical and Life Sciences in Global Capability Centers (GCCs) Market Estimates and Forecasts, by Service (2020-2032) (USD Billion)
10.6.7.2 Argentina Pharmaceutical and Life Sciences in Global Capability Centers (GCCs) Market Estimates and Forecasts, by Function (2020-2032) (USD Billion)
10.6.7.3 Argentina Pharmaceutical and Life Sciences in Global Capability Centers (GCCs) Market Estimates and Forecasts, by Organizational Model (2020-2032) (USD Billion)
10.6.8 Colombia
10.6.8.1 Colombia Pharmaceutical and Life Sciences in Global Capability Centers (GCCs) Market Estimates and Forecasts, by Service (2020-2032) (USD Billion)
10.6.8.2 Colombia Pharmaceutical and Life Sciences in Global Capability Centers (GCCs) Market Estimates and Forecasts, by Function (2020-2032) (USD Billion)
10.6.8.3 Colombia Pharmaceutical and Life Sciences in Global Capability Centers (GCCs) Market Estimates and Forecasts, by Organizational Model (2020-2032) (USD Billion)
10.6.9 Rest of Latin America
10.6.9.1 Rest of Latin America Pharmaceutical and Life Sciences in Global Capability Centers (GCCs) Market Estimates and Forecasts, by Service (2020-2032) (USD Billion)
10.6.9.2 Rest of Latin America Pharmaceutical and Life Sciences in Global Capability Centers (GCCs) Market Estimates and Forecasts, by Function (2020-2032) (USD Billion)
10.6.9.3 Rest of Latin America Pharmaceutical and Life Sciences in Global Capability Centers (GCCs) Market Estimates and Forecasts, by Organizational Model (2020-2032) (USD Billion)
11. Company Profiles
11.1 Accenture
11.1.1 Company Overview
11.1.2 Financial
11.1.3 Products/ Services Offered
11.1.4 SWOT Analysis
11.2 Cognizant
11.2.1 Company Overview
11.2.2 Financial
11.2.3 Products/ Services Offered
11.2.4 SWOT Analysis
11.3 Wipro
11.3.1 Company Overview
11.3.2 Financial
11.3.3 Products/ Services Offered
11.3.4 SWOT Analysis
11.4 IBM
11.4.1 Company Overview
11.4.2 Financial
11.4.3 Products/ Services Offered
11.4.4 SWOT Analysis
11.5 Tata Consultancy Services (TCS)
11.5.1 Company Overview
11.5.2 Financial
11.5.3 Products/ Services Offered
11.5.4 SWOT Analysis
11.6 Capgemini
11.6.1 Company Overview
11.6.2 Financial
11.6.3 Products/ Services Offered
11.6.4 SWOT Analysis
11.7 IQVIA
11.7.1 Company Overview
11.7.2 Financial
11.7.3 Products/ Services Offered
11.7.4 SWOT Analysis
11.8 Pfizer
11.8.1 Company Overview
11.8.2 Financial
11.8.3 Products/ Services Offered
11.8.4 SWOT Analysis
11.9 Roche
11.9.1 Company Overview
11.9.2 Financial
11.9.3 Products/ Services Offered
11.9.4 SWOT Analysis
11.10 Boehringer Ingelheim
11.10.1 Company Overview
11.10.2 Financial
11.10.3 Products/ Services Offered
11.10.4 SWOT Analysis
12. Use Cases and Best Practices
13. Conclusio
An accurate research report requires proper strategizing as well as implementation. There are multiple factors involved in the completion of good and accurate research report and selecting the best methodology to compete the research is the toughest part. Since the research reports we provide play a crucial role in any company’s decision-making process, therefore we at SNS Insider always believe that we should choose the best method which gives us results closer to reality. This allows us to reach at a stage wherein we can provide our clients best and accurate investment to output ratio.
Each report that we prepare takes a timeframe of 350-400 business hours for production. Starting from the selection of titles through a couple of in-depth brain storming session to the final QC process before uploading our titles on our website we dedicate around 350 working hours. The titles are selected based on their current market cap and the foreseen CAGR and growth.
The 5 steps process:
Step 1: Secondary Research:
Secondary Research or Desk Research is as the name suggests is a research process wherein, we collect data through the readily available information. In this process we use various paid and unpaid databases which our team has access to and gather data through the same. This includes examining of listed companies’ annual reports, Journals, SEC filling etc. Apart from this our team has access to various associations across the globe across different industries. Lastly, we have exchange relationships with various university as well as individual libraries.

Step 2: Primary Research
When we talk about primary research, it is a type of study in which the researchers collect relevant data samples directly, rather than relying on previously collected data. This type of research is focused on gaining content specific facts that can be sued to solve specific problems. Since the collected data is fresh and first hand therefore it makes the study more accurate and genuine.
We at SNS Insider have divided Primary Research into 2 parts.
Part 1 wherein we interview the KOLs of major players as well as the upcoming ones across various geographic regions. This allows us to have their view over the market scenario and acts as an important tool to come closer to the accurate market numbers. As many as 45 paid and unpaid primary interviews are taken from both the demand and supply side of the industry to make sure we land at an accurate judgement and analysis of the market.
This step involves the triangulation of data wherein our team analyses the interview transcripts, online survey responses and observation of on filed participants. The below mentioned chart should give a better understanding of the part 1 of the primary interview.

Part 2: In this part of primary research the data collected via secondary research and the part 1 of the primary research is validated with the interviews from individual consultants and subject matter experts.
Consultants are those set of people who have at least 12 years of experience and expertise within the industry whereas Subject Matter Experts are those with at least 15 years of experience behind their back within the same space. The data with the help of two main processes i.e., FGDs (Focused Group Discussions) and IDs (Individual Discussions). This gives us a 3rd party nonbiased primary view of the market scenario making it a more dependable one while collation of the data pointers.
Step 3: Data Bank Validation
Once all the information is collected via primary and secondary sources, we run that information for data validation. At our intelligence centre our research heads track a lot of information related to the market which includes the quarterly reports, the daily stock prices, and other relevant information. Our data bank server gets updated every fortnight and that is how the information which we collected using our primary and secondary information is revalidated in real time.

Step 4: QA/QC Process
After all the data collection and validation our team does a final level of quality check and quality assurance to get rid of any unwanted or undesired mistakes. This might include but not limited to getting rid of the any typos, duplication of numbers or missing of any important information. The people involved in this process include technical content writers, research heads and graphics people. Once this process is completed the title gets uploader on our platform for our clients to read it.
Step 5: Final QC/QA Process:
This is the last process and comes when the client has ordered the study. In this process a final QA/QC is done before the study is emailed to the client. Since we believe in giving our clients a good experience of our research studies, therefore, to make sure that we do not lack at our end in any way humanly possible we do a final round of quality check and then dispatch the study to the client.
Key Segments:
By Service
IT and Digital Transformation Services
Business Process Management (BPM)
Knowledge Process Outsourcing (KPO)
By Function
Research & Development
Manufacturing & Operations
Sales & Marketing
Regulatory Compliance & Quality Assurance
By Organizational Model
Captive Centers
Hybrid Centers
Outsourced Centers
Request for Segment Customization as per your Business Requirement: Segment Customization Request
Regional Coverage:
North America
US
Canada
Mexico
Europe
Eastern Europe
Poland
Romania
Hungary
Turkey
Rest of Eastern Europe
Western Europe
Germany
France
UK
Italy
Spain
Netherlands
Switzerland
Austria
Rest of Western Europe
Asia Pacific
China
India
Japan
South Korea
Vietnam
Singapore
Australia
Rest of Asia Pacific
Middle East & Africa
Middle East
UAE
Egypt
Saudi Arabia
Qatar
Rest of Middle East
Africa
Nigeria
South Africa
Rest of Africa
Latin America
Brazil
Argentina
Colombia
Rest of Latin America
Request for Country Level Research Report: Country Level Customization Request
Available Customization
With the given market data, SNS Insider offers customization as per the company’s specific needs. The following customization options are available for the report:
Product Analysis
Criss-Cross segment analysis (e.g. Product X Application)
Product Matrix which gives a detailed comparison of product portfolio of each company
Geographic Analysis
Additional countries in any of the regions
Company Information
Detailed analysis and profiling of additional market players (Up to five)
Autonomous Driving Software Market was valued at USD 1.78 billion in 2023 and is expected to reach USD 5.58 billion by 2032, growing at a CAGR of 13.58% from 2024-2032.
The Artificial Intelligence Toolkit Market was valued at USD 22.2 billion in 2023 and is expected to reach USD 151.2 billion by 2032, growing at a CAGR of 23.78% from 2024-2032.
The Bare Metal Cloud Market was valued at USD 8.47 billion in 2023 and is expected to reach USD 46.14 billion by 2032, growing at a CAGR of 20.77% over the forecast period 2024-2032.
The Enterprise Collaboration Market size was valued at USD 54.54 Billion in 2023 and is estimated to reach over USD 154.96 Billion in 2032 with an increasing CAGR of 12.30% From 2024-2032.
The Task Management Software Market size was valued at USD 3.3 Billion in 2023 and will grow to USD 9.17 Billion by 2032 and grow at a CAGR of 12.04% by 2032.
The Human-Centered AI Market Size was valued at USD 9.42 billion in 2023 and is expected to reach USD 53.47 billion by 2032 and grow at a CAGR of 21.28 % over the forecast period 2024-2032.

Hi! Click one of our member below to chat on Phone
© 2025 All Rights Reserved by SNS Insider Pvt Ltd


