Pet Wearable Market Size & Growth:
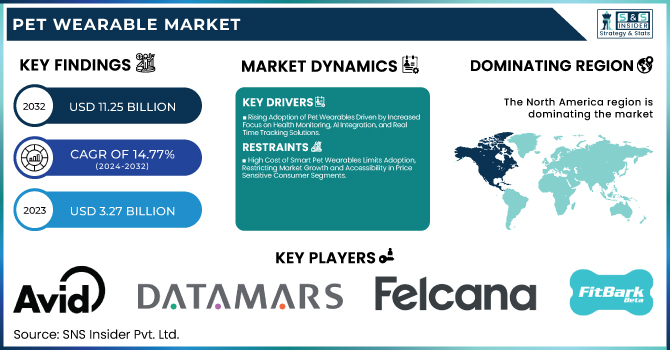
The Pet Wearable Market Size was valued at USD 3.27 billion in 2023 and is expected to reach USD 11.25 billion by 2032, growing at a CAGR of 14.77% from 2024-2032. This report includes an analysis of technological advancements & integration, consumer preferences & behavior, pricing trends, and the impact on pet healthcare & veterinary visits. The market is expanding rapidly due to innovations like GPS tracking, health monitoring, and AI-driven analytics. Consumers are increasingly adopting smart pet devices for safety and well-being, while pricing trends indicate growing affordability. Moreover, pet wearables are revolutionizing veterinary care by enabling early diagnosis and remote monitoring, further accelerating market growth.
To Get more information on Pet Wearable Market - Request Free Sample Report
Pet Wearable Market Dynamics
Drivers
-
Rising Adoption of Pet Wearables Driven by Increased Focus on Health Monitoring, AI Integration, and Real-Time Tracking Solutions.
Growing pet ownership, with increased pet health awareness, is fueling demand for sophisticated monitoring solutions. Owners are increasingly looking for real-time monitoring of vital signs, activity levels, and behavioral patterns to enable proactive pet care. IoT and AI integration in wearables allows for early disease detection, predictive analytics, and remote health monitoring, transforming pet healthcare into a data-driven and efficient process. Further, the growth of pet telehealth services and the use of wearable data by insurance companies for policy tailoring is also driving the market further. As pet humanization trends affect spending habits, consumers are making more investments in connected devices that promote pet health, safety, and longevity. The growth of smart pet ecosystems continues to redefine the industry, driving innovation in pet wearables.
Restraints
-
High Cost of Smart Pet Wearables Limits Adoption, Restricting Market Growth and Accessibility in Price-Sensitive Consumer Segments.
Smart collars and health trackers' premium pricing is a major impediment to mass adoption, especially in price-sensitive markets. The inclusion of sophisticated technologies such as IoT, AI, and GPS tracking raises production expenses, and hence these devices become unaffordable for most pet owners. Customers are reluctant to spend on expensive wearables unless they can perceive obvious value in terms of pet health advantage and cost savings over the long term. Furthermore, the absence of affordable alternatives limits accessibility, hindering market growth. To counter this obstacle, producers need to concentrate on cost-saving innovations, economies of scale, and adaptable pricing schemes. Wider adoption will depend on making pet wearables more affordable without compromising on essential features like real-time tracking and health monitoring.
Opportunities
-
Advancements in AI and IoT Drive Innovation in Smart Pet Wearables for Enhanced Health Monitoring and Real-Time Tracking
The growing integration of AI and IoT in pet wearables is transforming pet care by enabling real-time monitoring, predictive analytics, and automated health tracking. AI-driven algorithms examine pet behavior, identify anomalies, and issue early alerts for future health problems, enhancing veterinary treatment outcomes. IoT connectivity increases GPS tracking, geofencing, and remote control, guaranteeing pet safety and security. Furthermore, smart pet ecosystems that combine wearables with automated feeders, cameras, and health monitoring platforms are on the rise. As owners of pets look for smarter and data-driven solutions for pet health, manufacturers can capitalize on the opportunity to create innovative, connected, and user-friendly devices that meet the growing demand for technologically enabled pet care solutions.
Challenges
-
Durability and Comfort Issues in Pet Wearables Limit Continuous Usage, Requiring Improved Design, Lightweight Materials, and Enhanced Wearability Features.
Wearable devices should be designed to be used over the long term, but many devices struggle with durability and comfort issues that restrict their utility. Pets can become uncomfortable because of unwieldy design, excessive weight, or irritating materials. Also, active pets subject wearables to harsh conditions, resulting in quicker wear and tear. If devices are not wear-resistant enough to be able to survive daily use such as running, scratching, or water exposure, pet owners will be reluctant to spend money on them. Manufacturers need to ensure lightweight, pet-friendly materials and ergonomic design so that the durability and comfort can be achieved while ensuring wearability. Wearability can be boosted by flexible and adjustable straps as well as water resistance to help increase long-term adoption and usage in the pet wearable market.
Pet Wearable Market Segmentation Outlook
By Sales Channel
The online segment led the Pet Wearable Market in 2023 with the largest revenue share of around 57%. This is fueled by the growing demand for e-commerce websites, which provide extensive varieties of pet wearables at competitive prices, discounts, and doorstep delivery. Convenience, simple product comparison, and customer reviews also increase online sales. In addition, direct-to-consumer (DTC) sales by pet wearable companies through their websites and partnerships with leading online retailers improve access, which results in greater revenue generation.
The offline segment is also expected to grow at the fastest CAGR of approximately 16.18% during 2024-2032. The growth is driven by rising consumer interest in in-store product testing, personalization, and instant availability. Pet specialty retailers, veterinary hospitals, and retail stores offer hands-on demonstrations with verification of product quality and fit prior to purchase. Moreover, offline growth due to strategic collaborations and single-retail store offerings is boosting market penetration, especially in markets with low e-commerce penetration.
By Technology
The RFID segment led the Pet Wearable Market in 2023, accounting for the largest revenue share of around 44%. The segment's lead is due to the extensive use of RFID-based pet identification and tracking solutions, which are low-cost and passive tracking without needing continuous power. Veterinary clinics, shelters, and pet owners prefer using RFID microchips for permanent identification to help lost pets be easily reunited with their owners. Moreover, regulatory requirements and pet registration schemes further promote the adoption of RFID-based pet wearables.
The GPS segment is also expected to grow at the fastest CAGR of approximately 15.92% during the period from 2024 to 2032. This high growth is fueled by growing pet safety issues and mounting demand for real-time tracking systems. GPS-equipped pet wearables offer constant location tracking, geofencing, and activity monitoring, giving pet owners reassurance. Improvements in battery life, miniaturization, and integration with smartphone applications further increase convenience. With growing urbanization, pet owners want sophisticated GPS solutions to avoid pet loss and provide security.
By Animal Type
The dogs segment led the Pet Wearable Market in 2023 with the largest revenue share of around 67%. This is fueled by the greater global dog ownership rate and greater expenditure on canine health and safety. Pet owners proactively invest in smart collars, GPS tracking devices, and health monitoring wearables to promote pet well-being. Moreover, dogs need more outdoor exercise, which enhances the demand for location tracking and activity monitoring wearables. Growing awareness regarding pet fitness and training solutions also augments the market leadership of the segment.
The cats segment is expected to grow at the fastest CAGR of approximately 16.81% during 2024-2032. The growth is stimulated by the increasing adoption of cats, especially in urban regions, where compact living conditions prefer feline pets. Growing concerns regarding indoor and outdoor cat safety propel demand for GPS collars and health-monitoring wearables. Moreover, technological innovations in light, comfortable, and durable pet wearables prompt cat owners to spend on smart tracking and wellness solutions, fueling market growth.
By Application
The Identification & Tracking segment led the Pet Wearable Market in 2023, with the largest revenue share of around 62%. This is fueled by the growing demand for pet safety, real-time location tracking, and lost pet recovery solutions. RFID and GPS-based wearables are used extensively by pet owners for preventing loss of pets and ensuring safety. Also, increasing regulatory demands for pet registration and identification and increased adoption rates of pets have further driven the demand for smart tracking solutions.
The Medical Diagnosis & Treatment segment is expected to grow at the fastest CAGR of around 16.85% during the forecast period from 2024 to 2032. The growth is driven by increasing pet health monitoring awareness and growing usage of smart wearables for detecting diseases at an early stage. High-end pet health trackers that integrate AI and IoT allow continuous monitoring of heart rate, activity levels, and potential medical problems. Rising demand for preventative healthcare, and pet telemedicine technology, fuels market growth.
By Product
The Smart Collar segment controlled the Pet Wearable Market of 2023 with the maximum revenue share of around 62%. This dominance is fueled due to the ability of smart collars to become multifunctional, such as GPS tracking, activity monitoring, and health monitoring. Pet owners use smart collars for immediate location tracking, geofencing, and analysis of behavior. The convergence of IoT and AI also improves usability further, supporting features such as voice commands and remote viewing. Growing pet safety needs and technological progress drive adoption further.
The Smart Camera segment is expected to grow at the fastest CAGR of around 16.97% during the forecast period from 2024 to 2032. The reason for this growth is rising demand among pet owners for remote monitoring and interaction. Intelligent cameras with AI provide real-time video streaming, two-way communication, and motion detection for remote pet monitoring. Increasing humanization of pets and integration with smart home ecosystems add to the growth. Strong security features and increased worries regarding pet health spur market growth.
Pet Wearable Market Regional Analysis
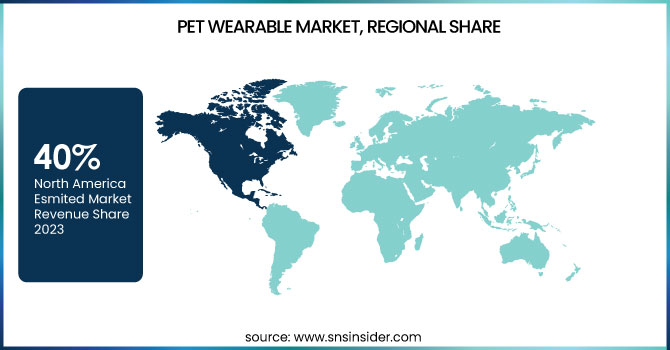
The North America region led the Pet Wearable Market in 2023, accounting for the largest revenue share of around 40%. This leadership is spurred by high rates of pet ownership, higher expenditures on pet care, and the dominant presence of major market players. Higher technological adoption, higher awareness of monitoring pet health, and the demand for GPS tracking solutions also contribute to market growth. The presence of favorable policies and the broad availability of smart pet products via online and offline channels also play a role in the region's leadership.
The Asia Pacific region is expected to grow at the fastest CAGR of around 16.62% during the forecast period from 2024 to 2032. This high growth is driven by rising pet adoption, growing disposable incomes, and expanding awareness of pet health and safety. Growing e-commerce platforms, technological innovations, and the growing popularity of smart pet solutions in nations such as China, Japan, and India are propelling demand. Also, urbanization and lifestyle changes are prompting pet owners to spend on wearable technologies, driving market growth.
Get Customized Report as per Your Business Requirement - Enquiry Now
Key Players
-
Avid Identification Systems, Inc. (Avid MicroChip, MiniTracker 3)
-
Datamars (PetLink Microchips, Microfindr Slim)
-
Felcana (Felcana Go, Helix Smart Collar)
-
FitBark Inc. (FitBark 2, FitBark GPS Dog Tracker)
-
Garmin Ltd. (Garmin Delta Smart, Garmin T5 Dog Device)
-
GoPro Inc. (GoPro Fetch Dog Harness, GoPro HERO10 Black)
-
LATSEN (Pawfit) (Pawfit 2 Pet Tracker, Pawfit 3 Pet Tracker)
-
Link My Pet (Link AKC Smart Collar, Link My Pet GPS Tracker)
-
Loc8tor Ltd. (Tabcat Pet Tracker, Loc8tor Lite)
-
Mars, Incorporated (Whistle Labs Inc.) (Whistle GO Explore, Whistle FIT)
-
PETFON (PETFON Pet GPS Tracker, PETFON 2 GPS Tracker)
-
PetPace (PetPace Smart Collar, PetPace Health Monitoring Service)
-
PetTech.co.uk Ltd. (No specific products found)
-
Tractive GmbH (Tractive GPS Dog Tracker, Tractive GPS Cat Tracker)
-
Indiegogo Inc. (No specific products found)
-
PawTrax Limited (PawTrax GPS Tracker, PawTrax Mini Tracker)
-
Dairymaster USA Inc. (MooMonitor+, Swiftflo Commander)
-
Afimilk Ltd. (AfiCollar, AfiAct II)
-
IceRobotics Ltd. (CowAlert, IceQube)
-
Dogtra (Dogtra Pathfinder, Dogtra 200C)
-
DogTelligent Inc. (DogTelligent Smart Collar, DogTelligent Leash)
-
Otto Petcare Systems (No specific products found)
-
Pod Trackers (Pod 3 GPS Tracker, Pod 2 GPS Tracker)
Recent Developments:
-
In 2024, Avid Identification Systems continues to offer the Avid FriendChip™, a permanent microchip identification solution for pets, livestock, and wildlife. The microchip features a 9-digit encrypted ID, ensuring unique identification and preventing identity fraud. It is resistant to X-rays and MRIs, providing long-lasting tracking for pet safety.
-
On May 28, 2023, Datamars acquired Kippy, a leading GPS pet tracker and activity monitoring solution. This acquisition enhances Datamars’ pet identification and reunification services, integrating GPS tracking, activity monitoring, and engagement features. Kippy’s collar device allows real-time tracking and health insights, strengthening Datamars’ global pet care ecosystem.
| Report Attributes | Details |
|---|---|
| Market Size in 2023 | USD 3.27 Billion |
| Market Size by 2032 | USD 11.25 Billion |
| CAGR | CAGR of 14.77% From 2024 to 2032 |
| Base Year | 2023 |
| Forecast Period | 2024-2032 |
| Historical Data | 2020-2022 |
| Report Scope & Coverage | Market Size, Segments Analysis, Competitive Landscape, Regional Analysis, DROC & SWOT Analysis, Forecast Outlook |
| Key Segments | • By Technology (RFID, GPS, Sensors) • By Product (Smart Collar, Smart Camera, Smart Harness and Vest, Others) • By Animal Type (Dogs, Cats, Other Animals) • By Application (Identification & Tracking, Behavior Monitoring & Control, Facilitation, Safety & Security, Medical Diagnosis & Treatment) • By Sales Channel (Online, Offline) |
| Regional Analysis/Coverage | North America (US, Canada, Mexico), Europe (Eastern Europe [Poland, Romania, Hungary, Turkey, Rest of Eastern Europe] Western Europe] Germany, France, UK, Italy, Spain, Netherlands, Switzerland, Austria, Rest of Western Europe]), Asia Pacific (China, India, Japan, South Korea, Vietnam, Singapore, Australia, Rest of Asia Pacific), Middle East & Africa (Middle East [UAE, Egypt, Saudi Arabia, Qatar, Rest of Middle East], Africa [Nigeria, South Africa, Rest of Africa], Latin America (Brazil, Argentina, Colombia, Rest of Latin America) |
| Company Profiles | Avid Identification Systems, Inc., Datamars, Felcana, FitBark Inc., Garmin Ltd., GoPro Inc., LATSEN (Pawfit), Link My Pet, Loc8tor Ltd., Mars, Incorporated (Whistle Labs Inc.), PETFON, PetPace, PetTech.co.uk Ltd., Tractive GmbH, Indiegogo Inc., PawTrax Limited, Dairymaster USA Inc., Afimilk Ltd., IceRobotics Ltd., Dogtra, DogTelligent Inc., Otto Petcare Systems, Pod Trackers. |
