image

Personal Mobility Device Market Key Insights:
Personal Mobility Device Market Revenue Analysis

Get More Information on Personal Mobility Device Market - Request Sample Report

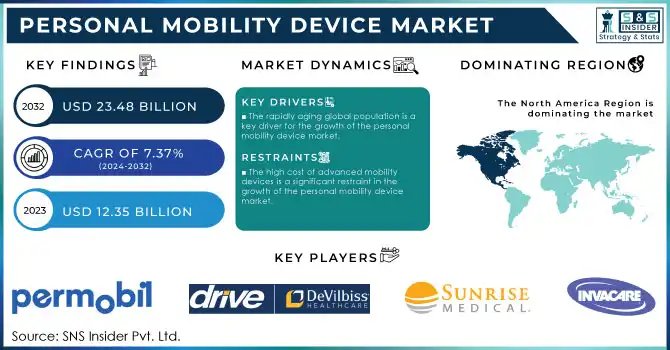
The Personal Mobility Device Market size was valued at USD 12.35 billion in 2023 and is expected to reach USD 23.48 billion by 2032, growing at a CAGR of 7.37% over the forecast period of 2024-2032.

Personal mobility devices are currently one of the fastest-growing industries worldwide because of factors that bring aging and heightened consciousness on disability rights of world populations coupled with improved mobility technologies. The market would comprise a myriad of goods, including wheelchairs, both electric and manual types, mobility scooters, walkers, crutches, canes, as well as other products to aid aged people due to accidents and suffering from the diseases and conditions like arthritis and neurological disorders. The World Health Organization forecasted that the population aged 60 years and over will reach 2 billion in 2050; this would also require a multiplied increase in personal mobility solutions.

These personal mobility devices have, in particular, gained popularity; especially electric wheelchairs and mobility scooters that feature adjustable seats, longer-lasting batteries, and improved steering capabilities. With an ever-increasing population suffering from mobility-related disabilities, new inventions in personal mobility devices continue to advance accessibility and improve quality of life.

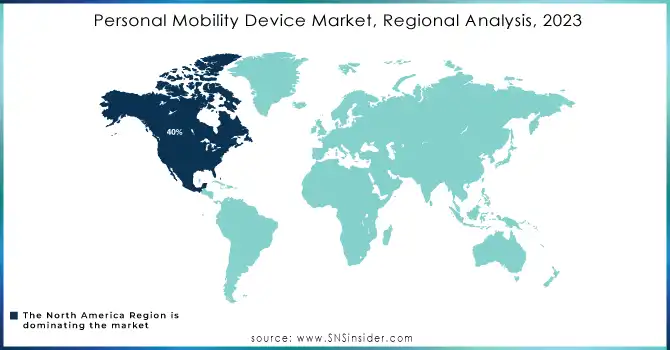
Currently, North America possesses the highest market share, with almost 40% of total revenue in 2023 due to the sophisticated healthcare infrastructure, increasing awareness of healthcare, and a very high rate of acceptance of technology-based mobility solutions. The Asia-Pacific region is simultaneously becoming an emerging market, with increased expenditure on health care and policy initiatives that aim at improving accessibility for disabled persons within such countries as China, Japan, and India.

An added factor that boosts market growth is the rise in disposable incomes in developing countries along with growing concern for inclusive design and technology. The personal mobility device market will grow at a fast pace due to the changes in the health systems that focus on elderly care.

Drivers

  • The rapidly aging global population is a key driver for the growth of the personal mobility device market. 

According to the WHO, the population aged 60 and older will be twice that of 2015 by 2050: 900 million people aged 60 and above, or about 2 billion, as estimated. When an individual ages, his or her likelihood of having mobility impairment from conditions such as arthritis, osteoporosis, and neurological disorders increases; hence, more mobility aids are needed. Some estimated of over 20 million people in the U.S. live with mobility-related disabilities, and this rate is expected to increase according to the aging of baby boomers. This created a need for advanced solutions towards higher-quality mobility, such as powered electric wheelchairs and powered mobility scooters, aimed at providing more independence among elderly people.

  • Technological Advancements and Enhanced Features in Mobility Devices

Technological innovation is the other major driver for the personal mobility device market. Advanced mobility aids are becoming very sophisticated, offering smart navigation, customizable seating, longer battery life, and connectivity to mobile apps. These improvements make mobility devices more user-friendly and efficient, which appeals to a wider population. The electric wheelchair segment, which comprised 30-35% of the global market share in 2023, continues to grow rapidly due to such technological enhancements. For instance, some electric wheelchairs now come with artificial intelligence (AI)--powered navigation systems that help the user avoid obstacles and ensure safety. As these devices become more affordable and accessible, their adoption rate is expected to rise, thus contributing significantly to the overall market growth.

Restraint

  • The high cost of advanced mobility devices is a significant restraint in the growth of the personal mobility device market.

Premium products like electric wheelchairs and mobility scooters, equipping themselves with AI navigation and much longer-lasting batteries, cost between USD 2,000 and USD 20,000. Those prices are often very unaffordable, particularly for the people in the low- and middle-income areas.

The World Health Organization (WHO) states that 75% of people with mobility impairments in low-income countries do not have access to assistive devices because of cost. This is particularly true in emerging markets where healthcare systems may not provide adequate reimbursement for mobility aids. Although demand for these devices is increasing, the high cost limits broader adoption, especially among elderly and disabled populations in economically challenged areas. Reducing prices or improving insurance and subsidy options will be critical to overcoming this challenge.

Segment Analysis

By product

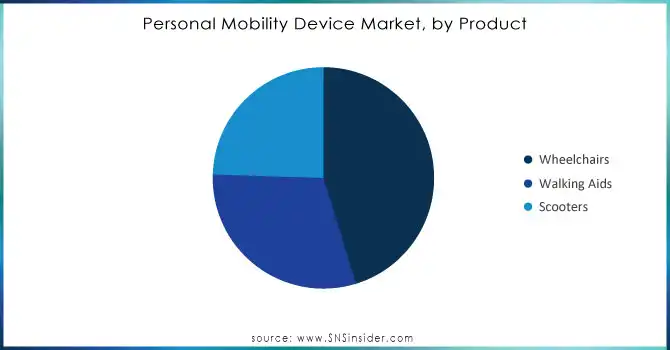
The wheelchair segment dominated the personal mobility device market, accounting for the largest revenue share of over 45% in 2023. This segment is expected to maintain its dominant position throughout the forecast period. Wheelchairs are among the most widely used assistive devices for personal mobility. The United Nations advocates for member states to support the development, production, distribution, and maintenance of these mobility aids. The use of an appropriate wheelchair improves the quality of life because it prevents issues like deformities and pressure sores and enhances digestion and respiration.

With around 2 million new users every year, the demand for wheelchairs is increasing. A major factor driving the growth of the wheelchair market is the aging population worldwide, the increase in chronic diseases, and an increased adoption of powered wheelchairs as a preferred option to enhance mobility.
Personal-Mobility-Device-Market-by-Product

Need Any Customization Research On Personal Mobility Device Market - Inquiry Now

By End-user

The household segment market is the dominant and by far the lead in the personal mobility devices industry market. The reason is related to the world's increasing trends and disabled people. Such people always need the tools for assistance in daily and routine work at their residences. More seniors prefer staying at home rather than being in an institution. Such mobility aid devices as electric wheelchairs, scooters, and walkers have therefore become important for everyday mobility. In 2023, the share of the household market segment has been over 40%. It will continue growing throughout the forecast period, given that the demand for personal mobility solutions increases with the needs of society. The trend of transitioning to independent living by both the elderly and the physically incapacitated also makes households the largest and most important customer group.

In the personal mobility device market, the long-term care centers segment was the fastest growing in 2023. In the long term, a rise in the elderly population will lead to an increased demand for institutionalized care, thus demanding mobility aids in long-term care centers. Long-term care centers require a broad range of mobility devices because patients of different levels of mobility impairment need to be accommodated, and thus this is the fastest-growing segment. The personal mobility device market in long-term care centers is expected to grow at a faster pace than the overall market, with its share projected to reach 20% by 2032. This growth is driven by the increasing need for better care infrastructure and a focus on improving the quality of life for elderly individuals in care environments.

Regional Analysis

North America dominated the personal mobility devices market with a 40% market share, primarily due to the large patient population in the region. For instance, according to data from the Bureau of Transportation Statistics, US Department of Transportation, about 25.5 million Americans have disabilities that make it difficult for them to travel outside their homes, fueling demand for mobility devices.

The European personal mobility devices market is the fastest-growing from 2023 to 2032, with key growth factors including good healthcare infrastructure, an aging population, a rise in old-age diseases, high expense on healthcare, and preferable reimbursement policies for purchasing and renting devices. Germany is its largest market share holder in Europe; however, the UK accounts for the fastest growth across the region.

The Asia Pacific region holds the second-largest market share in this industry. This growth is being fueled by several factors, an increase in the elderly population, especially in East Asian nations such as China and Japan; a growing awareness about mobility devices; an increased incidence of limb dysfunction and disorders; and better access to healthcare. In this region, the country leading the market in personal mobility devices is China, and the fastest-growing market is India.
Personal-Mobility-Device-Market-Regional-Analysis-2023

Key Market Players

  • Invacare Corporation (TDX SP2 Power Wheelchair, Rollite Rollator Walker)

  • Sunrise Medical (Quickie Q500 M Power Wheelchair, Airgo Comfort-Plus Lightweight Rollator)

  • Drive DeVilbiss Healthcare (Titan AXS Electric Wheelchair, Nitro Euro Style Rollator)

  • Pride Mobility Products Corp. (Go-Go Elite Traveller Mobility Scooter, Jazzy 600 ES Power Chair)

  • Permobil (Permobil F5 Corpus Power Wheelchair, Explorer Mini Pediatric Mobility Device)

  • Ottobock (Juvo B5/B6 Wheelchair, Walker Active Pediatric Walker)

  • Medline Industries (Empower Rollator Walker, Medline Basic Lightweight Wheelchair)

  • Karman Healthcare (S-305 Lightweight Ergonomic Wheelchair, LT-1000 Transport Wheelchair)

  • Hoveround Corporation (MPV5 Power Chair, Teknique XHD Heavy-Duty Power Chair)

  • Graham-Field (Walkabout Lite Rollator, HybridLX Rollator & Transport Chair)

  • GF Health Products, Inc. (Lumex Deluxe Four-Wheel Rollator, Everest & Jennings Traveler Wheelchair)

  • Magic Mobility (Extreme X8 Power Chair, Frontier V6 All-Terrain Wheelchair)

  • Invamed (Invamed Voyager Power Wheelchair, Smart Invamed Lightweight Rollator)

  • Merits Health Products (Pioneer 10 Scooter, Vision Sport Power Wheelchair)

  • Golden Technologies (Buzzaround EX Extreme Mobility Scooter, Compass Sport Power Chair)

  • Handicare Group (Minivator 2000 Stairlift, Gemino 60 Rollator)

  • Shoprider Mobility Products (Streamer Sport Power Wheelchair, Dasher 3 Scooter)

  • Yuwell-Jiangsu Yuyue Medical Equipment & Supply Co. (H-009 Aluminum Wheelchair, Yuwell Foldable Electric Scooter)

  • Nova Medical Products (Vibe 6 Rollator, Transport Chair with Hand Brakes)

  • ErgoActives (Ergobaum 7G Forearm Crutch, iWalk 2.0 Hands-Free Crutch)

Key Suppliers

key suppliers that provide components, raw materials, or manufacturing services for personal mobility devices such as wheelchairs, scooters, and walkers:

  • Invacare Corporation Suppliers

  • Pride Mobility Products Corp. Suppliers

  • Permobil Suppliers

  • Sunrise Medical Suppliers

  • Drive DeVilbiss Healthcare Suppliers

  • Karman Healthcare Suppliers

  • Golden Technologies Suppliers

  • Handicare Group Suppliers

  • Yuwell Medical Equipment Suppliers

  • Nova Medical Products Suppliers

Recent Developments

  • In September 2024, Sunrise Medical introduced the Empulse, a highly anticipated addition to its portfolio. This new product line features state-of-the-art advancements, including enhanced battery performance, ergonomic designs, and customizable options tailored to diverse user needs. The Empulse aims to set new standards for assistive mobility technology.

  • In June 2024, Drive DeVilbiss Healthcare expanded its market presence by acquiring the innovative product portfolio of Mobility Designed. Known for ergonomic and user-focused designs, Mobility Designed’s products align with Drive DeVilbiss's mission to offer high-quality mobility solutions. This acquisition is expected to drive further innovation in the design and functionality of mobility aids.

  • In November 2023, Permobil unveiled updates to its product line, focusing on enhanced accessibility and functionality for users. The updates included improvements to power wheelchairs, seating systems, and assistive technology. Permobil emphasized its commitment to creating solutions that promote independence and ease of use for individuals with mobility challenges.

Personal Mobility Device Market Report Scope:

Report Attributes Details
Market Size in 2023 US$ 12.35 Billion
Market Size by 2032 US$ 23.48 Billion
CAGR CAGR of 7.37% From 2024 to 2032
Base Year 2023
Forecast Period 2024-2032
Historical Data 2020-2022
Report Scope & Coverage Market Size, Segments Analysis, Competitive  Landscape, Regional Analysis, DROC & SWOT Analysis, Forecast Outlook
Key Segments •By Product (Walking Aids, Wheelchairs, Scooters)
•By End User (Hospitals & Clinics, Long-term Care Centers, Households, Others)
Regional Analysis/Coverage North America (US, Canada, Mexico), Europe (Eastern Europe [Poland, Romania, Hungary, Turkey, Rest of Eastern Europe] Western Europe] Germany, France, UK, Italy, Spain, Netherlands, Switzerland, Austria, Rest of Western Europe]), Asia Pacific (China, India, Japan, South Korea, Vietnam, Singapore, Australia, Rest of Asia Pacific), Middle East & Africa (Middle East [UAE, Egypt, Saudi Arabia, Qatar, Rest of Middle East], Africa [Nigeria, South Africa, Rest of Africa], Latin America (Brazil, Argentina, Colombia, Rest of Latin America)
Company Profiles Invacare Corporation, Sunrise Medical, Drive DeVilbiss Healthcare, Pride Mobility Products Corp., Permobil, Ottobock, Medline Industries, Karman Healthcare, Hoveround Corporation, Graham-Field, GF Health Products, Inc., Magic Mobility, Invamed, Merits Health Products, Golden Technologies, Handicare Group, Shoprider Mobility Products, Yuwell-Jiangsu Yuyue Medical Equipment & Supply Co., Nova Medical Products, ErgoActives, and other players.
Key Drivers •The rapidly aging global population is a key driver for the growth of the personal mobility device market.
•Technological Advancements and Enhanced Features in Mobility Devices
Restraints •The high cost of advanced mobility devices is a significant restraint in the growth of the personal mobility device market.

Frequently Asked Questions

Ans- The Personal Mobility Device Market was valued at USD 12.35 billion in 2023 and is expected to reach USD 23.48 billion by 2032.

Ans – The CAGR rate of the Personal Mobility Device Market during 2024-2032 is 7.37%.

Ans- The wheelchairs segment dominated the market by 45%

Ans- North America held the largest revenue share by 40%.

Ans- Europe is the fastest-growing region in the Personal Mobility Device Market.

Table of Contents

1. Introduction

1.1 Market Definition

1.2 Scope (Inclusion and Exclusions)

1.3 Research Assumptions

2. Executive Summary

2.1 Market Overview

2.2 Regional Synopsis

2.3 Competitive Summary

3. Research Methodology

3.1 Top-Down Approach

3.2 Bottom-up Approach

3.3. Data Validation

3.4 Primary Interviews

4. Market Dynamics Impact Analysis

4.1 Market Driving Factors Analysis

4.1.2 Drivers

4.1.2 Restraints

4.1.3 Opportunities

4.1.4 Challenges

4.2 PESTLE Analysis

    1. Porter’s Five Forces Model

5. Statistical Insights and Trends Reporting

5.1 Incidence and Prevalence (2023)

5.2 Prescription Trends, (2023), by Region

5.3 Device Volume, by Region (2020-2032)

5.4 Healthcare Spending, by Region, (Government, Commercial, Private, Out-of-Pocket), 2023

6. Competitive Landscape

6.1 List of Major Companies, By Region

6.2 Market Share Analysis, By Region

6.3 Product Benchmarking

6.3.1 Product specifications and features

6.3.2 Pricing

6.4 Strategic Initiatives

6.4.1 Marketing and promotional activities

6.4.2 Distribution and Supply Chain Strategies

6.4.3 Expansion plans and new product launches

6.4.4 Strategic partnerships and collaborations

6.5 Technological Advancements

6.6 Market Positioning and Branding

7. Personal Mobility Devices Market Segmentation, by Product

7.1 Chapter Overview

7.2 Walking Aids

7.2.1 Walking Aids Market Trends Analysis (2020-2032)

7.2.2 Walking Aids Market Size Estimates and Forecasts to 2032 (USD Billion)

7.2.3 Rollators

7.2.3.1 Rollators Market Trends Analysis (2020-2032)

7.2.3.2 Rollators Market Size Estimates and Forecasts to 2032 (USD Billion)

7.2.3.3 Premium Rollators

7.2.3.3.1 Premium Rollators Market Trends Analysis (2020-2032)

7.2.3.3.2 Premium Rollators Market Size Estimates and Forecasts to 2032 (USD Billion)

7.2.3.4 Low-Cost Rollators

7.2.3.4.1 Low-Cost Rollators Market Trends Analysis (2020-2032)

7.2.3.4.2 Low-Cost Rollators Market Size Estimates and Forecasts to 2032 (USD Billion)

7.2.4 Wheelchairs

7.2.4.1 Wheelchairs Market Trends Analysis (2020-2032)

7.2.4.2 Wheelchairs Market Size Estimates and Forecasts to 2032 (USD Billion)

7.2.4.3 Manual wheelchairs

7.2.4.3.1Manual Wheelchairs Market Trends Analysis (2020-2032)

7.2.4.3.2 Manual Wheelchairs Market Size Estimates and Forecasts to 2032 (USD Billion)

7.2.3.4 Powered Wheelchairs

7.2.3.4.1 Powered Wheelchairs Market Trends Analysis (2020-2032)

7.2.3.4.2 Powered Wheelchairs Market Size Estimates and Forecasts to 2032 (USD Billion)

7.2.4 Scooters

7.2.4.1 Scooters Market Trends Analysis (2020-2032)

7.2.4.2 Scooters Market Size Estimates and Forecasts to 2032 (USD Billion)


8. Personal Mobility Devices Market Segmentation, by End User

8.1 Chapter Overview

8.2 Hospitals & Clinics

8.2.1 Hospitals & Clinics Market Trends Analysis (2020-2032)

8.2.2 Hospitals & Clinics Market Size Estimates and Forecasts to 2032 (USD Billion)

8.3 Long-term Care Centers

8.3.1 Long-term Care Centers Market Trends Analysis (2020-2032)

8.3.2 Long-term Care Centers Market Size Estimates and Forecasts to 2032 (USD Billion)

8.4 Households

8.4.1 Households Market Trends Analysis (2020-2032)

8.4.2 Households Market Size Estimates and Forecasts to 2032 (USD Billion)

8.5 Others

8.5.1 Others Market Trends Analysis (2020-2032)

8.5.2 Others Market Size Estimates and Forecasts to 2032 (USD Billion)


9. Regional Analysis

9.1 Chapter Overview

9.2 North America

9.2.1 Trends Analysis

9.2.2 North America Personal Mobility Devices Market Estimates and Forecasts, by Country (2020-2032) (USD Billion)

9.2.3 North America Personal Mobility Devices Market Estimates and Forecasts, by Product (2020-2032) (USD Billion)  

9.2.4 North America Personal Mobility Devices Market Estimates and Forecasts, by End-Use (2020-2032) (USD Billion)

9.2.5 USA

9.2.5.1 USA Personal Mobility Devices Market Estimates and Forecasts, by Product (2020-2032) (USD Billion)

9.2.5.2 USA Personal Mobility Devices Market Estimates and Forecasts, by End-Use (2020-2032) (USD Billion)

9.2.6 Canada

9.2.6.1 Canada Personal Mobility Devices Market Estimates and Forecasts, by Product (2020-2032) (USD Billion)

9.2.6.2 Canada Personal Mobility Devices Market Estimates and Forecasts, by End-Use (2020-2032) (USD Billion)

9.2.7 Mexico

9.2.7.1 Mexico Personal Mobility Devices Market Estimates and Forecasts, by Product (2020-2032) (USD Billion)

9.2.7.2 Mexico Personal Mobility Devices Market Estimates and Forecasts, by End-Use (2020-2032) (USD Billion)

9.3 Europe

9.3.1 Eastern Europe

9.3.1.1 Trends Analysis

9.3.1.2 Eastern Europe Personal Mobility Devices Market Estimates and Forecasts, by Country (2020-2032) (USD Billion)

9.3.1.3 Eastern Europe Personal Mobility Devices Market Estimates and Forecasts, by Product (2020-2032) (USD Billion)  

9.3.1.4 Eastern Europe Personal Mobility Devices Market Estimates and Forecasts, by End-Use (2020-2032) (USD Billion)

9.3.1.5 Poland

9.3.1.5.1 Poland Personal Mobility Devices Market Estimates and Forecasts, by Product (2020-2032) (USD Billion)

9.3.1.5.2 Poland Personal Mobility Devices Market Estimates and Forecasts, by End-Use (2020-2032) (USD Billion)

9.3.1.6 Romania

9.3.1.6.1 Romania Personal Mobility Devices Market Estimates and Forecasts, by Product (2020-2032) (USD Billion)

9.3.1.6.2 Romania Personal Mobility Devices Market Estimates and Forecasts, by End-Use (2020-2032) (USD Billion)

9.3.1.7 Hungary

9.3.1.7.1 Hungary Personal Mobility Devices Market Estimates and Forecasts, by Product (2020-2032) (USD Billion)

9.3.1.7.2 Hungary Personal Mobility Devices Market Estimates and Forecasts, by End-Use (2020-2032) (USD Billion)

9.3.1.8 Turkey

9.3.1.8.1 Turkey Personal Mobility Devices Market Estimates and Forecasts, by Product (2020-2032) (USD Billion)

9.3.1.8.2 Turkey Personal Mobility Devices Market Estimates and Forecasts, by End-Use (2020-2032) (USD Billion)

9.3.1.9 Rest of Eastern Europe

9.3.1.9.1 Rest of Eastern Europe Personal Mobility Devices Market Estimates and Forecasts, by Product (2020-2032) (USD Billion)

9.3.1.9.2 Rest of Eastern Europe Personal Mobility Devices Market Estimates and Forecasts, by End-Use (2020-2032) (USD Billion)

9.3.2 Western Europe

9.3.2.1 Trends Analysis

9.3.2.2 Western Europe Personal Mobility Devices Market Estimates and Forecasts, by Country (2020-2032) (USD Billion)

9.3.2.3 Western Europe Personal Mobility Devices Market Estimates and Forecasts, by Product (2020-2032) (USD Billion)  

9.3.2.4 Western Europe Personal Mobility Devices Market Estimates and Forecasts, by End-Use (2020-2032) (USD Billion)

9.3.2.5 Germany

9.3.2.5.1 Germany Personal Mobility Devices Market Estimates and Forecasts, by Product (2020-2032) (USD Billion)

9.3.2.5.2 Germany Personal Mobility Devices Market Estimates and Forecasts, by End-Use (2020-2032) (USD Billion)

9.3.2.6 France

9.3.2.6.1 France Personal Mobility Devices Market Estimates and Forecasts, by Product (2020-2032) (USD Billion)

9.3.2.6.2 France Personal Mobility Devices Market Estimates and Forecasts, by End-Use (2020-2032) (USD Billion)

9.3.2.7 UK

9.3.2.7.1 UK Personal Mobility Devices Market Estimates and Forecasts, by Product (2020-2032) (USD Billion)

9.3.2.7.2 UK Personal Mobility Devices Market Estimates and Forecasts, by End-Use (2020-2032) (USD Billion)

9.3.2.8 Italy

9.3.2.8.1 Italy Personal Mobility Devices Market Estimates and Forecasts, by Product (2020-2032) (USD Billion)

9.3.2.8.2 Italy Personal Mobility Devices Market Estimates and Forecasts, by End-Use (2020-2032) (USD Billion)

9.3.2.9 Spain

9.3.2.9.1 Spain Personal Mobility Devices Market Estimates and Forecasts, by Product (2020-2032) (USD Billion)

9.3.2.9.2 Spain Personal Mobility Devices Market Estimates and Forecasts, by End-Use (2020-2032) (USD Billion)

9.3.2.10 Netherlands

9.3.2.10.1 Netherlands Personal Mobility Devices Market Estimates and Forecasts, by Product (2020-2032) (USD Billion)

9.3.2.10.2 Netherlands Personal Mobility Devices Market Estimates and Forecasts, by End-Use (2020-2032) (USD Billion)

9.3.2.11 Switzerland

9.3.2.11.1 Switzerland Personal Mobility Devices Market Estimates and Forecasts, by Product (2020-2032) (USD Billion)

9.3.2.11.2 Switzerland Personal Mobility Devices Market Estimates and Forecasts, by End-Use (2020-2032) (USD Billion)

9.3.2.12 Austria

9.3.2.12.1 Austria Healthcare Predictive Analytic Market Estimates and Forecasts, by Product (2020-2032) (USD Billion)

9.3.2.12.2 Austria Personal Mobility Devices Market Estimates and Forecasts, by End-Use (2020-2032) (USD Billion)

9.3.2.13 Rest of Western Europe

9.3.2.13.1 Rest of Western Europe Personal Mobility Devices Market Estimates and Forecasts, by Product (2020-2032) (USD Billion)

9.3.2.13.2 Rest of Western Europe Personal Mobility Devices Market Estimates and Forecasts, by End-Use (2020-2032) (USD Billion)

9.4 Asia Pacific

9.4.1 Trends Analysis

9.4.2 Asia Pacific Personal Mobility Devices Market Estimates and Forecasts, by Country (2020-2032) (USD Billion)

9.4.3 Asia Pacific Personal Mobility Devices Market Estimates and Forecasts, by Product (2020-2032) (USD Billion)  

9.4.4 Asia Pacific Personal Mobility Devices Market Estimates and Forecasts, by End-Use (2020-2032) (USD Billion)

9.4.5 China

9.4.5.1 China Personal Mobility Devices Market Estimates and Forecasts, by Product (2020-2032) (USD Billion)

9.4.5.2 China Personal Mobility Devices Market Estimates and Forecasts, by End-Use (2020-2032) (USD Billion)

9.4.6 India

9.4.5.1 India Personal Mobility Devices Market Estimates and Forecasts, by Product (2020-2032) (USD Billion)

9.4.5.2 India Personal Mobility Devices Market Estimates and Forecasts, by End-Use (2020-2032) (USD Billion)

9.4.5 Japan

9.4.5.1 Japan Personal Mobility Devices Market Estimates and Forecasts, by Product (2020-2032) (USD Billion)

9.4.5.2 Japan Personal Mobility Devices Market Estimates and Forecasts, by End-Use (2020-2032) (USD Billion)

9.4.6 South Korea

9.4.6.1 South Korea Personal Mobility Devices Market Estimates and Forecasts, by Product (2020-2032) (USD Billion)

9.4.6.2 South Korea Personal Mobility Devices Market Estimates and Forecasts, by End-Use (2020-2032) (USD Billion)

9.4.7 Vietnam

9.4.7.1 Vietnam Personal Mobility Devices Market Estimates and Forecasts, by Product (2020-2032) (USD Billion)

9.2.7.2 Vietnam Healthcare Predictive Analytic Market Estimates and Forecasts, by End-Use (2020-2032) (USD Billion)

9.4.8 Singapore

9.4.8.1 Singapore Personal Mobility Devices Market Estimates and Forecasts, by Product (2020-2032) (USD Billion)

9.4.8.2 Singapore Personal Mobility Devices Market Estimates and Forecasts, by End-Use (2020-2032) (USD Billion)

9.4.9 Australia

9.4.9.1 Australia Personal Mobility Devices Market Estimates and Forecasts, by Product (2020-2032) (USD Billion)

9.4.9.2 Australia Personal Mobility Devices Market Estimates and Forecasts, by End-Use (2020-2032) (USD Billion)

9.4.10 Rest of Asia Pacific

9.4.10.1 Rest of Asia Pacific Personal Mobility Devices Market Estimates and Forecasts, by Product (2020-2032) (USD Billion)

9.4.10.2 Rest of Asia Pacific Personal Mobility Devices Market Estimates and Forecasts, by End-Use (2020-2032) (USD Billion)

9.5 Middle East and Africa

9.5.1 Middle East

9.5.1.1 Trends Analysis

9.5.1.2 Middle East Personal Mobility Devices Market Estimates and Forecasts, by Country (2020-2032) (USD Billion)

9.5.1.3 Middle East Personal Mobility Devices Market Estimates and Forecasts, by Product (2020-2032) (USD Billion)  

9.5.1.4 Middle East Personal Mobility Devices Market Estimates and Forecasts, by End-Use (2020-2032) (USD Billion)

9.5.1.5 UAE

9.5.1.5.1 UAE Personal Mobility Devices Market Estimates and Forecasts, by Product (2020-2032) (USD Billion)

9.5.1.5.2 UAE Personal Mobility Devices Market Estimates and Forecasts, by End-Use (2020-2032) (USD Billion)

9.5.1.6 Egypt

9.5.1.6.1 Egypt Personal Mobility Devices Market Estimates and Forecasts, by Product (2020-2032) (USD Billion)

9.5.1.6.2 Egypt Personal Mobility Devices Market Estimates and Forecasts, by End-Use (2020-2032) (USD Billion)

9.5.1.7 Saudi Arabia

9.5.1.7.1 Saudi Arabia Personal Mobility Devices Market Estimates and Forecasts, by Product (2020-2032) (USD Billion)

9.5.1.7.2 Saudi Arabia Personal Mobility Devices Market Estimates and Forecasts, by End-Use (2020-2032) (USD Billion)

9.5.1.8 Qatar

9.5.1.8.1 Qatar Personal Mobility Devices Market Estimates and Forecasts, by Product (2020-2032) (USD Billion)

9.5.1.8.2 Qatar Personal Mobility Devices Market Estimates and Forecasts, by End-Use (2020-2032) (USD Billion)

9.5.1.9 Rest of Middle East

9.5.1.9.1 Rest of Middle East Personal Mobility Devices Market Estimates and Forecasts, by Product (2020-2032) (USD Billion)

9.5.1.9.2 Rest of Middle East Personal Mobility Devices Market Estimates and Forecasts, by End-Use (2020-2032) (USD Billion)

9.5.2 Africa

9.5.2.1 Trends Analysis

9.5.2.2 Africa Personal Mobility Devices Market Estimates and Forecasts, by Country (2020-2032) (USD Billion)

9.5.2.3 Africa Personal Mobility Devices Market Estimates and Forecasts, by Product (2020-2032) (USD Billion)  

9.5.2.4 Africa Personal Mobility Devices Market Estimates and Forecasts, by End-Use (2020-2032) (USD Billion)

9.5.2.5 South Africa

9.5.2.5.1 South Africa Personal Mobility Devices Market Estimates and Forecasts, by Product (2020-2032) (USD Billion)

9.5.2.5.2 South Africa Personal Mobility Devices Market Estimates and Forecasts, by End-Use (2020-2032) (USD Billion)

9.5.2.6 Nigeria

9.5.2.6.1 Nigeria Personal Mobility Devices Market Estimates and Forecasts, by Product (2020-2032) (USD Billion)

9.5.2.6.2 Nigeria Personal Mobility Devices Market Estimates and Forecasts, by End-Use (2020-2032) (USD Billion)

9.5.2.7 Rest of Africa

9.5.2.7.1 Rest of Africa Personal Mobility Devices Market Estimates and Forecasts, by Product (2020-2032) (USD Billion)

9.5.2.7.2 Rest of Africa Personal Mobility Devices Market Estimates and Forecasts, by End-Use (2020-2032) (USD Billion)

9.6 Latin America

9.6.1 Trends Analysis

9.6.2 Latin America Personal Mobility Devices Market Estimates and Forecasts, by Country (2020-2032) (USD Billion)

9.6.3 Latin America Personal Mobility Devices Market Estimates and Forecasts, by Product (2020-2032) (USD Billion)  

9.6.4 Latin America Personal Mobility Devices Market Estimates and Forecasts, by End-Use (2020-2032) (USD Billion)

9.6.5 Brazil

9.6.5.1 Brazil Personal Mobility Devices Market Estimates and Forecasts, by Product (2020-2032) (USD Billion)

9.6.5.2 Brazil Personal Mobility Devices Market Estimates and Forecasts, by End-Use (2020-2032) (USD Billion)

9.6.6 Argentina

9.6.6.1 Argentina Personal Mobility Devices Market Estimates and Forecasts, by Product (2020-2032) (USD Billion)

9.6.6.2 Argentina Personal Mobility Devices Market Estimates and Forecasts, by End-Use (2020-2032) (USD Billion)

9.6.7 Colombia

9.6.7.1 Colombia Personal Mobility Devices Market Estimates and Forecasts, by Product (2020-2032) (USD Billion)

9.6.7.2 Colombia Personal Mobility Devices Market Estimates and Forecasts, by End-Use (2020-2032) (USD Billion)

9.6.8 Rest of Latin America

9.6.8.1 Rest of Latin America Personal Mobility Devices Market Estimates and Forecasts, by Product (2020-2032) (USD Billion)

9.6.8.2 Rest of Latin America Personal Mobility Devices Market Estimates and Forecasts, by End-Use (2020-2032) (USD Billion)

10. Company Profiles

10.1 Invacare Corporation

10.1.1 Company Overview

10.1.2 Financial

10.1.3 Products/ Services Offered

110.1.4 SWOT Analysis

10.2 Sunrise Medical

10.2.1 Company Overview

10.2.2 Financial

10.2.3 Products/ Services Offered

10.2.4 SWOT Analysis

10.3 Drive DeVilbiss Healthcare

             10.3.1 Company Overview

10.3.2 Financial

10.3.3 Products/ Services Offered

10.3.4 SWOT Analysis

10.4 Pride Mobility Products Corp.

10.4.1 Company Overview

10.4.2 Financial

10.4.3 Products/ Services Offered

10.4.4 SWOT Analysis

10.5 Permobil

             10.5.1 Company Overview

10.5.2 Financial

10.5.3 Products/ Services Offered

10.5.4 SWOT Analysis

10.6 Ottobock

             10.6.1 Company Overview

10.6.2 Financial

10.6.3 Products/ Services Offered

10.6.4 SWOT Analysis

10.7 Medline Industries

             10.7.1 Company Overview

10.7.2 Financial

10.7.3 Products/ Services Offered

10.7.4 SWOT Analysis

10.8 Hoveround Corporation

10.8.1 Company Overview

10.8.2 Financial

10.8.3 Products/ Services Offered

10.8.4 SWOT Analysis

10.9 Graham-Field

10.9.1 Company Overview

10.9.2 Financial

10.9.3 Products/ Services Offered

10.9.4 SWOT Analysis

10.10 GF Health Products, Inc.

             10.9.1 Company Overview

10.9.2 Financial

10.9.3 Products/ Services Offered

10.9.4 SWOT Analysis

11. Use Cases and Best Practices

12. Conclusion

An accurate research report requires proper strategizing as well as implementation. There are multiple factors involved in the completion of good and accurate research report and selecting the best methodology to compete the research is the toughest part. Since the research reports we provide play a crucial role in any company’s decision-making process, therefore we at SNS Insider always believe that we should choose the best method which gives us results closer to reality. This allows us to reach at a stage wherein we can provide our clients best and accurate investment to output ratio.

Each report that we prepare takes a timeframe of 350-400 business hours for production. Starting from the selection of titles through a couple of in-depth brain storming session to the final QC process before uploading our titles on our website we dedicate around 350 working hours. The titles are selected based on their current market cap and the foreseen CAGR and growth.


The 5 steps process:

Step 1: Secondary Research:

Secondary Research or Desk Research is as the name suggests is a research process wherein, we collect data through the readily available information. In this process we use various paid and unpaid databases which our team has access to and gather data through the same. This includes examining of listed companies’ annual reports, Journals, SEC filling etc. Apart from this our team has access to various associations across the globe across different industries. Lastly, we have exchange relationships with various university as well as individual libraries.

Secondary Research

Step 2: Primary Research

When we talk about primary research, it is a type of study in which the researchers collect relevant data samples directly, rather than relying on previously collected data.  This type of research is focused on gaining content specific facts that can be sued to solve specific problems. Since the collected data is fresh and first hand therefore it makes the study more accurate and genuine.

We at SNS Insider have divided Primary Research into 2 parts.

Part 1 wherein we interview the KOLs of major players as well as the upcoming ones across various geographic regions. This allows us to have their view over the market scenario and acts as an important tool to come closer to the accurate market numbers. As many as 45 paid and unpaid primary interviews are taken from both the demand and supply side of the industry to make sure we land at an accurate judgement and analysis of the market.

This step involves the triangulation of data wherein our team analyses the interview transcripts, online survey responses and observation of on filed participants. The below mentioned chart should give a better understanding of the part 1 of the primary interview.

Primary Research

Part 2: In this part of primary research the data collected via secondary research and the part 1 of the primary research is validated with the interviews from individual consultants and subject matter experts.

Consultants are those set of people who have at least 12 years of experience and expertise within the industry whereas Subject Matter Experts are those with at least 15 years of experience behind their back within the same space. The data with the help of two main processes i.e., FGDs (Focused Group Discussions) and IDs (Individual Discussions). This gives us a 3rd party nonbiased primary view of the market scenario making it a more dependable one while collation of the data pointers.

Step 3: Data Bank Validation

Once all the information is collected via primary and secondary sources, we run that information for data validation. At our intelligence centre our research heads track a lot of information related to the market which includes the quarterly reports, the daily stock prices, and other relevant information. Our data bank server gets updated every fortnight and that is how the information which we collected using our primary and secondary information is revalidated in real time.

Data Bank Validation

Step 4: QA/QC Process

After all the data collection and validation our team does a final level of quality check and quality assurance to get rid of any unwanted or undesired mistakes. This might include but not limited to getting rid of the any typos, duplication of numbers or missing of any important information. The people involved in this process include technical content writers, research heads and graphics people. Once this process is completed the title gets uploader on our platform for our clients to read it.

Step 5: Final QC/QA Process:

This is the last process and comes when the client has ordered the study. In this process a final QA/QC is done before the study is emailed to the client. Since we believe in giving our clients a good experience of our research studies, therefore, to make sure that we do not lack at our end in any way humanly possible we do a final round of quality check and then dispatch the study to the client.

Key Market Segmentation

By Product

    • Walking Aids

      • Rollators

        • Premium Rollators

        • Low-Cost Rollators

      • Others (Canes, Crutches, and Walkers)

    • Wheelchairs

      • Manual wheelchairs

      • Powered Wheelchairs

    • Scooters

By End User

  • Hospitals & Clinics

  • Long-term Care Centers

  • Households

  • Others

Request for Segment Customization as per your Business Requirement: Segment Customization Request

REGIONAL COVERAGE:

North America

  • US

  • Canada

  • Mexico

Europe

  • Eastern Europe

    • Poland

    • Romania

    • Hungary

    • Turkey

    • Rest of Eastern Europe

  • Western Europe

    • Germany

    • France

    • UK

    • Italy

    • Spain

    • Netherlands

    • Switzerland

    • Austria

    • Rest of Western Europe

Asia Pacific

  • China

  • India

  • Japan

  • South Korea

  • Vietnam

  • Singapore

  • Australia

  • Rest of Asia Pacific

Middle East & Africa

  • Middle East

    • UAE

    • Egypt

    • Saudi Arabia

    • Qatar

    • Rest of the Middle East

  • Africa

    • Nigeria

    • South Africa

    • Rest of Africa

Latin America

  • Brazil

  • Argentina

  • Colombia

  • Rest of Latin America

Request for Country Level Research Report: Country Level Customization Request

Available Customization

With the given market data, SNS Insider offers customization to meet the company’s specific needs. The following customization options are available for the report:

  • Product Analysis

  • Criss-Cross segment analysis (e.g. Product X Application)

  • Product Matrix which gives a detailed comparison of the product portfolio of each company

  • Geographic Analysis

  • Additional countries in any of the regions

  • Company Information

  • Detailed analysis and profiling of additional market players (Up to five)


  •            5000 (33% Discount)


  •            8950 (40% Discount)


  •            3050 (23% Discount)

Start a Conversation

Hi! Click one of our member below to chat on Phone