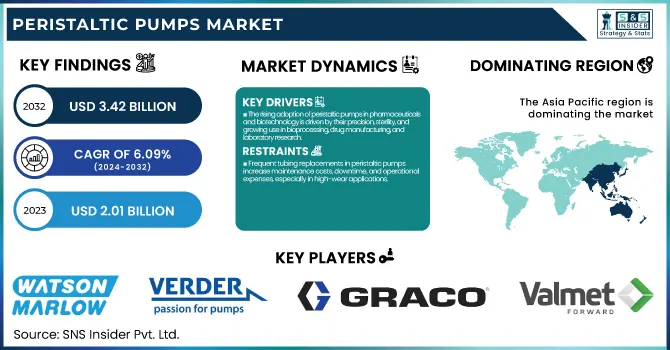
The Peristaltic Pumps Market Size was esteemed at USD 2.01 billion in 2023 and is supposed to arrive at USD 3.42 billion by 2032 with a growing CAGR of 6.09% over the forecast period 2024-2032. The Peristaltic Pumps Market report offers unique insights into production capacity & utilization trends, highlighting operational efficiencies and industry challenges. It examines maintenance & downtime metrics, revealing reliability benchmarks and performance optimization strategies. The study explores technological advancements & adoption, focusing on automation and smart monitoring innovations. Additionally, it analyzes export/import dynamics, shedding light on shifting trade patterns and supply chain developments. A key trend includes the rising emphasis on sustainability, with advancements in energy-efficient designs and eco-friendly materials driving industry transformation.
Drivers
The rising adoption of peristaltic pumps in pharmaceuticals and biotechnology is driven by their precision, sterility, and growing use in bioprocessing, drug manufacturing, and laboratory research.
The increasing demand for peristaltic pumps in pharmaceuticals and biotechnology is driven by their precision, contamination-free operation, and ability to handle sensitive fluids. The pumps are commonly used in drug manufacturing, vaccine production, and laboratory research, where precise dosing and sterile fluid transfer are paramount. Due to the emergence of bioprocessing and single-use technologies, peristaltic pumps have seen an increase in popularity because of their disposable tubing, which reduces the risk of cross-contamination. Their use has been further accelerated because of the increasing adoption of personalized medicine, cell and gene therapies, and biologics. Shopping stated that emerging trends in biomedical peristaltic pumps include automated and IoT-enabled models, improving process control and efficiency. Additionally, there is a trend towards pump designs that are more energy-efficient and sustainable, as the industry is pressured to comply with regulatory and environmental standards. With the global pharmaceutical industry development especially in emerging markets and more investments in research and progressive biopharmaceutical production, the peristaltic pumps market is growing significantly.
Restraint
Frequent tubing replacements in peristaltic pumps increase maintenance costs, downtime, and operational expenses, especially in high-wear applications.
Peristaltic pumps operate by compressing flexible tubing to move fluids, which results in continuous wear and tear on the tubing material. This results in frequent replacements and escalates both maintenance costs and downtime. (The life expectancy of tubing can vary based on characteristics like viscosity, pressure, and compatibility with the liquid flowing through it; aggressive or abrasive fluids hasten degradation.) Sectors dependent on peristaltic pumps, including pharmaceuticals, food processing, and water treatment, are faced with these recurrent costs, affecting the overall efficiency of their operations. Moreover, unscheduled tube failures can result in process disruption which leads to reduced production and increased maintenance costs. The development of newer tubing materials makes them much more durable, but high-cost, chemical-resistant tubing is still in demand. Demands for reliable operation mean companies have to balance performance with cost and frequency of replacement. While predictive maintenance strategies and thoughtful tubing materials selection can minimize these expenses, the challenge of tubing wear over time presents a current limitation for peristaltic pumps.
Opportunities
The rising adoption of energy-efficient peristaltic pumps is driven by sustainability goals, regulatory compliance, and advancements in low-energy, eco-friendly designs.
The adoption of sustainable and energy-efficient solutions in the peristaltic pumps market is gaining momentum as industries prioritize eco-friendly technologies. Power energy will operate at low friction by the nature of the pumps, which reduces the loss of energy. Beyond that, manufacturers are working on new models that optimize motor efficiency, have variable speed control, and include smart monitoring systems to increase energy savings. Furthermore, the growing preference for recyclable and biodegradable tubing materials, particularly in the pharmaceutical, food & beverage, and water treatment sectors, is further propelling market growth. A shift toward greener solutions is being propelled by regulatory policies that focus on reducing carbon footprint and sustainable manufacturing practices. By allowing accurate fluid dosing and minimal wastage, peristaltic pumps also help to achieve circular economy objectives. Increasing demand for energy-efficient water treatment and chemical processing, particularly in the industrial sector, is also driving the market growth. Peristaltic pumps, which are part of industries with a significant push to net-zero emissions, are evolving to achieve sustainability yet without losing out on performance and reliability.
Challenges
Peristaltic pumps face challenges in handling high-viscosity fluids due to increased friction, tubing wear, and flow inconsistencies, requiring advanced materials and design innovations.
Peristaltic pumps face technical limitations when handling high-viscosity fluids such as adhesives, slurries, and resins. These fluids increase friction and resistance, impacting flow homogeneity and needing more power to run. When viscosity increases, this causes more stress on the pump’s tubing, and that means faster wear and a shorter lifespan. Another factor to also consider while working in pharmaceuticals and chemical processing industries is that there arise flow pulsation issues which can affect the precision of guiding the materials measuring process. Although advanced tubing materials and reinforced designs attempt to address these challenges, optimal performance remains elusive in extreme conditions. For higher flow rate and pressure applications, peristaltic pumps may not be as effective as alternative pumps like progressive cavity or diaphragm pumps. These limitations are being addressed by manufacturers via superior tubing formulations, variable-speed drives and automation, guaranteeing better fluid transfer. Despite this, balancing performance, lifespan and price in high-viscosity operations remains challenging, and this drives ongoing development activity within peristaltic pump design.
By Type
The Tube pumps segment dominated with a market share of over 64% in 2023, owing to their extensive usage in end-user industries including pharmaceuticals, food & beverages, and water treatment. They can be used to dispense low to medium-viscosity fluids with both precision and the minimal risk of contamination. Their gentle, non-destructive pumping mechanism prevents fluid degradation. This makes them an essential tool applied in sensitive applications like drug manufacturing and beverage processing. Tube pumps also deliver low maintenance, simple cleaning, and reduced downtime to improve operational efficiencies. Their market dominance is bolstered by metering pumps increasingly being needed in critical industries that are hygiene-dependent and require reliable and precise fluid transfer solutions. With industries increasingly focusing on safety, accuracy, and efficiency, the tube pumps market shrinks, further strengthening its leadership in the peristaltic pumps market.
By Capacity
The Up to 30 psi segment dominated with a market share of over 38% in 2023, due to its extensive application across industries such as pharmaceuticals, food & beverage, and water treatment. These industries demand accurate, contaminant-free fluid handling, which is why low-pressure peristaltic pumps are often used to dose, meter, and transfer sensitive liquids. In pharmaceuticals, these continue to formulate drugs that are super sterile and accurate, and in the food & beverage segment, they help handle ingredients without loss in value. In water treatment, as well, they are critical in chemical dosing for purification processes. This segment will continue to lead, as industries seek out reliable, low-maintenance fluid handling systems that offer minimum downtime and are easy to use.
By End Use
The Pharmaceutical & Medical segment dominated with a market share of over 32% in 2023, due to its critical role in ensuring precise, contamination-free fluid handling. These pumps find extensive utility in drug manufacturing, bioprocessing, and in medical applications where sterility and accuracy are paramount. Used in the pharmaceutical industry for dosing, transferring, and dispensing sensitive fluids without the risk of cross-contamination, the peristaltic pumps for sector based on principles of positive displacement. This is especially essential in biopharmaceutical production where aseptic transfer, low product waste and hygiene are key components. Moreover, a surge in drug formulation, coupled with growing investments in healthcare infrastructure, further propel the demand for the peristaltic pump in the sector, thus strengthening its dominant share of the market.
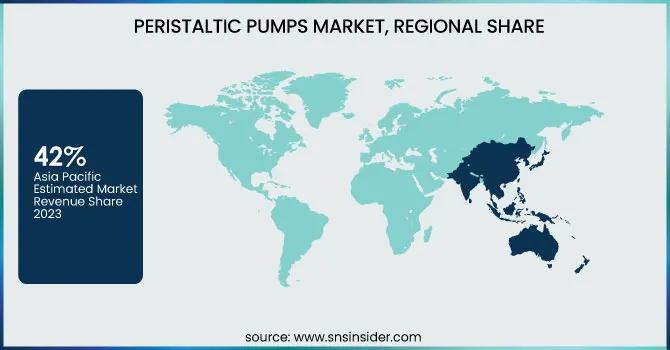
Asia-Pacific region dominated with a market share of over 42% in 2023, due to rapid industrialization, growing pharmaceutical production, and rising demand in the water treatment sector. The region has benefitted from growing industries in the likes of China, India, and Japan, where stringent regulations on wastewater management and hygiene encourage uptake. Moreover, rising demand for accurate fluid handling across the biotechnology and food & beverages sectors drives market growth. Peristaltic pumps' demand is further supported by extensive investment in infrastructure and manufacturing by regional governments. Growing automation in industries and the presence of key manufacturers foster the growth of the market. Asia- Pacific continues to hold the position of leading the market owing to economic prosperity and technological advancement in the region, along with the fact that it is the maximum revenue contributor for the global peristaltic pump industry.
North America is experiencing the fastest growth in the Peristaltic Pumps Market due to several factors. The surge in technological innovations in pump design and automation over the years has increased technical efficiency as well as the reliability of these pumps, thereby making the peristaltic pumps a lucrative choice across a spectrum of industries. A notable driver of this trend is the medical sector, which requires accurate fluid handling for many applications, including drug delivery and diagnostics. Demand for hygienic, contamination-free food and beverage pumping systems is also increasing as consumers demand higher food safety standards. Additionally, robust controls in pharmaceuticals and chemical industries are escalating the use of peristaltic pumps, as it guarantees controlled fluid handling, adherence to safety regulations, and minimizes contamination risk, which in turn is further fuelling the market growth in the region.
Some of the major key players in the Peristaltic Pumps Market
Watson-Marlow Inc. (Peristaltic Pumps, Tube Pumps)
Verder Inc. (Industrial Peristaltic Pumps, Dosing Pumps)
Graco Inc. (Hose Pumps, Industrial Peristaltic Pumps)
Boxer GmbH (OEM Peristaltic Pumps, Laboratory Pumps)
ANKO (Food-Grade Peristaltic Pumps, Filling Pumps)
Ingersoll Rand (Heavy-Duty Peristaltic Pumps, Chemical Pumps)
ProMinent (Metering Peristaltic Pumps, Dosing Pumps)
Boyser (Industrial Hose Pumps, Peristaltic Dosing Pumps)
Gilson Incorporated (Precision Peristaltic Pumps, Laboratory Pumps)
Valmet (Peristaltic Metering Pumps, Pulp & Paper Pumps)
IDEX Corporation (Pharmaceutical Peristaltic Pumps, Industrial Pumps)
Flowrox Oy (Heavy-Duty Peristaltic Pumps, Slurry Pumps)
Randolph Austin Company (OEM Peristaltic Pumps, Chemical Pumps)
Heidolph Instruments GmbH (Laboratory Peristaltic Pumps, Dosing Pumps)
Wanner Engineering Inc. (High-Pressure Peristaltic Pumps, Industrial Pumps)
Blue-White Industries (Metering Peristaltic Pumps, Chemical Dosing Pumps)
Shenzhen Pump (Medical Peristaltic Pumps, Precision Pumps)
Baoding Longer Precision Pump Co. Ltd. (Laboratory Peristaltic Pumps, Industrial Pumps)
Stenner Pump Company (Metering Peristaltic Pumps, Water Treatment Pumps)
THOMAS by Gardner Denver (Miniature Peristaltic Pumps, OEM Pumps)
Suppliers for (Provides peristaltic pumps for water treatment, cleaning, and chemical dosing systems) on Peristaltic Pumps Market
Watson-Marlow Fluid Technology Group
Cole-Parmer
Verderflex
Flowrox
ProMinent
Graco Inc.
LEWA GmbH
Interpump Group S.p.A.
KSB SE & Co. KGaA
Seko
In May 2024: Graco Inc. launched Pulse Asset, an enhancement to its Pulse Pro Fluid Management system. This extension utilizes programmable ID tags to monitor fluid dispensing in manufacturing facilities, even without Wi-Fi. Stored dispensing data can later be uploaded to the Pulse HUB, enabling access from any connected device. The system is designed to improve operational efficiency and enhance transparency.
In April 2024: Watson-Marlow Fluid Technology Solutions (WMFTS), renowned for its peristaltic pumps and fluid path technologies, introduced WMArchitect. This innovative single-use solution enhances biopharmaceutical fluid management by optimizing processes, ensuring product safety, and minimizing regulatory challenges. Built on the foundation of previous solutions like purest and aseptic, WMArchitect offers greater flexibility and efficiency for biopharma companies.
Report Attributes | Details |
Market Size in 2023 | USD 2.01 Billion |
Market Size by 2032 | USD 3.42 Billion |
CAGR | CAGR of 6.09% From 2024 to 2032 |
Base Year | 2023 |
Forecast Period | 2024-2032 |
Historical Data | 2020-2022 |
Report Scope & Coverage | Market Size, Segments Analysis, Competitive Landscape, Regional Analysis, DROC & SWOT Analysis, Forecast Outlook |
Key Segments | • By Type (Tube Pump, Hose Pump) • By Capacity (Up to 30 psi, 31 to 50 psi, 51 to 100 psi, 101 to 150 psi, Above 150 psi) • By End Use (Pharmaceutical & Medical, Water & Wastewater, Food & Beverage, Chemicals, Pulp & Paper, Others) |
Regional Analysis/Coverage | North America (US, Canada, Mexico), Europe (Eastern Europe [Poland, Romania, Hungary, Turkey, Rest of Eastern Europe] Western Europe] Germany, France, UK, Italy, Spain, Netherlands, Switzerland, Austria, Rest of Western Europe]), Asia Pacific (China, India, Japan, South Korea, Vietnam, Singapore, Australia, Rest of Asia Pacific), Middle East & Africa (Middle East [UAE, Egypt, Saudi Arabia, Qatar, Rest of Middle East], Africa [Nigeria, South Africa, Rest of Africa], Latin America (Brazil, Argentina, Colombia, Rest of Latin America) |
Company Profiles | Watson-Marlow Inc., Verder Inc., Graco Inc., Boxer GmbH, ANKO, Ingersoll Rand, ProMinent, Boyser, Gilson Incorporated, Valmet, IDEX Corporation, Flowrox Oy, Randolph Austin Company, Heidolph Instruments GmbH, Wanner Engineering Inc., Blue-White Industries, Shenchen Pump, Baoding Longer Precision Pump Co. Ltd., Stenner Pump Company, THOMAS by Gardner Denver. |
Ans: The Peristaltic Pumps Market is expected to grow at a CAGR of 6.09% during 2024-2032.
Ans: The Peristaltic Pumps Market was USD 2.01 billion in 2023 and is expected to Reach USD 3.42 billion by 2032.
Ans: The rising adoption of peristaltic pumps in pharmaceuticals and biotechnology is driven by their precision, sterility, and growing use in bioprocessing, drug manufacturing, and laboratory research.
Ans: The “Tube pumps” segment dominated the Peristaltic Pumps Market.
Ans: Asia-Pacific dominated the Peristaltic Pumps Market in 2023
TABLE OF CONTENT
1. Introduction
1.1 Market Definition
1.2 Scope (Inclusion and Exclusions)
1.3 Research Assumptions
2. Executive Summary
2.1 Market Overview
2.2 Regional Synopsis
2.3 Competitive Summary
3. Research Methodology
3.1 Top-Down Approach
3.2 Bottom-up Approach
3.3. Data Validation
3.4 Primary Interviews
4. Market Dynamics
4.1 Market Analysis
4.1.1 Drivers
4.1.2 Restraints
4.1.3 Opportunities
4.1.4 Challenges
4.2 PESTLE Analysis
4.3 Porter’s Five Forces Model
5. Statistical Insights and Trends Reporting
5.1 Market Size & Growth, by Region (2020-2023)
5.2 Production Capacity & Utilization Rates, by Region (2020-2023)
5.3 Maintenance & Downtime Metrics
5.4 Technological Advancements & Adoption Rates, by Region
5.5 Export/Import Data, by Region (2023)
6. Competitive Landscape
6.1 List of Major Companies, By Region
6.2 Market Share Analysis, By Region
6.3 Product Benchmarking
6.3.1 Product specifications and features
6.3.2 Pricing
6.4 Strategic Initiatives
6.4.1 Marketing and promotional activities
6.4.2 Distribution and Supply Chain Strategies
6.4.3 Expansion plans and new product launches
6.4.4 Strategic partnerships and collaborations
6.5 Technological Advancements
6.6 Market Positioning and Branding
7. Peristaltic Pumps Market Segmentation, By Type
7.1 Chapter Overview
7.2 Tube Pump
7.2.1 Tube Pump Market Trends Analysis (2020-2032)
7.2.2 Tube Pump Market Size Estimates and Forecasts to 2032 (USD Billion)
7.3 Hose Pump
7.3.1 Hose Pump Market Trends Analysis (2020-2032)
7.3.2 Hose Pump Market Size Estimates and Forecasts to 2032 (USD Billion)
8. Peristaltic Pumps Market Segmentation, By Capacity
8.1 Chapter Overview
8.2 Up to 30 psi
8.2.1 Up to 30 psi Market Trends Analysis (2020-2032)
8.2.2 Up to 30 psi Market Size Estimates and Forecasts to 2032 (USD Billion)
8.3 31 to 50 psi
8.3.1 31 to 50 psi Market Trends Analysis (2020-2032)
8.3.2 31 to 50 psi Market Size Estimates and Forecasts to 2032 (USD Billion)
8.4 51 to 100 psi
8.3.1 51 to 100 psi Market Trends Analysis (2020-2032)
8.3.2 51 to 100 psi Market Size Estimates and Forecasts to 2032 (USD Billion)
8.5 101 to 150 psi
8.3.1 101 to 150 psi Market Trends Analysis (2020-2032)
8.3.2 101 to 150 psi Market Size Estimates and Forecasts to 2032 (USD Billion)
8.6 Above 150 psi
8.6.1 Above 150 psi Market Trends Analysis (2020-2032)
8.6.2 Above 150 psi Market Size Estimates and Forecasts to 2032 (USD Billion)
9. Peristaltic Pumps Market Segmentation, By End Use
9.1 Chapter Overview
9.2 Pharmaceutical & Medical
9.2.1 Pharmaceutical & Medical Market Trends Analysis (2020-2032)
9.2.2 Pharmaceutical & Medical Size Estimates and Forecasts to 2032 (USD Billion)
9.3 Water & Wastewater
9.3.1 Water & Wastewater Market Trends Analysis (2020-2032)
9.3.2 Water & Wastewater Market Size Estimates and Forecasts to 2032 (USD Billion)
9.4 Food & Beverage
9.4.1 Food & Beverage Market Trends Analysis (2020-2032)
9.4.2 Food & Beverage Market Size Estimates and Forecasts to 2032 (USD Billion)
9.5 Chemicals
9.5.1 Chemicals Market Trends Analysis (2020-2032)
9.5.2 Chemicals Market Size Estimates and Forecasts to 2032 (USD Billion)
9.6 Pulp & Paper
9.6.1Pulp & Paper Market Trends Analysis (2020-2032)
9.6.2 Pulp & Paper Market Size Estimates and Forecasts to 2032 (USD Billion)
9.7 Others
9.7.1 Others Market Trends Analysis (2020-2032)
9.7.2 Others Market Size Estimates and Forecasts to 2032 (USD Billion)
10. Regional Analysis
10.1 Chapter Overview
10.2 North America
10.2.1 Trends Analysis
10.2.2 North America Peristaltic Pumps Market Estimates and Forecasts, by Country (2020-2032) (USD Billion)
10.2.3 North America Peristaltic Pumps Market Estimates and Forecasts, By Type (2020-2032) (USD Billion)
10.2.4 North America Peristaltic Pumps Market Estimates and Forecasts, By Capacity (2020-2032) (USD Billion)
10.2.5 North America Peristaltic Pumps Market Estimates and Forecasts, By End-Use (2020-2032) (USD Billion)
10.2.6 USA
10.2.6.1 USA Peristaltic Pumps Market Estimates and Forecasts, By Type (2020-2032) (USD Billion)
10.2.6.2 USA Peristaltic Pumps Market Estimates and Forecasts, By Capacity (2020-2032) (USD Billion)
10.2.6.3 USA Peristaltic Pumps Market Estimates and Forecasts, By End-Use (2020-2032) (USD Billion)
10.2.7 Canada
10.2.7.1 Canada Peristaltic Pumps Market Estimates and Forecasts, By Type (2020-2032) (USD Billion)
10.2.7.2 Canada Peristaltic Pumps Market Estimates and Forecasts, By Capacity (2020-2032) (USD Billion)
10.2.7.3 Canada Peristaltic Pumps Market Estimates and Forecasts, By End-Use (2020-2032) (USD Billion)
10.2.8 Mexico
10.2.8.1 Mexico Peristaltic Pumps Market Estimates and Forecasts, By Type (2020-2032) (USD Billion)
10.2.8.2 Mexico Peristaltic Pumps Market Estimates and Forecasts, By Capacity (2020-2032) (USD Billion)
10.2.8.3 Mexico Peristaltic Pumps Market Estimates and Forecasts, By End-Use (2020-2032) (USD Billion)
10.3 Europe
10.3.1 Eastern Europe
10.3.1.1 Trends Analysis
10.3.1.2 Eastern Europe Peristaltic Pumps Market Estimates and Forecasts, by Country (2020-2032) (USD Billion)
10.3.1.3 Eastern Europe Peristaltic Pumps Market Estimates and Forecasts, By Type (2020-2032) (USD Billion)
10.3.1.4 Eastern Europe Peristaltic Pumps Market Estimates and Forecasts, By Capacity (2020-2032) (USD Billion)
10.3.1.5 Eastern Europe Peristaltic Pumps Market Estimates and Forecasts, By End-Use (2020-2032) (USD Billion)
10.3.1.6 Poland
10.3.1.6.1 Poland Peristaltic Pumps Market Estimates and Forecasts, By Type (2020-2032) (USD Billion)
10.3.1.6.2 Poland Peristaltic Pumps Market Estimates and Forecasts, By Capacity (2020-2032) (USD Billion)
10.3.1.6.3 Poland Peristaltic Pumps Market Estimates and Forecasts, By End-Use (2020-2032) (USD Billion)
10.3.1.7 Romania
10.3.1.7.1 Romania Peristaltic Pumps Market Estimates and Forecasts, By Type (2020-2032) (USD Billion)
10.3.1.7.2 Romania Peristaltic Pumps Market Estimates and Forecasts, By Capacity (2020-2032) (USD Billion)
10.3.1.7.3 Romania Peristaltic Pumps Market Estimates and Forecasts, By End-Use (2020-2032) (USD Billion)
10.3.1.8 Hungary
10.3.1.8.1 Hungary Peristaltic Pumps Market Estimates and Forecasts, By Type (2020-2032) (USD Billion)
10.3.1.8.2 Hungary Peristaltic Pumps Market Estimates and Forecasts, By Capacity (2020-2032) (USD Billion)
10.3.1.8.3 Hungary Peristaltic Pumps Market Estimates and Forecasts, By End-Use (2020-2032) (USD Billion)
10.3.1.9 Turkey
10.3.1.9.1 Turkey Peristaltic Pumps Market Estimates and Forecasts, By Type (2020-2032) (USD Billion)
10.3.1.9.2 Turkey Peristaltic Pumps Market Estimates and Forecasts, By Capacity (2020-2032) (USD Billion)
10.3.1.9.3 Turkey Peristaltic Pumps Market Estimates and Forecasts, By End-Use (2020-2032) (USD Billion)
10.3.1.10 Rest of Eastern Europe
10.3.1.10.1 Rest of Eastern Europe Peristaltic Pumps Market Estimates and Forecasts, By Type (2020-2032) (USD Billion)
10.3.1.10.2 Rest of Eastern Europe Peristaltic Pumps Market Estimates and Forecasts, By Capacity (2020-2032) (USD Billion)
10.3.1.10.3 Rest of Eastern Europe Peristaltic Pumps Market Estimates and Forecasts, By End-Use (2020-2032) (USD Billion)
10.3.2 Western Europe
10.3.2.1 Trends Analysis
10.3.2.2 Western Europe Peristaltic Pumps Market Estimates and Forecasts, by Country (2020-2032) (USD Billion)
10.3.2.3 Western Europe Peristaltic Pumps Market Estimates and Forecasts, By Type (2020-2032) (USD Billion)
10.3.2.4 Western Europe Peristaltic Pumps Market Estimates and Forecasts, By Capacity (2020-2032) (USD Billion)
10.3.2.5 Western Europe Peristaltic Pumps Market Estimates and Forecasts, By End-Use (2020-2032) (USD Billion)
10.3.2.6 Germany
10.3.2.6.1 Germany Peristaltic Pumps Market Estimates and Forecasts, By Type (2020-2032) (USD Billion)
10.3.2.6.2 Germany Peristaltic Pumps Market Estimates and Forecasts, By Capacity (2020-2032) (USD Billion)
10.3.2.6.3 Germany Peristaltic Pumps Market Estimates and Forecasts, By End-Use (2020-2032) (USD Billion)
10.3.2.7 France
10.3.2.7.1 France Peristaltic Pumps Market Estimates and Forecasts, By Type (2020-2032) (USD Billion)
10.3.2.7.2 France Peristaltic Pumps Market Estimates and Forecasts, By Capacity (2020-2032) (USD Billion)
10.3.2.7.3 France Peristaltic Pumps Market Estimates and Forecasts, By End-Use (2020-2032) (USD Billion)
10.3.2.8 UK
10.3.2.8.1 UK Peristaltic Pumps Market Estimates and Forecasts, By Type (2020-2032) (USD Billion)
10.3.2.8.2 UK Peristaltic Pumps Market Estimates and Forecasts, By Capacity (2020-2032) (USD Billion)
10.3.2.8.3 UK Peristaltic Pumps Market Estimates and Forecasts, By End-Use (2020-2032) (USD Billion)
10.3.2.9 Italy
10.3.2.9.1 Italy Peristaltic Pumps Market Estimates and Forecasts, By Type (2020-2032) (USD Billion)
10.3.2.9.2 Italy Peristaltic Pumps Market Estimates and Forecasts, By Capacity (2020-2032) (USD Billion)
10.3.2.9.3 Italy Peristaltic Pumps Market Estimates and Forecasts, By End-Use (2020-2032) (USD Billion)
10.3.2.10 Spain
10.3.2.10.1 Spain Peristaltic Pumps Market Estimates and Forecasts, By Type (2020-2032) (USD Billion)
10.3.2.10.2 Spain Peristaltic Pumps Market Estimates and Forecasts, By Capacity (2020-2032) (USD Billion)
10.3.2.10.3 Spain Peristaltic Pumps Market Estimates and Forecasts, By End-Use (2020-2032) (USD Billion)
10.3.2.11 Netherlands
10.3.2.11.1 Netherlands Peristaltic Pumps Market Estimates and Forecasts, By Type (2020-2032) (USD Billion)
10.3.2.11.2 Netherlands Peristaltic Pumps Market Estimates and Forecasts, By Capacity (2020-2032) (USD Billion)
10.3.2.11.3 Netherlands Peristaltic Pumps Market Estimates and Forecasts, By End-Use (2020-2032) (USD Billion)
10.3.2.12 Switzerland
10.3.2.12.1 Switzerland Peristaltic Pumps Market Estimates and Forecasts, By Type (2020-2032) (USD Billion)
10.3.2.12.2 Switzerland Peristaltic Pumps Market Estimates and Forecasts, By Capacity (2020-2032) (USD Billion)
10.3.2.12.3 Switzerland Peristaltic Pumps Market Estimates and Forecasts, By End-Use (2020-2032) (USD Billion)
10.3.2.13 Austria
10.3.2.13.1 Austria Peristaltic Pumps Market Estimates and Forecasts, By Type (2020-2032) (USD Billion)
10.3.2.13.2 Austria Peristaltic Pumps Market Estimates and Forecasts, By Capacity (2020-2032) (USD Billion)
10.3.2.13.3 Austria Peristaltic Pumps Market Estimates and Forecasts, By End-Use (2020-2032) (USD Billion)
10.3.2.14 Rest of Western Europe
10.3.2.14.1 Rest of Western Europe Peristaltic Pumps Market Estimates and Forecasts, By Type (2020-2032) (USD Billion)
10.3.2.14.2 Rest of Western Europe Peristaltic Pumps Market Estimates and Forecasts, By Capacity (2020-2032) (USD Billion)
10.3.2.14.3 Rest of Western Europe Peristaltic Pumps Market Estimates and Forecasts, By End-Use (2020-2032) (USD Billion)
10.4 Asia-Pacific
10.4.1 Trends Analysis
10.4.2 Asia-Pacific Peristaltic Pumps Market Estimates and Forecasts, by Country (2020-2032) (USD Billion)
10.4.3 Asia-Pacific Peristaltic Pumps Market Estimates and Forecasts, By Type (2020-2032) (USD Billion)
10.4.4 Asia-Pacific Peristaltic Pumps Market Estimates and Forecasts, By Capacity (2020-2032) (USD Billion)
10.4.5 Asia-Pacific Peristaltic Pumps Market Estimates and Forecasts, By End-Use (2020-2032) (USD Billion)
10.4.6 China
10.4.6.1 China Peristaltic Pumps Market Estimates and Forecasts, By Type (2020-2032) (USD Billion)
10.4.6.2 China Peristaltic Pumps Market Estimates and Forecasts, By Capacity (2020-2032) (USD Billion)
10.4.6.3 China Peristaltic Pumps Market Estimates and Forecasts, By End-Use (2020-2032) (USD Billion)
10.4.7 India
10.4.7.1 India Peristaltic Pumps Market Estimates and Forecasts, By Type (2020-2032) (USD Billion)
10.4.7.2 India Peristaltic Pumps Market Estimates and Forecasts, By Capacity (2020-2032) (USD Billion)
10.4.7.3 India Peristaltic Pumps Market Estimates and Forecasts, By End-Use (2020-2032) (USD Billion)
10.4.8 Japan
10.4.8.1 Japan Peristaltic Pumps Market Estimates and Forecasts, By Type (2020-2032) (USD Billion)
10.4.8.2 Japan Peristaltic Pumps Market Estimates and Forecasts, By Capacity (2020-2032) (USD Billion)
10.4.8.3 Japan Peristaltic Pumps Market Estimates and Forecasts, By End-Use (2020-2032) (USD Billion)
10.4.9 South Korea
10.4.9.1 South Korea Peristaltic Pumps Market Estimates and Forecasts, By Type (2020-2032) (USD Billion)
10.4.9.2 South Korea Peristaltic Pumps Market Estimates and Forecasts, By Capacity (2020-2032) (USD Billion)
10.4.9.3 South Korea Peristaltic Pumps Market Estimates and Forecasts, By End-Use (2020-2032) (USD Billion)
10.4.10 Vietnam
10.4.10.1 Vietnam Peristaltic Pumps Market Estimates and Forecasts, By Type (2020-2032) (USD Billion)
10.4.10.2 Vietnam Peristaltic Pumps Market Estimates and Forecasts, By Capacity (2020-2032) (USD Billion)
10.4.10.3 Vietnam Peristaltic Pumps Market Estimates and Forecasts, By End-Use (2020-2032) (USD Billion)
10.4.11 Singapore
10.4.11.1 Singapore Peristaltic Pumps Market Estimates and Forecasts, By Type (2020-2032) (USD Billion)
10.4.11.2 Singapore Peristaltic Pumps Market Estimates and Forecasts, By Capacity (2020-2032) (USD Billion)
10.4.11.3 Singapore Peristaltic Pumps Market Estimates and Forecasts, By End-Use (2020-2032) (USD Billion)
10.4.12 Australia
10.4.12.1 Australia Peristaltic Pumps Market Estimates and Forecasts, By Type (2020-2032) (USD Billion)
10.4.12.2 Australia Peristaltic Pumps Market Estimates and Forecasts, By Capacity (2020-2032) (USD Billion)
10.4.12.3 Australia Peristaltic Pumps Market Estimates and Forecasts, By End-Use (2020-2032) (USD Billion)
10.4.13 Rest of Asia-Pacific
10.4.13.1 Rest of Asia-Pacific Peristaltic Pumps Market Estimates and Forecasts, By Type (2020-2032) (USD Billion)
10.4.13.2 Rest of Asia-Pacific Peristaltic Pumps Market Estimates and Forecasts, By Capacity (2020-2032) (USD Billion)
10.4.13.3 Rest of Asia-Pacific Peristaltic Pumps Market Estimates and Forecasts, By End-Use (2020-2032) (USD Billion)
10.5 Middle East and Africa
10.5.1 Middle East
10.5.1.1 Trends Analysis
10.5.1.2 Middle East Peristaltic Pumps Market Estimates and Forecasts, by Country (2020-2032) (USD Billion)
10.5.1.3 Middle East Peristaltic Pumps Market Estimates and Forecasts, By Type (2020-2032) (USD Billion)
10.5.1.4 Middle East Peristaltic Pumps Market Estimates and Forecasts, By Capacity (2020-2032) (USD Billion)
10.5.1.5 Middle East Peristaltic Pumps Market Estimates and Forecasts, By End-Use (2020-2032) (USD Billion)
10.5.1.6 UAE
10.5.1.6.1 UAE Peristaltic Pumps Market Estimates and Forecasts, By Type (2020-2032) (USD Billion)
10.5.1.6.2 UAE Peristaltic Pumps Market Estimates and Forecasts, By Capacity (2020-2032) (USD Billion)
10.5.1.6.3 UAE Peristaltic Pumps Market Estimates and Forecasts, By End-Use (2020-2032) (USD Billion)
10.5.1.7 Egypt
10.5.1.7.1 Egypt Peristaltic Pumps Market Estimates and Forecasts, By Type (2020-2032) (USD Billion)
10.5.1.7.2 Egypt Peristaltic Pumps Market Estimates and Forecasts, By Capacity (2020-2032) (USD Billion)
10.5.1.7.3 Egypt Peristaltic Pumps Market Estimates and Forecasts, By End-Use (2020-2032) (USD Billion)
10.5.1.8 Saudi Arabia
10.5.1.8.1 Saudi Arabia Peristaltic Pumps Market Estimates and Forecasts, By Type (2020-2032) (USD Billion)
10.5.1.8.2 Saudi Arabia Peristaltic Pumps Market Estimates and Forecasts, By Capacity (2020-2032) (USD Billion)
10.5.1.8.3 Saudi Arabia Peristaltic Pumps Market Estimates and Forecasts, By End-Use (2020-2032) (USD Billion)
10.5.1.9 Qatar
10.5.1.9.1 Qatar Peristaltic Pumps Market Estimates and Forecasts, By Type (2020-2032) (USD Billion)
10.5.1.9.2 Qatar Peristaltic Pumps Market Estimates and Forecasts, By Capacity (2020-2032) (USD Billion)
10.5.1.9.3 Qatar Peristaltic Pumps Market Estimates and Forecasts, By End-Use (2020-2032) (USD Billion)
10.5.1.10 Rest of Middle East
10.5.1.10.1 Rest of Middle East Peristaltic Pumps Market Estimates and Forecasts, By Type (2020-2032) (USD Billion)
10.5.1.10.2 Rest of Middle East Peristaltic Pumps Market Estimates and Forecasts, By Capacity (2020-2032) (USD Billion)
10.5.1.10.3 Rest of Middle East Peristaltic Pumps Market Estimates and Forecasts, By End-Use (2020-2032) (USD Billion)
10.5.2 Africa
10.5.2.1 Trends Analysis
10.5.2.2 Africa Peristaltic Pumps Market Estimates and Forecasts, by Country (2020-2032) (USD Billion)
10.5.2.3 Africa Peristaltic Pumps Market Estimates and Forecasts, By Type (2020-2032) (USD Billion)
10.5.2.4 Africa Peristaltic Pumps Market Estimates and Forecasts, By Capacity (2020-2032) (USD Billion)
10.5.2.5 Africa Peristaltic Pumps Market Estimates and Forecasts, By End-Use (2020-2032) (USD Billion)
10.5.2.6 South Africa
10.5.2.6.1 South Africa Peristaltic Pumps Market Estimates and Forecasts, By Type (2020-2032) (USD Billion)
10.5.2.6.2 South Africa Peristaltic Pumps Market Estimates and Forecasts, By Capacity (2020-2032) (USD Billion)
10.5.2.6.3 South Africa Peristaltic Pumps Market Estimates and Forecasts, By End-Use (2020-2032) (USD Billion)
10.5.2.7 Nigeria
10.5.2.7.1 Nigeria Peristaltic Pumps Market Estimates and Forecasts, By Type (2020-2032) (USD Billion)
10.5.2.7.2 Nigeria Peristaltic Pumps Market Estimates and Forecasts, By Capacity (2020-2032) (USD Billion)
10.5.2.7.3 Nigeria Peristaltic Pumps Market Estimates and Forecasts, By End-Use (2020-2032) (USD Billion)
10.5.2.8 Rest of Africa
10.5.2.8.1 Rest of Africa Peristaltic Pumps Market Estimates and Forecasts, By Type (2020-2032) (USD Billion)
10.5.2.8.2 Rest of Africa Peristaltic Pumps Market Estimates and Forecasts, By Capacity (2020-2032) (USD Billion)
10.5.2.8.3 Rest of Africa Peristaltic Pumps Market Estimates and Forecasts, By End-Use (2020-2032) (USD Billion)
10.6 Latin America
10.6.1 Trends Analysis
10.6.2 Latin America Peristaltic Pumps Market Estimates and Forecasts, by Country (2020-2032) (USD Billion)
10.6.3 Latin America Peristaltic Pumps Market Estimates and Forecasts, By Type (2020-2032) (USD Billion)
10.6.4 Latin America Peristaltic Pumps Market Estimates and Forecasts, By Capacity (2020-2032) (USD Billion)
10.6.5 Latin America Peristaltic Pumps Market Estimates and Forecasts, By End-Use (2020-2032) (USD Billion)
10.6.6 Brazil
10.6.6.1 Brazil Peristaltic Pumps Market Estimates and Forecasts, By Type (2020-2032) (USD Billion)
10.6.6.2 Brazil Peristaltic Pumps Market Estimates and Forecasts, By Capacity (2020-2032) (USD Billion)
10.6.6.3 Brazil Peristaltic Pumps Market Estimates and Forecasts, By End-Use (2020-2032) (USD Billion)
10.6.7 Argentina
10.6.7.1 Argentina Peristaltic Pumps Market Estimates and Forecasts, By Type (2020-2032) (USD Billion)
10.6.7.2 Argentina Peristaltic Pumps Market Estimates and Forecasts, By Capacity (2020-2032) (USD Billion)
10.6.7.3 Argentina Peristaltic Pumps Market Estimates and Forecasts, By End-Use (2020-2032) (USD Billion)
10.6.8 Colombia
10.6.8.1 Colombia Peristaltic Pumps Market Estimates and Forecasts, By Type (2020-2032) (USD Billion)
10.6.8.2 Colombia Peristaltic Pumps Market Estimates and Forecasts, By Capacity (2020-2032) (USD Billion)
10.6.8.3 Colombia Peristaltic Pumps Market Estimates and Forecasts, By End-Use (2020-2032) (USD Billion)
10.6.9 Rest of Latin America
10.6.9.1 Rest of Latin America Peristaltic Pumps Market Estimates and Forecasts, By Type (2020-2032) (USD Billion)
10.6.9.2 Rest of Latin America Peristaltic Pumps Market Estimates and Forecasts, By Capacity (2020-2032) (USD Billion)
10.6.9.3 Rest of Latin America Peristaltic Pumps Market Estimates and Forecasts, By End-Use (2020-2032) (USD Billion)
11. Company Profiles
11.1 Watson-Marlow Inc.
11.1.1 Company Overview
11.1.2 Financial
11.1.3 Products/ Services Offered
11.1.4 SWOT Analysis
11.2 Ingersoll Rand
11.2.1 Company Overview
11.2.2 Financial
11.2.3 Products/ Services Offered
11.2.4 SWOT Analysis
11.3 ANKO
11.3.1 Company Overview
11.3.2 Financial
11.3.3 Products/ Services Offered
11.3.4 SWOT Analysis
11.4 Verder Inc.
11.4.1 Company Overview
11.4.2 Financial
11.4.3 Products/ Services Offered
11.4.4 SWOT Analysis
11.5 Valmet
11.5.1 Company Overview
11.5.2 Financial
11.5.3 Products/ Services Offered
11.5.4 SWOT Analysis
11.6 Boxer GmbH
11.6.1 Company Overview
11.6.2 Financial
11.6.3 Products/ Services Offered
11.6.4 SWOT Analysis
11.7 Gilson Incorporated
11.7.1 Company Overview
11.7.2 Financial
11.7.3 Products/ Services Offered
11.7.4 SWOT Analysis
11.8 ProMinent
11.8.1 Company Overview
11.8.2 Financial
11.8.3 Products/ Services Offered
11.8.4 SWOT Analysis
11.9 Graco Inc
11.9.1 Company Overview
11.9.2 Financial
11.9.3 Products/ Services Offered
11.9.4 SWOT Analysis
11.10 Boyser
11.10.1 Company Overview
11.10.2 Financial
11.10.3 Products/ Services Offered
11.10.4 SWOT Analysis
12. Use Cases and Best Practices
13. Conclusion
An accurate research report requires proper strategizing as well as implementation. There are multiple factors involved in the completion of good and accurate research report and selecting the best methodology to compete the research is the toughest part. Since the research reports we provide play a crucial role in any company’s decision-making process, therefore we at SNS Insider always believe that we should choose the best method which gives us results closer to reality. This allows us to reach at a stage wherein we can provide our clients best and accurate investment to output ratio.
Each report that we prepare takes a timeframe of 350-400 business hours for production. Starting from the selection of titles through a couple of in-depth brain storming session to the final QC process before uploading our titles on our website we dedicate around 350 working hours. The titles are selected based on their current market cap and the foreseen CAGR and growth.
The 5 steps process:
Step 1: Secondary Research:
Secondary Research or Desk Research is as the name suggests is a research process wherein, we collect data through the readily available information. In this process we use various paid and unpaid databases which our team has access to and gather data through the same. This includes examining of listed companies’ annual reports, Journals, SEC filling etc. Apart from this our team has access to various associations across the globe across different industries. Lastly, we have exchange relationships with various university as well as individual libraries.
Step 2: Primary Research
When we talk about primary research, it is a type of study in which the researchers collect relevant data samples directly, rather than relying on previously collected data. This type of research is focused on gaining content specific facts that can be sued to solve specific problems. Since the collected data is fresh and first hand therefore it makes the study more accurate and genuine.
We at SNS Insider have divided Primary Research into 2 parts.
Part 1 wherein we interview the KOLs of major players as well as the upcoming ones across various geographic regions. This allows us to have their view over the market scenario and acts as an important tool to come closer to the accurate market numbers. As many as 45 paid and unpaid primary interviews are taken from both the demand and supply side of the industry to make sure we land at an accurate judgement and analysis of the market.
This step involves the triangulation of data wherein our team analyses the interview transcripts, online survey responses and observation of on filed participants. The below mentioned chart should give a better understanding of the part 1 of the primary interview.
Part 2: In this part of primary research the data collected via secondary research and the part 1 of the primary research is validated with the interviews from individual consultants and subject matter experts.
Consultants are those set of people who have at least 12 years of experience and expertise within the industry whereas Subject Matter Experts are those with at least 15 years of experience behind their back within the same space. The data with the help of two main processes i.e., FGDs (Focused Group Discussions) and IDs (Individual Discussions). This gives us a 3rd party nonbiased primary view of the market scenario making it a more dependable one while collation of the data pointers.
Step 3: Data Bank Validation
Once all the information is collected via primary and secondary sources, we run that information for data validation. At our intelligence centre our research heads track a lot of information related to the market which includes the quarterly reports, the daily stock prices, and other relevant information. Our data bank server gets updated every fortnight and that is how the information which we collected using our primary and secondary information is revalidated in real time.
Step 4: QA/QC Process
After all the data collection and validation our team does a final level of quality check and quality assurance to get rid of any unwanted or undesired mistakes. This might include but not limited to getting rid of the any typos, duplication of numbers or missing of any important information. The people involved in this process include technical content writers, research heads and graphics people. Once this process is completed the title gets uploader on our platform for our clients to read it.
Step 5: Final QC/QA Process:
This is the last process and comes when the client has ordered the study. In this process a final QA/QC is done before the study is emailed to the client. Since we believe in giving our clients a good experience of our research studies, therefore, to make sure that we do not lack at our end in any way humanly possible we do a final round of quality check and then dispatch the study to the client.
By Type
Tube Pump
Hose Pump
By Capacity
Up to 30 psi
31 to 50 psi
51 to 100 psi
101 to 150 psi
Above 150 psi
By End Use
Pharmaceutical & Medical
Water & Wastewater
Food & Beverage
Chemicals
Pulp & Paper
Others
Request for Segment Customization as per your Business Requirement: Segment Customization Request
Regional Coverage:
North America
US
Canada
Mexico
Europe
Eastern Europe
Poland
Romania
Hungary
Turkey
Rest of Eastern Europe
Western Europe
Germany
France
UK
Italy
Spain
Netherlands
Switzerland
Austria
Rest of Western Europe
Asia Pacific
China
India
Japan
South Korea
Vietnam
Singapore
Australia
Rest of Asia Pacific
Middle East & Africa
Middle East
UAE
Egypt
Saudi Arabia
Qatar
Rest of Middle East
Africa
Nigeria
South Africa
Rest of Africa
Latin America
Brazil
Argentina
Colombia
Rest of Latin America
Request for Country Level Research Report: Country Level Customization Request
Available Customization
With the given market data, SNS Insider offers customization as per the company’s specific needs. The following customization options are available for the report:
Detailed Volume Analysis
Criss-Cross segment analysis (e.g. Product X Application)
Competitive Product Benchmarking
Geographic Analysis
Additional countries in any of the regions
Customized Data Representation
Detailed analysis and profiling of additional market players
Actuators Market size was valued at USD 62.89 Bn in 2023 and is expected to reach at USD 108.7 Bn by 2031 and grow at a CAGR of 7.08 % over the forecast period 2024-2031.
The Smart Ticketing Systems Market size was valued at USD 12.1 Billion in 2023 and will Reach USD 33.08 Billion by 2031, with CAGR of 13.4% by 2024-2031.
The Lawn & Garden Equipment Market size was valued at USD 27.90 Billion in 2023 and is now anticipated to grow to USD 54.39 Billion by 2032, displaying a compound annual growth rate (CAGR) of 7.7% during the forecast Period 2024 - 2032.
The Hybrid Valve Market Size was esteemed at USD 1.27 billion in 2023 and is supposed to arrive at USD 2.23 billion by 2032 with a growing CAGR of 6.47% over the forecast period 2024-2032.
The Automatic Tube Cleaning System Market size was estimated at USD 115 million in 2023 and is expected to reach USD 162 million by 2031 at a CAGR of 4.37% during the forecast period of 2023-2031.
The Crane and Hoist Market size was estimated at USD 30.95 billion in 2023 and is expected to reach USD 43.75 billion by 2032 at a CAGR of 3.92% during the forecast period of 2024-2032.
Hi! Click one of our member below to chat on Phone