The Peracetic Acid Market size was USD 1.00 billion in 2024 and is expected to reach USD 1.72 billion by 2032 and grow at a CAGR of 6.96% over the forecast period of 2025-2032.

To Get more information on Peracetic Acid Market - Request Free Sample Report
Increased activities of wastewater treatment drive the peracetic acid market growth. It is due to the growing urbanization, industrialization, and elevating environmental regulations concerning water pollution that are some of the key factors driving the growth of the market for wastewater treatment globally. Rapid urbanization also increases the demand for clean, safe water, forcing governments to invest substantial amounts into their wastewater treatment capabilities.
The U.S. Environmental Protection Agency (EPA) has made significant investments in wastewater infrastructure. Community water systems fund a multitude of water quality projects, including municipal wastewater facilities, nonpoint source pollution control, decentralized wastewater treatment systems, and stormwater runoff mitigation, all through low-cost loans.
Over USD 172 billion in low-cost loans have been provided since the inception of the CWSRF program. The program has earmarked USD 11.7 billion in 2023 alone to fund such projects and another USD 1 billion for emerging contaminants.
Moreover, the combination of health concerns, environmental sustainability goals, and stricter government regulations is making wastewater treatment a national priority in many countries, fueling the demand for effective disinfectants like peracetic acid.
Drivers
Growing pharmaceutical and biotechnology sectors drive the market growth
The need for stringent sterilization and contamination control is also increasing to comply with the regulations regulated by the U.S. Food and Drug Administration (FDA) and European Medicines Agency (EMA). Peracetic acid has gained popularity for its effective antimicrobial activity while breaking down into non-toxic by-products, and it is being used more frequently for cleanroom, medical devices, and bioprocessing sterilization. Furthermore, an increase in biologics production, vaccination manufacturing, and personalized medicines has raised demand for high-level disinfection, thus providing a wider scope for the adoption of peracetic acid.
Moreover, in the U.S., Biopharmaceutical innovation supported over 4.9 million total jobs in the economy, with over 1 million workers hired directly in the biopharmaceutical industry in the United States in 2022. The industry was responsible for more than USD 1.65 trillion in total economic output, about 3.6 percent of the U.S. economy. Furthermore, this may drive the market growth.
Restrain
Handling and storage challenges may hamper the market growth.
Peracetic acid is a highly reactive and corrosive chemical that causes difficulty for industry to store and handle. Maintaining these substances is itself another hurdle to resolve: they necessitate unique containers, temperature-monitored spaces, and stringent safety procedures to deter disintegration and calamity. But if harmonization changes happen, the compound quickly breaks down to make it less effective, causing safety problems. This pose added operational costs and operational complexities to the supply chain, in particular for smaller players like manufacturers and end-users. This is an important consideration that plays an integral role in the potential wider adoption of peracetic acid as a type of disinfectant by different industries, but the complexity and cost associated with the safe management of peracetic acid tend to limit its adoption significantly.
Opportunity
Rising demand for green disinfectants creates an opportunity in the market.
Increasing application of green disinfectants is anticipated to offer lucrative opportunities to key participants in the global peracetic acid market. Peracetic acid is unique in that it decomposes into harmless end-products: water, oxygen, and acetic acid; no hazardous residues are left over. This eco-friendly profile corresponds with the global governmental trends like the European Union's Green Deal and the United States Environmental Protection Agency's (EPA) Green Chemistry and Safer Choice Program.
In May 2023, Evonik expanded upon its Peraclean product line with a new, improved version. These new formulations will be adopted for long-lasting disinfection applications such as those in the food and beverage industries and municipal water treatment.
Additionally, increasing consumer awareness towards chemical safety and environmental health is compelling companies to use disinfectants that are highly effective with minimal effect on sustainability. This led manufacturers to introduce innovative and low-residue formulations of peracetic acid, which is yielding new opportunities for growth across verticals preferring green and responsible operations.
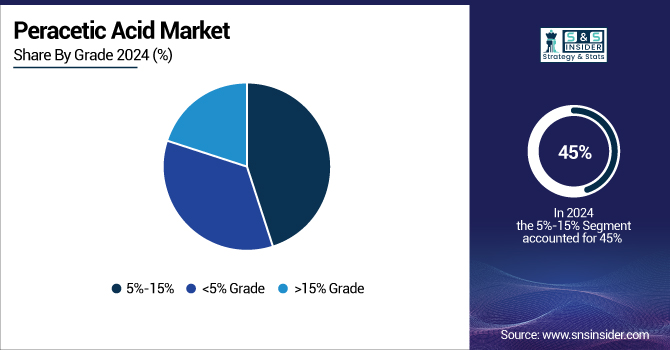
By Grade
5%-15% Grade held the largest market share, around 45% in 2024. It has an appropriate balance between efficiency and safety for various applications. Such a concentration range provides potent antimicrobial and disinfectant activity, ideal for use in water treatment, food & beverage sanitation, and health care sterilization applications while avoiding the increase of risks associated with high-concentration forms of this compound.
<5% Grade held the significant market share and fastest growing segment during the forecast period. The growing consumer demand for safer, green disinfectants has also increased the appeal of <5% products because these products are seen as effective for daily use, but remain safe because consumers are not exposed to the harsh chemicals in the higher concentration preparations. This grade is also approved for use in household products by regulatory agencies, for instance, the U.S. EPA and EU ECHA, which gives it a sizable piece of the market in regions that stress consumer safety and green products.
By Application
Disinfectant held the largest market share, around 32%, in 2024. Due to its wide applicability in several sectors, including healthcare, food & beverage, and water treatment, the disinfectant segment is projected to dominate the market. Peracetic acid has strong bactericidal, virucidal, and fungicidal properties, which have led to it being widely used for the sterilization of surfaces, equipment, and water supplies. The awareness about disinfectants in hospitals and clinics is also boosting the demand due to various factors, including the growth of the focus on infection control in healthcare systems.
Sanitizer held a significant market share and was the fastest-growing segment over the forecast period. It is because of its importance for hygiene helping in fitness care, food and beverage, and water treatment. Peracetic acid-based sanitizers are widely used owing to their broad-spectrum antimicrobial activity, short contact time, and low toxic residue, making them suitable for food contact surfaces and medical devices.
By End-User
The healthcare segment held the largest market share, around 28%, in 2024. The demand for peracetic acid reflects the growing investment in healthcare infrastructure across the globe and stringent infection control guidelines from organizations such as the World Health Organization (WHO) and the Centers of Disease Control and Prevention (CDC). In addition, the rising prevalence of surgical and medical procedures across the world has widened the scope for effective and highly efficient sterilants, making the healthcare segment the highest revenue contributor in the global market.
The water treatment segment held a significant market share. It is due to increasing global demand for efficient, non-chlorine solutions for municipal and industrial water treatment. Peracetic acid (PAA) is a broad-spectrum antimicrobial that does not form undesirable disinfection byproducts (DBPs) such as trihalomethanes (THMs) or chloramines, which is why PAA is a common choice in heavily regulated environments such as the U.S. and Europe. Also, the changing needs for safe drinking water and tighter regulation of wastewater discharges are driving adoption of peracetic acid.
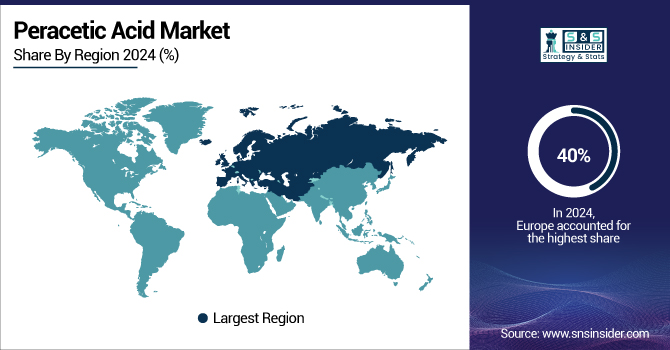
Europe held the largest market share of around 40% in 2024, with stringent environmental regulations and emphasis on sustainable and chlorine-free disinfection practices as its notable features. The regulation has encouraged various industries, especially water treatment, food processing, and healthcare, to transition to safer and more environmentally acceptable biocides such as peracetic acid.
The European Environment Agency (EEA) reported that in 2023, more than 88% of urban wastewater was treated in compliance with the urban wastewater treatment directive in Europe, namely using modern disinfection increasingly for tertiary treatment.
In March 2024, the continuous rise in demand for green disinfectants in areas like water treatment and healthcare has given rise to one of the more important recent developments: the enhancement of peracetic acid production capacity at Evonik Industries AG's Rheinfelden site in Germany.
North America held a significant market share. It is due to well-established wastewater treatment infrastructure in the region, comparatively more stringent regulatory frameworks, and higher consumer demand for safer, eco-non-chlorine-based disinfectants. The use of peracetic acid is based upon its approval for use in municipal water treatment, food processing, and sanitation in healthcare by agencies such as the United States Environmental Protection Agency (EPA) and the Canadian Food Inspection Agency (CFIA).
In 2023, more than 80% of large U.S. wastewater treatment plants used advanced disinfection processes, with peracetic acid preferred over chlorine because of reduced toxic byproducts (U.S. EPA, 2023).
Asia Pacific held a significant market share and is the fastest-growing segment during the forecast period. Rapid industrialization, increasing wastewater treatment projects, and heightened food safety and healthcare hygiene standards across Asia Pacific countries, such as China, India, and Japan, is expected to have a considerable contribution in the peracetic acid market share. Large-scale urbanization and the increasing need for stringent government regulations for environmental safety are key factors.
For instance, in China, the government's 14th Five-Year Plan for Urban Sewage Treatment and Resource Utilization (2021–2025) targets to increase wastewater treatment rates substantially and has attractive and green disinfectants, such as peracetic acid.
Get Customized Report as per Your Business Requirement - Enquiry Now
Solvay S.A., Evonik Industries AG, Ecolab Inc., Mitsubishi Gas Chemical Company, Inc., Kemira Oyj, Enviro Tech Chemical Services, Inc., SEITZ GmbH, Aditya Birla Chemicals, Christeyns, National Peroxide Limited
In December 2023, Thai Peroxide Co., Ltd., a joint venture with Aditya Birla Group, Evonik, further consolidated its strong position in the Asia Pacific market. This acquisition strengthens Evonik's specialty peroxides business, including peracetic acid, for applications in microchip production, solar cell manufacture, water treatment and food safety.
In 2023, Enviro Tech showcased its peracetic acid formulations at Texas Water 2023. Details: The company presented its Peragreen WW formulations, available in 15% and 22% concentrations, highlighting their effectiveness in wastewater disinfection.
| Report Attributes | Details |
|---|---|
| Market Size in 2024 | USD 1.00 Billion |
| Market Size by 2032 | USD 1.72 Billion |
| CAGR | CAGR of6.96% From 2025 to 2032 |
| Base Year | 2024 |
| Forecast Period | 2025-2032 |
| Historical Data | 2021-2023 |
| Report Scope & Coverage | Market Size, Segments Analysis, Competitive Landscape, Regional Analysis, DROC & SWOT Analysis, Forecast Outlook |
| Key Segments | • By Grade (<5% Grade, 5%-15% Grade, >15% Grade), • By Application (Disinfectant, Sanitizer, Sterilant, Others) • By End User (Food & Beverage, Healthcare, Pulp & Paper, Water Treatment, Others) |
| Regional Analysis/Coverage | North America (US, Canada, Mexico), Europe (Germany, France, UK, Italy, Spain, Poland, Turkey, Rest of Europe), Asia Pacific (China, India, Japan, South Korea, Singapore, Australia, Rest of Asia Pacific), Middle East & Africa (UAE, Saudi Arabia, Qatar, South Africa, Rest of Middle East & Africa), Latin America (Brazil, Argentina, Rest of Latin America) |
| Company Profiles | Solvay S.A., Evonik Industries AG, Ecolab Inc., Mitsubishi Gas Chemical Company, Inc., Kemira Oyj, Enviro Tech Chemical Services, Inc., SEITZ GmbH, Aditya Birla Chemicals, Christeyns, National Peroxide Limited |
1. Introduction
1.1 Market Definition
1.2 Scope (Inclusion and Exclusions)
1.3 Research Assumptions
2. Executive Summary
2.1 Market Overview
2.2 Regional Synopsis
2.3 Competitive Summary
3. Research Methodology
3.1 Top-Down Approach
3.2 Bottom-up Approach
3.3. Data Validation
3.4 Primary Interviews
4. Market Dynamics Impact Analysis
4.1 Market Driving Factors Analysis
4.1.1 Drivers
4.1.2 Restraints
4.1.3 Opportunities
4.1.4 Challenges
4.2 PESTLE Analysis
4.3 Porter’s Five Forces Model
5. Statistical Insights and Trends Reporting
5.1 Production Capacity and Utilization by Country, By Grade, 2023
5.2 Feedstock Prices by Country and Type, 2023
5.3 Regulatory Impact by Country and By Grade 2023.
5.4 Environmental Metrics: Emissions Data, Waste Management Practices, and Sustainability Initiatives by Region
5.5 Innovation and R&D, Type, 2023
6. Competitive Landscape
6.1 List of Major Companies, By Region
6.2 Market Share Analysis, By Region
6.3 Product Benchmarking
6.3.1 Product specifications and features
6.3.2 Pricing
6.4 Strategic Initiatives
6.4.1 Marketing and promotional activities
6.4.2 Distribution and Supply Chain Strategies
6.4.3 Expansion plans and new Product launches
6.4.4 Strategic partnerships and collaborations
6.5 Technological Advancements
6.6 Market Positioning and Branding
7. Peracetic Acid Market Segmentation by Grade
7.1 Chapter Overview
7.2 <5% Grade
7.2.1 <5% Grade Market Trends Analysis (2021-2032)
7.2.2 <5% Grade Market Size Estimates and Forecasts to 2032 (USD Billion)
7.3 5%-15% Grade
7.3.1 5%-15% Grade Market Trends Analysis (2021-2032)
7.3.2 5%-15% Grade Market Size Estimates and Forecasts to 2032 (USD Billion)
7.4 >15% Grade
7.4.1 >15% Grade Market Trends Analysis (2021-2032)
7.4.2 >15% Grade Market Size Estimates and Forecasts to 2032 (USD Billion)
8. Peracetic Acid Market Segmentation By Application
8.1 Chapter Overview
8.2 Disinfectant
8.2.1 Disinfectant Market Trend Analysis (2021-2032)
8.2.2 Disinfectant Market Size Estimates and Forecasts to 2032 (USD Billion)
8.3 Sanitizer
8.3.1 Sanitizer Market Trends Analysis (2021-2032)
8.3.2 Sanitizer Market Size Estimates and Forecasts to 2032 (USD Billion)
8.4 Sterilant
8.4.1 Sterilant Market Trend Analysis (2021-2032)
8.4.2 Sterilant Market Size Estimates and Forecasts to 2032 (USD Billion)
8.4 Others
8.4.1 Others Market Trend Analysis (2021-2032)
8.4.2 Others Market Size Estimates and Forecasts to 2032 (USD Billion)
9. Peracetic Acid Market Segmentation By End User
9.1 Chapter Overview
9.2 Food & Beverage
9.2.1 Food & Beverage Market Trends Analysis (2021-2032)
9.2.2 Food & Beverage Market Size Estimates and Forecasts to 2032 (USD Billion)
9.3 Healthcare
9.3.1 Healthcare Market Trends Analysis (2021-2032)
9.3.2 Healthcare Market Size Estimates and Forecasts to 2032 (USD Billion)
9.4 Pulp & Paper
9.4.1 Pulp & Paper Market Trends Analysis (2021-2032)
9.4.2 Pulp & Paper Market Size Estimates and Forecasts to 2032 (USD Billion)
9.5 Water Treatment
9.5.1 Water Treatment Market Trends Analysis (2021-2032)
9.5.2 Water Treatment Market Size Estimates and Forecasts to 2032 (USD Billion)
9.6 Others
9.6.1 Others Market Trends Analysis (2021-2032)
9.6.2 Others Market Size Estimates and Forecasts to 2032 (USD Billion)
10. Regional Analysis
10.1 Chapter Overview
10.2 North America
10.2.1 Trends Analysis
10.2.2 North America Peracetic Acid Market Estimates and Forecasts, by Country (2021-2032) (USD Billion)
10.2.3 North America Peracetic Acid Market Estimates and Forecasts, by Grade (2021-2032) (USD Billion)
10.2.4 North America Peracetic Acid Market Estimates and Forecasts, By Application (2021-2032) (USD Billion)
10.2.5 North America Peracetic Acid Market Estimates and Forecasts, By End User (2021-2032) (USD Billion)
10.2.6 USA
10.2.6.1 USA Peracetic Acid Market Estimates and Forecasts, by Grade (2021-2032) (USD Billion)
10.2.6.2 USA Peracetic Acid Market Estimates and Forecasts, By Application (2021-2032) (USD Billion)
10.2.6.3 USA Peracetic Acid Market Estimates and Forecasts, By End User (2021-2032) (USD Billion)
10.2.7 Canada
10.2.7.1 Canada Peracetic Acid Market Estimates and Forecasts, by Grade (2021-2032) (USD Billion)
10.2.7.2 Canada Peracetic Acid Market Estimates and Forecasts, By Application (2021-2032) (USD Billion)
10.2.7.3 Canada Peracetic Acid Market Estimates and Forecasts, By End User (2021-2032) (USD Billion)
10.2.8 Mexico
10.2.8.1 Mexico Peracetic Acid Market Estimates and Forecasts, by Grade (2021-2032) (USD Billion)
10.2.8.2 Mexico Peracetic Acid Market Estimates and Forecasts, By Application (2021-2032) (USD Billion)
10.2.8.3 Mexico Peracetic Acid Market Estimates and Forecasts, By End User (2021-2032) (USD Billion)
10.3 Europe
10.3.1 Trends Analysis
10.3.2 Europe Peracetic Acid Market Estimates and Forecasts, by Country (2021-2032) (USD Billion)
10.3.3 Europe Peracetic Acid Market Estimates and Forecasts, by Grade (2021-2032) (USD Billion)
10.3.4 Europe Peracetic Acid Market Estimates and Forecasts, By Application (2021-2032) (USD Billion)
10.3.5 Europe Peracetic Acid Market Estimates and Forecasts, By End User (2021-2032) (USD Billion)
10.3.6 Germany
10.3.6.1 Germany Peracetic Acid Market Estimates and Forecasts, by Grade (2021-2032) (USD Billion)
10.3.6.2 Germany Peracetic Acid Market Estimates and Forecasts, By Application (2021-2032) (USD Billion)
10.3.6.3 Germany Peracetic Acid Market Estimates and Forecasts, By End User (2021-2032) (USD Billion)
10.3.7 France
10.3.7.1 France Peracetic Acid Market Estimates and Forecasts, by Grade (2021-2032) (USD Billion)
10.3.7.2 France Peracetic Acid Market Estimates and Forecasts, By Application (2021-2032) (USD Billion)
10.3.7.3 France Peracetic Acid Market Estimates and Forecasts, By End User (2021-2032) (USD Billion)
10.3.8 UK
10.3.8.1 UK Peracetic Acid Market Estimates and Forecasts, by Grade (2021-2032) (USD Billion)
10.3.8.2 UK Peracetic Acid Market Estimates and Forecasts, By Application (2021-2032) (USD Billion)
10.3.8.3 UK Peracetic Acid Market Estimates and Forecasts, By End User (2021-2032) (USD Billion)
10.3.9 Italy
10.3.9.1 Italy Peracetic Acid Market Estimates and Forecasts, by Grade (2021-2032) (USD Billion)
10.3.9.2 Italy Peracetic Acid Market Estimates and Forecasts, By Application (2021-2032) (USD Billion)
10.3.9.3 Italy Peracetic Acid Market Estimates and Forecasts, By End User (2021-2032) (USD Billion)
10.3.10 Spain
10.3.10.1 Spain Peracetic Acid Market Estimates and Forecasts, by Grade (2021-2032) (USD Billion)
10.3.10.2 Spain Peracetic Acid Market Estimates and Forecasts, By Application (2021-2032) (USD Billion)
10.3.10.3 Spain Peracetic Acid Market Estimates and Forecasts, By End User (2021-2032) (USD Billion)
10.3.11 Poland
10.3.11.1 Poland Peracetic Acid Market Estimates and Forecasts, by Grade (2021-2032) (USD Billion)
10.3.11.2 Poland Peracetic Acid Market Estimates and Forecasts, By Application (2021-2032) (USD Billion)
10.3.11.3 Poland Peracetic Acid Market Estimates and Forecasts, By End User (2021-2032) (USD Billion)
10.3.12 Turkey
10.3.12.1 Turkey Peracetic Acid Market Estimates and Forecasts, by Grade (2021-2032) (USD Billion)
10.3.12.2 Turkey Peracetic Acid Market Estimates and Forecasts, By Application (2021-2032) (USD Billion)
10.3.12.3 Turkey Peracetic Acid Market Estimates and Forecasts, By End User (2021-2032) (USD Billion)
10.3.13 Rest of Europe
10.3.13.1 Rest of Europe Peracetic Acid Market Estimates and Forecasts, by Grade (2021-2032) (USD Billion)
10.3.13.2 Rest of Europe Peracetic Acid Market Estimates and Forecasts, By Application (2021-2032) (USD Billion)
10.3.13.3 Rest of Europe Peracetic Acid Market Estimates and Forecasts, By End User (2021-2032) (USD Billion)
10.4 Asia Pacific
10.4.1 Trends Analysis
10.4.2 Asia Pacific Peracetic Acid Market Estimates and Forecasts, by Country (2021-2032) (USD Billion)
10.4.3 Asia Pacific Peracetic Acid Market Estimates and Forecasts, by Grade (2021-2032) (USD Billion)
10.4.4 Asia Pacific Peracetic Acid Market Estimates and Forecasts, By Application (2021-2032) (USD Billion)
10.4.5 Asia Pacific Peracetic Acid Market Estimates and Forecasts, By End User (2021-2032) (USD Billion)
10.4.6 China
10.4.6.1 China Peracetic Acid Market Estimates and Forecasts, by Grade (2021-2032) (USD Billion)
10.4.6.2 China Peracetic Acid Market Estimates and Forecasts, By Application (2021-2032) (USD Billion)
10.4.6.3 China Peracetic Acid Market Estimates and Forecasts, By End User (2021-2032) (USD Billion)
10.4.7 India
10.4.7.1 India Peracetic Acid Market Estimates and Forecasts, by Grade (2021-2032) (USD Billion)
10.4.7.2 India Peracetic Acid Market Estimates and Forecasts, By Application (2021-2032) (USD Billion)
10.4.7.3 India Peracetic Acid Market Estimates and Forecasts, By End User (2021-2032) (USD Billion)
10.4.8 Japan
10.4.8.1 Japan Peracetic Acid Market Estimates and Forecasts, by Grade (2021-2032) (USD Billion)
10.4.8.2 Japan Peracetic Acid Market Estimates and Forecasts, By Application (2021-2032) (USD Billion)
10.4.8.3 Japan Peracetic Acid Market Estimates and Forecasts, By End User (2021-2032) (USD Billion)
10.4.9 South Korea
10.4.9.1 South Korea Peracetic Acid Market Estimates and Forecasts, by Grade (2021-2032) (USD Billion)
10.4.9.2 South Korea Peracetic Acid Market Estimates and Forecasts, By Application (2021-2032) (USD Billion)
10.4.9.3 South Korea Peracetic Acid Market Estimates and Forecasts, By End User (2021-2032) (USD Billion)
10.4.10 Singapore
10.4.10.1 Singapore Peracetic Acid Market Estimates and Forecasts, by Grade (2021-2032) (USD Billion)
10.4.10.2 Singapore Peracetic Acid Market Estimates and Forecasts, By Application (2021-2032) (USD Billion)
10.4.10.3 Singapore Peracetic Acid Market Estimates and Forecasts, By End User (2021-2032) (USD Billion)
10.4.11 Australia
10.4.11.1 Australia Peracetic Acid Market Estimates and Forecasts, by Grade (2021-2032) (USD Billion)
10.4.11.2 Australia Peracetic Acid Market Estimates and Forecasts, By Application (2021-2032) (USD Billion)
10.4.11.3 Australia Peracetic Acid Market Estimates and Forecasts, By End User (2021-2032) (USD Billion)
10.4.12 Rest of Asia Pacific
10.4.12.1 Rest of Asia Pacific Peracetic Acid Market Estimates and Forecasts, by Grade (2021-2032) (USD Billion)
10.4.12.2 Rest of Asia Pacific Peracetic Acid Market Estimates and Forecasts, By Application (2021-2032) (USD Billion)
10.4.12.3 Rest of Asia Pacific Peracetic Acid Market Estimates and Forecasts, By End User (2021-2032) (USD Billion)
10.5 Middle East and Africa
10.5.1 Trends Analysis
10.5.2 Middle East and Africa Peracetic Acid Market Estimates and Forecasts, by Country (2021-2032) (USD Billion)
10.5.3 Middle East and Africa Peracetic Acid Market Estimates and Forecasts, by Grade (2021-2032) (USD Billion)
10.5.4 Middle East and Africa Peracetic Acid Market Estimates and Forecasts, By Application (2021-2032) (USD Billion)
10.5.5 Middle East and Africa Peracetic Acid Market Estimates and Forecasts, By End User (2021-2032) (USD Billion)
10.5.6 UAE
10.5.6.1 UAE Peracetic Acid Market Estimates and Forecasts, by Grade (2021-2032) (USD Billion)
10.5.6.2 UAE Peracetic Acid Market Estimates and Forecasts, By Application (2021-2032) (USD Billion)
10.5.6.3 UAE Peracetic Acid Market Estimates and Forecasts, By End User (2021-2032) (USD Billion)
10.5.7 Saudi Arabia
10.5.7.1 Saudi Arabia Peracetic Acid Market Estimates and Forecasts, by Grade (2021-2032) (USD Billion)
10.5.7.2 Saudi Arabia Peracetic Acid Market Estimates and Forecasts, By Application (2021-2032) (USD Billion)
10.5.7.3 Saudi Arabia Peracetic Acid Market Estimates and Forecasts, By End User (2021-2032) (USD Billion)
10.5.8 Saudi Arabia
10.5.8.1 Saudi Arabia Peracetic Acid Market Estimates and Forecasts, by Grade (2021-2032) (USD Billion)
10.5.8.2 Saudi Arabia Peracetic Acid Market Estimates and Forecasts, By Application (2021-2032) (USD Billion)
10.5.8.3 Saudi Arabia Peracetic Acid Market Estimates and Forecasts, By End User (2021-2032) (USD Billion)
10.5.9 Qatar
10.5.9.1 Qatar Peracetic Acid Market Estimates and Forecasts, by Grade (2021-2032) (USD Billion)
10.5.9.2 Qatar Peracetic Acid Market Estimates and Forecasts, By Application (2021-2032) (USD Billion)
10.5.9.3 Qatar Peracetic Acid Market Estimates and Forecasts, By End User (2021-2032) (USD Billion)
10.5.10 South Africa
10.5.10.1 South Africa Peracetic Acid Market Estimates and Forecasts, by Grade (2021-2032) (USD Billion)
10.5.10.2 South Africa Peracetic Acid Market Estimates and Forecasts, By Application (2021-2032) (USD Billion)
10.5.10.3 South Africa Peracetic Acid Market Estimates and Forecasts, By End User (2021-2032) (USD Billion)
10.5.11 Rest of Middle East & Africa
10.5.11.1 Rest of Middle East & Africa Peracetic Acid Market Estimates and Forecasts, by Grade (2021-2032) (USD Billion)
10.5.11.2 Rest of Middle East & Africa Peracetic Acid Market Estimates and Forecasts, By Application (2021-2032) (USD Billion)
10.5.11.3 Rest of Middle East & Africa Peracetic Acid Market Estimates and Forecasts, By End User (2021-2032) (USD Billion)
10.6 Latin America
10.6.1 Trends Analysis
10.6.2 Latin America Peracetic Acid Market Estimates and Forecasts, by Country (2021-2032) (USD Billion)
10.6.3 Latin America Peracetic Acid Market Estimates and Forecasts, by Grade (2021-2032) (USD Billion)
10.6.4 Latin America Peracetic Acid Market Estimates and Forecasts, By Application (2021-2032) (USD Billion)
10.6.5 Latin America Peracetic Acid Market Estimates and Forecasts, By End User (2021-2032) (USD Billion)
10.6.6 Brazil
10.6.6.1 Brazil Peracetic Acid Market Estimates and Forecasts, by Grade (2021-2032) (USD Billion)
10.6.6.2 Brazil Peracetic Acid Market Estimates and Forecasts, By Application (2021-2032) (USD Billion)
10.6.6.3 Brazil Peracetic Acid Market Estimates and Forecasts, By End User (2021-2032) (USD Billion)
10.6.7 Argentina
10.6.7.1 Argentina Peracetic Acid Market Estimates and Forecasts, by Grade (2021-2032) (USD Billion)
10.6.7.2 Argentina Peracetic Acid Market Estimates and Forecasts, By Application (2021-2032) (USD Billion)
10.6.7.3 Argentina Peracetic Acid Market Estimates and Forecasts, By End User (2021-2032) (USD Billion)
10.6.8 Rest of Latin America
10.6.8.1 Rest of Latin America Peracetic Acid Market Estimates and Forecasts, by Grade (2021-2032) (USD Billion)
10.6.8.2 Rest of Latin America Peracetic Acid Market Estimates and Forecasts, By Application (2021-2032) (USD Billion)
10.6.8.3 Rest of Latin America Peracetic Acid Market Estimates and Forecasts, By End User (2021-2032) (USD Billion)
11. Company Profiles
11.1 Solvay S.A.
11.1.1 Company Overview
11.1.2 Financial
11.1.3 Product/ Services Offered
11.1.4 SWOT Analysis
11.2 Evonik Industries AG
11.2.1 Company Overview
11.2.2 Financial
11.2.3 Product/ Services Offered
11.2.4 SWOT Analysis
11.3 Ecolab Inc.
11.3.1 Company Overview
11.3.2 Financial
11.3.3 Product/ Services Offered
11.3.4 SWOT Analysis
11.4 Mitsubishi Gas Chemical Company, Inc.
11.4.1 Company Overview
11.4.2 Financial
11.4.3 Product/ Services Offered
11.4.4 SWOT Analysis
11.5 Kemira Oyj
11.5.1 Company Overview
11.5.2 Financial
11.5.3 Product/ Services Offered
11.5.4 SWOT Analysis
11.6 Enviro Tech Chemical Services, Inc.
11.6.1 Company Overview
11.6.2 Financial
11.6.3 Product/ Services Offered
11.6.4 SWOT Analysis
11.7 SEITZ GmbH
11.7.1 Company Overview
11.7.2 Financial
11.7.3 Product/ Services Offered
11.7.4 SWOT Analysis
11.8 Aditya Birla Chemicals
11.8.1 Company Overview
11.8.2 Financial
11.8.3 Product/ Services Offered
11.8.4 SWOT Analysis
11.9 Christeyns
11.9.1 Company Overview
11.9.2 Financial
11.9.3 Product/ Services Offered
11.9.4 SWOT Analysis
11.10 National Peroxide Limited
11.10.1 Company Overview
11.10.2 Financial
11.10.3 Product/ Services Offered
11.10.4 SWOT Analysis
12. Use Cases and Best Practices
13. Conclusion
An accurate research report requires proper strategizing as well as implementation. There are multiple factors involved in the completion of good and accurate research report and selecting the best methodology to compete the research is the toughest part. Since the research reports we provide play a crucial role in any company’s decision-making process, therefore we at SNS Insider always believe that we should choose the best method which gives us results closer to reality. This allows us to reach at a stage wherein we can provide our clients best and accurate investment to output ratio.
Each report that we prepare takes a timeframe of 350-400 business hours for production. Starting from the selection of titles through a couple of in-depth brain storming session to the final QC process before uploading our titles on our website we dedicate around 350 working hours. The titles are selected based on their current market cap and the foreseen CAGR and growth.
The 5 steps process:
Step 1: Secondary Research:
Secondary Research or Desk Research is as the name suggests is a research process wherein, we collect data through the readily available information. In this process we use various paid and unpaid databases which our team has access to and gather data through the same. This includes examining of listed companies’ annual reports, Journals, SEC filling etc. Apart from this our team has access to various associations across the globe across different industries. Lastly, we have exchange relationships with various university as well as individual libraries.

Step 2: Primary Research
When we talk about primary research, it is a type of study in which the researchers collect relevant data samples directly, rather than relying on previously collected data. This type of research is focused on gaining content specific facts that can be sued to solve specific problems. Since the collected data is fresh and first hand therefore it makes the study more accurate and genuine.
We at SNS Insider have divided Primary Research into 2 parts.
Part 1 wherein we interview the KOLs of major players as well as the upcoming ones across various geographic regions. This allows us to have their view over the market scenario and acts as an important tool to come closer to the accurate market numbers. As many as 45 paid and unpaid primary interviews are taken from both the demand and supply side of the industry to make sure we land at an accurate judgement and analysis of the market.
This step involves the triangulation of data wherein our team analyses the interview transcripts, online survey responses and observation of on filed participants. The below mentioned chart should give a better understanding of the part 1 of the primary interview.

Part 2: In this part of primary research the data collected via secondary research and the part 1 of the primary research is validated with the interviews from individual consultants and subject matter experts.
Consultants are those set of people who have at least 12 years of experience and expertise within the industry whereas Subject Matter Experts are those with at least 15 years of experience behind their back within the same space. The data with the help of two main processes i.e., FGDs (Focused Group Discussions) and IDs (Individual Discussions). This gives us a 3rd party nonbiased primary view of the market scenario making it a more dependable one while collation of the data pointers.
Step 3: Data Bank Validation
Once all the information is collected via primary and secondary sources, we run that information for data validation. At our intelligence centre our research heads track a lot of information related to the market which includes the quarterly reports, the daily stock prices, and other relevant information. Our data bank server gets updated every fortnight and that is how the information which we collected using our primary and secondary information is revalidated in real time.

Step 4: QA/QC Process
After all the data collection and validation our team does a final level of quality check and quality assurance to get rid of any unwanted or undesired mistakes. This might include but not limited to getting rid of the any typos, duplication of numbers or missing of any important information. The people involved in this process include technical content writers, research heads and graphics people. Once this process is completed the title gets uploader on our platform for our clients to read it.
Step 5: Final QC/QA Process:
This is the last process and comes when the client has ordered the study. In this process a final QA/QC is done before the study is emailed to the client. Since we believe in giving our clients a good experience of our research studies, therefore, to make sure that we do not lack at our end in any way humanly possible we do a final round of quality check and then dispatch the study to the client.
By Grade
By Application
By End User
Request for Segment Customization as per your Business Requirement: Segment Customization Request
North America
Europe
Asia Pacific
Middle East & Africa
Latin America
Request for Country Level Research Report: Country Level Customization Request
Available Customization
With the given market data, SNS Insider offers customization as per the company’s specific needs. The following customization options are available for the report:
The Aliphatic Hydrocarbon Market size was USD 3.95 billion in 2023 and is expected to reach USD 6.02 billion by 2032 and grow at a CAGR of 4.81% over the forecast period of 2024-2032.
Aroma Chemicals Market was valued at USD 5.59 Billion in 2023 and is expected to reach USD 8.66 Billion by 2032, at a CAGR of 4.99% from 2024-2032
The Engineered Plastics Market Size was valued at USD 114.80 billion in 2023 and is expected to reach USD 190.68 billion by 2032 and grow at a CAGR of 5.80% over the forecast period 2024-2032.
The Biostimulants Market Size was valued at USD 6.1 billion in 2023, and is expected to reach USD 11.9 billion by 2032, and grow at a CAGR of 7.7% over the forecast period 2024-2032.
The Chlorine Dioxide Market size was USD 1.09 Billion in 2023 and is expected to reach USD 1.71 Million by 2032, growing at a CAGR of 5.12 % from 2024-2032.
The Flavors & Fragrances Market Size was valued at USD 30.5 billion in 2023, and is expected to reach USD 49.3 billion by 2032, and grow at a CAGR of 5.5% over the forecast period 2024-2032.

Hi! Click one of our member below to chat on Phone
© 2025 All Rights Reserved by SNS Insider Pvt Ltd


