The Pelargonic Acid market size was valued at USD 189.55 million in 2023 and is expected to reach USD 345.14 million by 2032, growing at a CAGR of 6.89% over the forecast period of 2024-2032. The pelargonic acid market report covers production capacity and utilization by region, with a focus on application sectors like agrochemicals and personal care. The report also examines feedstock prices and raw material costs across major regions, along with the impact of regional regulations on market dynamics. Environmental metrics, including emissions and sustainability practices, are analyzed to gauge the industry's eco-footprint. Additionally, it delves into R&D investments and innovations in bio-based production methods, as well as the adoption rates of Pelargonic Acid-based products across different regions, providing a detailed picture of the market’s growth drivers.
Get E-PDF Sample Report on Pelargonic Acid Market - Request Sample Report
Drivers
Growing demand for bio-based herbicides drives the market growth.
The rapid global demand for bio-based herbicides is playing an influential role in the growth of the Pelargonic Acid Market, as an increasing portion of agriculture industries turn to green herbicides in place of traditional synthetic herbicides. As soil degradation becomes increasingly prominent, alongside pollution and health issues from herbicides based on chemicals to humans and the environment, farmers are transitioning towards sustainable solutions for weed control. Pelargonic acid is a biodegradable, low-toxic, and effective non-selective herbicide that has gained popularity due to its naturally derived origins. Moreover, the need to limit the use of synthetic herbicides such as glyphosate and paraquat due to government regulations in several countries has provided an impetus to thyme-based herbicides. Further propelling the market growth are policies that support organic farming and regenerative agriculture, allowing pelargonic acid to solidify its position as the backbone of sustainable agriculture.
Restraint
High production costs associated with pelargonic acid may hamper the market growth.
The market growth is hindered by the high production costs of pelargonic acid as the processes for extraction and purification require high-end technologies and raw materials, further increasing costs. Bio-based feedstock dependence makes their manufacturing costs higher than synthetic ones. Furthermore, both the intricacy of the production process and the stringent quality control measures contribute to expenses on the field level. The currently high costs of pelargonic acid as a natural herbicide and industrial chemical compared to conventional alternatives, nevertheless, restricts its widespread use, especially in price-sensitive markets. Though growing demand for sustainable and bio-based solutions is paving the way for market expansion, the cost barrier is less accomplished sustenance, restraining its penetration in developing economies as affordability is a significant constraint.
Opportunities
Increasing adoption of organic farming practices create an opportunity for the market.
Organic farming practices are being increasingly adopted by farmers in many countries around the globe, offering a great opportunity to the pelargonic acid market because the farmers and agricultural industry at large are willing to switch to natural-based solutions instead of synthetic chemicals. As consumers shift towards organic, premium, and chemical-free food, governments across the world are promoting organic farming by providing subsidies and incentives while also implementing strict regulations against synthetic pesticides and herbicides. As a bio-based, biodegradable, and non-restricted herbicide, pelargonic acid is suitable for use in certified organic crops as a weed control option that complies with organic farming principles. Moreover, the rising awareness associated with soil health, preservation of biodiversity, and sustainable agriculture are further catalyzing the bio-herbicides market, thereby accelerating pelargonic acid growth that caters to the expanding organic farming industry.
Challenges
Regulations and standards imposed by regulatory bodies may challenge market growth.
The growth of the pelargonic acid market is challenged by regulations and standards set by regulatory bodies. The breadth and depth of different regulatory frameworks around the world can be both deep and complex, requiring companies to allocate substantial resources to their compliance efforts. For example, pelargonic acid-based herbicides are proving favorably approved, but different standards operate in different nations, requiring a thorough understanding and compliance. The increase in complexity can result in delays in approvals of products and higher market-entry costs. A further increase in operational costs can be due to the strict guidelines of environmental and safety regulations that may require alterations in production processes. Hence, such regulatory challenges create entry and extension barriers in the market, especially for small-scale players, creating an overall challenge in the pelargonic acid market growth.
By Grade
The synthetic segment held the largest market share, around 68%in 2023. Synthetic production methods allow for more control of purity and yield and provide homogenous product quality, which is important for industrial applications. It is also a shorter extraction time, and pelargonic acid synthetic production costs less money than natural extraction so it also more economical in large-scale production. Since the raw materials for synthetic production are available, there are fewer uncertainties regarding the supply chain. Due to these benefits, the synthetic segment of the pelargonic acid market has been dominating. The synthetic production process ensures a consistent and scalable supply, which is crucial for these applications. This reliability in meeting industrial demands has been a significant factor in the synthetic segment's market leadership.
By Application
The herbicide segment held the largest market share, around 28% in 2023. The growing popularity of biopesticides concerning environmental and human health safety is the main reason to favor the eco-friendly herbicides in agriculture that is due to the growing consumer awareness and demand between farmers regarding the adverse effects associated with chemical pesticides on human health and the environment. Alternatively, pelargonic acid, a naturally occurring compound, is also often used as a non-selective contact herbicide with a wide spectrum of activity against most weeds. Due to its natural origin and low toxicity, it is commonly used in organic farming. The increasing focus on sustainability in agriculture and the trend toward natural herbicidal alternatives have also boosted the adoption of pelargonic acid in herbicide formulations.
Get Customized Report as Per Your Business Requirement - Request For Customized Report
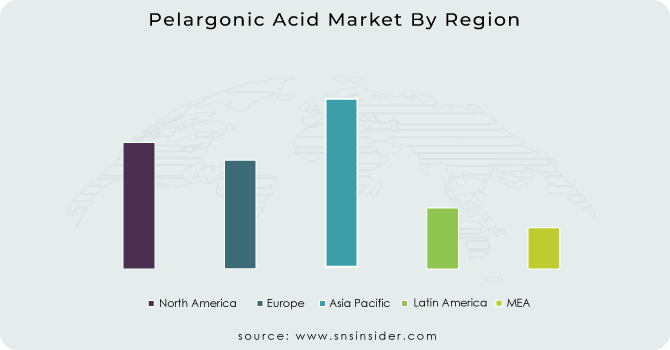
Asia Pacific held the largest market share, around 45.2% in 2023 due to the growing agriculture industry in the region, rising bio-based herbicides demand, and favorable government initiatives for sustainable agriculture. Growing organic farming and chemical-free crop protection solutions across developing nations such as China and India, in addition to growing environmental awareness across developed economic regions such as Germany and Japan, will boost market growth for pelargonic acid-based. Shortly after, the rapid industrialization and urbanization in this region have also drove the demand for pelargonic acid in the use of lubricants, coatings, and personal care products.
North America held a significant share in the forecast period. It is demand for bio-based herbicides is high, as the region is home to strict environmental regulations and a growing rate of sustainable agricultural practice adoption. Pelargonic acid is a popular natural herbicide amongst organic farms in United States and Canada, where organic farming has been booming over the years in commanding prices. In addition, the high consumption of pelargonic acid in the region can be attributed to its thriving industrial sectors such as lubricants, coatings, and personal care, among others. The dominance of North America is also supported by the present of leading market players, advancement of production technologies and continuing R&D activities. Additionally, the regional market growth is mainly fueled by government policies and incentives that promote bio-based chemicals.
Kunshan Odowell Co., Ltd
Central Drug House (P) Ltd.
Croda International Plc
Glentham Life Sciences Limited
Emery Oleochemicals
Matrica S.p.A
Haihang Industry
Tokyo Chemical Industry Co., Ltd.
Zhengzhou Yibang Industry & Commerce Co., Ltd.
OQ Chemicals GmbH
Elevance Renewable Sciences
Vantage Specialty Chemicals
BASF SE
Sigma-Aldrich Corporation
Alfa Aesar
Penta Manufacturing Company
Spectrum Chemical Manufacturing Corp.
TCI America
Santa Cruz Biotechnology, Inc.
Acros Organics
| Report Attributes | Details |
| Market Size in 2023 | US$ 189.55 Mn |
| Market Size by 2032 | US$ 345.14 Mn |
| CAGR | CAGR of 6.89% From 2024 to 2032 |
| Base Year | 2023 |
| Forecast Period | 2024-2032 |
| Historical Data | 2020-2022 |
| Report Scope & Coverage | Market Size, Segments Analysis, Competitive Landscape, Regional Analysis, DROC & SWOT Analysis, Forecast Outlook |
| Key Segments | • By Grade (Synthetic Grade and Natural Grade) • By Application (Detergents, Personal Care & Cosmetics, Lacquer & Coatings, Lubricants, Food Additives, Herbicide, and Others) |
| Regional Analysis/Coverage | North America (US, Canada, Mexico), Europe (Eastern Europe [Poland, Romania, Hungary, Turkey, Rest of Eastern Europe] Western Europe] Germany, France, UK, Italy, Spain, Netherlands, Switzerland, Austria, Rest of Western Europe]). Asia Pacific (China, India, Japan, South Korea, Vietnam, Singapore, Australia, Rest of Asia Pacific), Middle East & Africa (Middle East [UAE, Egypt, Saudi Arabia, Qatar, Rest of Middle East], Africa [Nigeria, South Africa, Rest of Africa], Latin America (Brazil, Argentina, Colombia Rest of Latin America) |
| Company Profiles | 3M, The Window Film Company, Eastman Chemical Company, Garware Suncontrol, Avery Dennison Corporation, Saint Gobain, Madico Inc., Solar Screen International SA, XPEL Inc., Purlfrost, Polytronix Inc., Johnson Window Films, Hanita Coatings, V-KOOL, Reflectiv, Global Window Films, Huper |
Ans. The Compound Annual Growth rate for Pelargonic Acid Market over the forecast period is 6.6%.
Ans. The projected market size for the Pelargonic Acid Market is USD345.14 million by 2032.
Ans: The synthetic grade segment dominated the Pelargonic Acid Market with a revenue share of about 68% in 2023.
Ans: Kunshan Odowell Co. Ltd, Croda International Plc., Central Drug House, Glentham Life Sciences Limited, Matrica S.p.A, Emery Oleochemicals are the key players in the Pelargonic Acid Market.
Ans: The Asia Pacific led the Pelargonic Acid Market in the region with the highest revenue share in 2023
Table of Content
1. Introduction
1.1 Market Definition
1.2 Scope (Inclusion and Exclusions)
1.3 Research Assumptions
2. Executive Summary
2.1 Market Overview
2.2 Regional Synopsis
2.3 Competitive Summary
3. Research Methodology
3.1 Top-Down Approach
3.2 Bottom-up Approach
3.3. Data Validation
3.4 Primary Interviews
4. Market Dynamics Impact Analysis
4.1 Market Driving Factors Analysis
4.1.2 Drivers
4.1.2 Restraints
4.1.3 Opportunities
4.1.4 Challenges
4.2 PESTLE Analysis
4.3 Porter’s Five Forces Model
5. Statistical Insights and Trends Reporting
5.1 Production Capacity and Utilization, by Country, By Type, 2023
5.2 Feedstock Prices, by Country, By Type, 2023
5.3 Regulatory Impact, by Country, By Grade 2023.
5.4 Environmental Metrics: Emissions Data, Waste Management Practices, and Sustainability Initiatives, by Region
5.5 Innovation and R&D, Type, 2023
6. Competitive Landscape
6.1 List of Major Companies, By Region
6.2 Market Share Analysis, By Region
6.3 Product Benchmarking
6.3.1 Product specifications and features
6.3.2 Pricing
6.4 Strategic Initiatives
6.4.1 Marketing and promotional activities
6.4.2 Distribution and Supply Chain Strategies
6.4.3 Expansion Plans and New Product Launches
6.4.4 Strategic partnerships and collaborations
6.5 Technological Advancements
6.6 Market Positioning and Branding
7. Pelargonic Acid Market Segmentation, By Grade
7.1 Chapter Overview
7.2 Synthetic Grade
7.2.1 Synthetic Grade Trends Analysis (2020-2032)
7.2.2 Synthetic Grade Market Size Estimates and Forecasts to 2032 (USD Million)
7.3 Natural Grade
7.3.1 Natural Grade Market Trends Analysis (2020-2032)
7.3.2 Natural Grade Market Size Estimates and Forecasts to 2032 (USD Million)
8. Pelargonic Acid Market Segmentation, by Application
8.1 Chapter Overview
8.2 Detergents
8.2.1 Detergents Market Trends Analysis (2020-2032)
8.2.2 Detergents Market Size Estimates and Forecasts to 2032 (USD Million)
8.3 Personal Care & Cosmetics
8.3.1 Personal Care & Cosmetics Market Trends Analysis (2020-2032)
8.3.2 Personal Care & Cosmetics Market Size Estimates and Forecasts to 2032 (USD Million)
8.4 Lacquer & Coatings
8.4.1 Lacquer & Coatings Market Trends Analysis (2020-2032)
8.4.2 Lacquer & Coatings Market Size Estimates and Forecasts to 2032 (USD Million)
8.5 Lubricants
8.5.1 Lubricants Market Trends Analysis (2020-2032)
8.5.2 Lubricants Market Size Estimates and Forecasts to 2032 (USD Million)
8.6 Food Additives
8.6.1 Food Additives Market Trends Analysis (2020-2032)
8.6.2 Food Additives Market Size Estimates and Forecasts to 2032 (USD Million)
8.7 Herbicide
8.7.1 Herbicide Market Trends Analysis (2020-2032)
8.7.2 Herbicide Market Size Estimates and Forecasts to 2032 (USD Million)
8.8 Others
8.8.1 Others Market Trends Analysis (2020-2032)
8.8.2 Others Market Size Estimates and Forecasts to 2032 (USD Million)
9. Regional Analysis
9.1 Chapter Overview
9.2 North America
9.2.1 Trends Analysis
9.2.2 North America Pelargonic Acid Market Estimates and Forecasts, by Country (2020-2032) (USD Million)
9.2.3 North America Pelargonic Acid Market Estimates and Forecasts, By Grade (2020-2032) (USD Million)
9.2.4 North America Pelargonic Acid Market Estimates and Forecasts, by Application (2020-2032) (USD Million)
9.2.5 USA
9.2.5.1 USA Pelargonic Acid Market Estimates and Forecasts, By Grade (2020-2032) (USD Million)
9.2.5.2 USA Pelargonic Acid Market Estimates and Forecasts, by Application (2020-2032) (USD Million)
9.2.6 Canada
9.2.6.1 Canada Pelargonic Acid Market Estimates and Forecasts, By Grade (2020-2032) (USD Million)
9.2.6.2 Canada Pelargonic Acid Market Estimates and Forecasts, by Application (2020-2032) (USD Million)
9.2.7 Mexico
9.2.7.1 Mexico Pelargonic Acid Market Estimates and Forecasts, By Grade (2020-2032) (USD Million)
9.2.7.2 Mexico Pelargonic Acid Market Estimates and Forecasts, by Application (2020-2032) (USD Million)
9.3 Europe
9.3.1 Eastern Europe
9.3.1.1 Trends Analysis
9.3.1.2 Eastern Europe Pelargonic Acid Market Estimates and Forecasts, by Country (2020-2032) (USD Million)
9.3.1.3 Eastern Europe Pelargonic Acid Market Estimates and Forecasts, By Grade (2020-2032) (USD Million)
9.3.1.4 Eastern Europe Pelargonic Acid Market Estimates and Forecasts, by Application (2020-2032) (USD Million)
9.3.1.5 Poland
9.3.1.5.1 Poland Pelargonic Acid Market Estimates and Forecasts, By Grade (2020-2032) (USD Million)
9.3.1.5.2 Poland Pelargonic Acid Market Estimates and Forecasts, by Application (2020-2032) (USD Million)
9.3.1.6 Romania
9.3.1.6.1 Romania Pelargonic Acid Market Estimates and Forecasts, By Grade (2020-2032) (USD Million)
9.3.1.6.2 Romania Pelargonic Acid Market Estimates and Forecasts, by Application (2020-2032) (USD Million)
9.3.1.7 Hungary
9.3.1.7.1 Hungary Pelargonic Acid Market Estimates and Forecasts, By Grade (2020-2032) (USD Million)
9.3.1.7.2 Hungary Pelargonic Acid Market Estimates and Forecasts, by Application (2020-2032) (USD Million)
9.3.1.8 Turkey
9.3.1.8.1 Turkey Pelargonic Acid Market Estimates and Forecasts, By Grade (2020-2032) (USD Million)
9.3.1.8.2 Turkey Pelargonic Acid Market Estimates and Forecasts, by Application (2020-2032) (USD Million)
9.3.1.9 Rest of Eastern Europe
9.3.1.9.1 Rest of Eastern Europe Pelargonic Acid Market Estimates and Forecasts, By Grade (2020-2032) (USD Million)
9.3.1.9.2 Rest of Eastern Europe Pelargonic Acid Market Estimates and Forecasts, by Application (2020-2032) (USD Million)
9.3.2 Western Europe
9.3.2.1 Trends Analysis
9.3.2.2 Western Europe Pelargonic Acid Market Estimates and Forecasts, by Country (2020-2032) (USD Million)
9.3.2.3 Western Europe Pelargonic Acid Market Estimates and Forecasts, By Grade (2020-2032) (USD Million)
9.3.2.4 Western Europe Pelargonic Acid Market Estimates and Forecasts, by Application (2020-2032) (USD Million)
9.3.2.5 Germany
9.3.2.5.1 Germany Pelargonic Acid Market Estimates and Forecasts, By Grade (2020-2032) (USD Million)
9.3.2.5.2 Germany Pelargonic Acid Market Estimates and Forecasts, by Application (2020-2032) (USD Million)
9.3.2.6 France
9.3.2.6.1 France Pelargonic Acid Market Estimates and Forecasts, By Grade (2020-2032) (USD Million)
9.3.2.6.2 France Pelargonic Acid Market Estimates and Forecasts, by Application (2020-2032) (USD Million)
9.3.2.7 UK
9.3.2.7.1 UK Pelargonic Acid Market Estimates and Forecasts, By Grade (2020-2032) (USD Million)
9.3.2.7.2 UK Pelargonic Acid Market Estimates and Forecasts, by Application (2020-2032) (USD Million)
9.3.2.8 Italy
9.3.2.8.1 Italy Pelargonic Acid Market Estimates and Forecasts, By Grade (2020-2032) (USD Million)
9.3.2.8.2 Italy Pelargonic Acid Market Estimates and Forecasts, by Application (2020-2032) (USD Million)
9.3.2.9 Spain
9.3.2.9.1 Spain Pelargonic Acid Market Estimates and Forecasts, By Grade (2020-2032) (USD Million)
9.3.2.9.2 Spain Pelargonic Acid Market Estimates and Forecasts, by Application (2020-2032) (USD Million)
9.3.2.10 Netherlands
9.3.2.10.1 Netherlands Pelargonic Acid Market Estimates and Forecasts, By Grade (2020-2032) (USD Million)
9.3.2.10.2 Netherlands Pelargonic Acid Market Estimates and Forecasts, by Application (2020-2032) (USD Million)
9.3.2.11 Switzerland
9.3.2.11.1 Switzerland Pelargonic Acid Market Estimates and Forecasts, By Grade (2020-2032) (USD Million)
9.3.2.11.2 Switzerland Pelargonic Acid Market Estimates and Forecasts, by Application (2020-2032) (USD Million)
9.3.2.12 Austria
9.3.2.12.1 Austria Pelargonic Acid Market Estimates and Forecasts, By Grade (2020-2032) (USD Million)
9.3.2.12.2 Austria Pelargonic Acid Market Estimates and Forecasts, by Application (2020-2032) (USD Million)
9.3.2.13 Rest of Western Europe
9.3.2.13.1 Rest of Western Europe Pelargonic Acid Market Estimates and Forecasts, By Grade (2020-2032) (USD Million)
9.3.2.13.2 Rest of Western Europe Pelargonic Acid Market Estimates and Forecasts, by Application (2020-2032) (USD Million)
9.4 Asia Pacific
9.4.1 Trends Analysis
9.4.2 Asia Pacific Pelargonic Acid Market Estimates and Forecasts, by Country (2020-2032) (USD Million)
9.4.3 Asia Pacific Pelargonic Acid Market Estimates and Forecasts, By Grade (2020-2032) (USD Million)
9.4.4 Asia Pacific Pelargonic Acid Market Estimates and Forecasts, by Application (2020-2032) (USD Million)
9.4.5 China
9.4.5.1 China Pelargonic Acid Market Estimates and Forecasts, By Grade (2020-2032) (USD Million)
9.4.5.2 China Pelargonic Acid Market Estimates and Forecasts, by Application (2020-2032) (USD Million)
9.4.6 India
9.4.5.1 India Pelargonic Acid Market Estimates and Forecasts, By Grade (2020-2032) (USD Million)
9.4.5.2 India Pelargonic Acid Market Estimates and Forecasts, by Application (2020-2032) (USD Million)
9.4.5 Japan
9.4.5.1 Japan Pelargonic Acid Market Estimates and Forecasts, By Grade (2020-2032) (USD Million)
9.4.5.2 Japan Pelargonic Acid Market Estimates and Forecasts, by Application (2020-2032) (USD Million)
9.4.6 South Korea
9.4.6.1 South Korea Pelargonic Acid Market Estimates and Forecasts, By Grade (2020-2032) (USD Million)
9.4.6.2 South Korea Pelargonic Acid Market Estimates and Forecasts, by Application (2020-2032) (USD Million)
9.4.7 Vietnam
9.4.7.1 Vietnam Pelargonic Acid Market Estimates and Forecasts, By Grade (2020-2032) (USD Million)
9.2.7.2 Vietnam Pelargonic Acid Market Estimates and Forecasts, by Application (2020-2032) (USD Million)
9.4.8 Singapore
9.4.8.1 Singapore Pelargonic Acid Market Estimates and Forecasts, By Grade (2020-2032) (USD Million)
9.4.8.2 Singapore Pelargonic Acid Market Estimates and Forecasts, by Application (2020-2032) (USD Million)
9.4.9 Australia
9.4.9.1 Australia Pelargonic Acid Market Estimates and Forecasts, By Grade (2020-2032) (USD Million)
9.4.9.2 Australia Pelargonic Acid Market Estimates and Forecasts, by Application (2020-2032) (USD Million)
9.4.10 Rest of Asia Pacific
9.4.10.1 Rest of Asia Pacific Pelargonic Acid Market Estimates and Forecasts, By Grade (2020-2032) (USD Million)
9.4.10.2 Rest of Asia Pacific Pelargonic Acid Market Estimates and Forecasts, by Application (2020-2032) (USD Million)
9.5 Middle East and Africa
9.5.1 Middle East
9.5.1.1 Trends Analysis
9.5.1.2 Middle East Pelargonic Acid Market Estimates and Forecasts, by Country (2020-2032) (USD Million)
9.5.1.3 Middle East Pelargonic Acid Market Estimates and Forecasts, By Grade (2020-2032) (USD Million)
9.5.1.4 Middle East Pelargonic Acid Market Estimates and Forecasts, by Application (2020-2032) (USD Million)
9.5.1.5 UAE
9.5.1.5.1 UAE Pelargonic Acid Market Estimates and Forecasts, By Grade (2020-2032) (USD Million)
9.5.1.5.2 UAE Pelargonic Acid Market Estimates and Forecasts, by Application (2020-2032) (USD Million)
9.5.1.6 Egypt
9.5.1.6.1 Egypt Pelargonic Acid Market Estimates and Forecasts, By Grade (2020-2032) (USD Million)
9.5.1.6.2 Egypt Pelargonic Acid Market Estimates and Forecasts, by Application (2020-2032) (USD Million)
9.5.1.7 Saudi Arabia
9.5.1.7.1 Saudi Arabia Pelargonic Acid Market Estimates and Forecasts, By Grade (2020-2032) (USD Million)
9.5.1.7.2 Saudi Arabia Pelargonic Acid Market Estimates and Forecasts, by Application (2020-2032) (USD Million)
9.5.1.8 Qatar
9.5.1.8.1 Qatar Pelargonic Acid Market Estimates and Forecasts, By Grade (2020-2032) (USD Million)
9.5.1.8.2 Qatar Pelargonic Acid Market Estimates and Forecasts, by Application (2020-2032) (USD Million)
9.5.1.9 Rest of Middle East
9.5.1.9.1 Rest of Middle East Pelargonic Acid Market Estimates and Forecasts, By Grade (2020-2032) (USD Million)
9.5.1.9.2 Rest of Middle East Pelargonic Acid Market Estimates and Forecasts, by Application (2020-2032) (USD Million)
9.5.2 Africa
9.5.2.1 Trends Analysis
9.5.2.2 Africa Pelargonic Acid Market Estimates and Forecasts, by Country (2020-2032) (USD Million)
9.5.2.3 Africa Pelargonic Acid Market Estimates and Forecasts, By Grade (2020-2032) (USD Million)
9.5.2.4 Africa Pelargonic Acid Market Estimates and Forecasts, by Application (2020-2032) (USD Million)
9.5.2.5 South Africa
9.5.2.5.1 South Africa Pelargonic Acid Market Estimates and Forecasts, By Grade (2020-2032) (USD Million)
9.5.2.5.2 South Africa Pelargonic Acid Market Estimates and Forecasts, by Application (2020-2032) (USD Million)
9.5.2.6 Nigeria
9.5.2.6.1 Nigeria Pelargonic Acid Market Estimates and Forecasts, By Grade (2020-2032) (USD Million)
9.5.2.6.2 Nigeria Pelargonic Acid Market Estimates and Forecasts, by Application (2020-2032) (USD Million)
9.6 Latin America
9.6.1 Trends Analysis
9.6.2 Latin America Pelargonic Acid Market Estimates and Forecasts, by Country (2020-2032) (USD Million)
9.6.3 Latin America Pelargonic Acid Market Estimates and Forecasts, By Grade (2020-2032) (USD Million)
9.6.4 Latin America Pelargonic Acid Market Estimates and Forecasts, by Application (2020-2032) (USD Million)
9.6.5 Brazil
9.6.5.1 Brazil Pelargonic Acid Market Estimates and Forecasts, By Grade (2020-2032) (USD Million)
9.6.5.2 Brazil Pelargonic Acid Market Estimates and Forecasts, by Application (2020-2032) (USD Million)
9.6.6 Argentina
9.6.6.1 Argentina Pelargonic Acid Market Estimates and Forecasts, By Grade (2020-2032) (USD Million)
9.6.6.2 Argentina Pelargonic Acid Market Estimates and Forecasts, by Application (2020-2032) (USD Million)
9.6.7 Colombia
9.6.7.1 Colombia Pelargonic Acid Market Estimates and Forecasts, By Grade (2020-2032) (USD Million)
9.6.7.2 Colombia Pelargonic Acid Market Estimates and Forecasts, by Application (2020-2032) (USD Million)
9.6.8 Rest of Latin America
9.6.8.1 Rest of Latin America Pelargonic Acid Market Estimates and Forecasts, By Grade (2020-2032) (USD Million)
9.6.8.2 Rest of Latin America Pelargonic Acid Market Estimates and Forecasts, by Application (2020-2032) (USD Million)
10. Company Profiles
10.1 Kunshan Odowell Co. Ltd
10.1.1 Company Overview
10.1.2 Financial
10.1.3 Product / Services Offered
10.1.4 SWOT Analysis
10.2 Central Drug House
10.2.1 Company Overview
10.2.2 Financial
10.2.3 Product/ Services Offered
10.2.4 SWOT Analysis
10.3 Croda International Plc.
10.3.1 Company Overview
10.3.2 Financial
10.3.3 Product/ Services Offered
10.3.4 SWOT Analysis
10.4 Glentham Life Sciences Limited
10.4.1 Company Overview
10.4.2 Financial
10.4.3 Product/ Services Offered
10.4.4 SWOT Analysis
10.5 Emery Oleochemicals
10.5.1 Company Overview
10.5.2 Financial
10.5.3 Product/ Services Offered
10.5.4 SWOT Analysis
10.6 Matrica S.p.A
10.6.1 Company Overview
10.6.2 Financial
10.6.3 Product/ Services Offered
10.6.4 SWOT Analysis
10.7 Haihang Industry
10.7.1 Company Overview
10.7.2 Financial
10.7.3 Product/ Services Offered
10.7.4 SWOT Analysis
10.8 Tokyo Chemical Industry Co. Ltd.
10.8.1 Company Overview
10.8.2 Financial
10.8.3 Product/ Services Offered
10.8.4 SWOT Analysis
10.9 Zhengzhou Yibang Industry & Commerce Co. Ltd.
10.9.1 Company Overview
10.9.2 Financial
10.9.3 Product/ Services Offered
10.9.4 SWOT Analysis
10.10 OQ Chemicals GmbH
10.10.1 Company Overview
10.10.2 Financial
10.10.3 Product/ Services Offered
10.10.4 SWOT Analysis
11. Use Cases and Best Practices
12. Conclusion
An accurate research report requires proper strategizing as well as implementation. There are multiple factors involved in the completion of good and accurate research report and selecting the best methodology to compete the research is the toughest part. Since the research reports we provide play a crucial role in any company’s decision-making process, therefore we at SNS Insider always believe that we should choose the best method which gives us results closer to reality. This allows us to reach at a stage wherein we can provide our clients best and accurate investment to output ratio.
Each report that we prepare takes a timeframe of 350-400 business hours for production. Starting from the selection of titles through a couple of in-depth brain storming session to the final QC process before uploading our titles on our website we dedicate around 350 working hours. The titles are selected based on their current market cap and the foreseen CAGR and growth.
The 5 steps process:
Step 1: Secondary Research:
Secondary Research or Desk Research is as the name suggests is a research process wherein, we collect data through the readily available information. In this process we use various paid and unpaid databases which our team has access to and gather data through the same. This includes examining of listed companies’ annual reports, Journals, SEC filling etc. Apart from this our team has access to various associations across the globe across different industries. Lastly, we have exchange relationships with various university as well as individual libraries.

Step 2: Primary Research
When we talk about primary research, it is a type of study in which the researchers collect relevant data samples directly, rather than relying on previously collected data. This type of research is focused on gaining content specific facts that can be sued to solve specific problems. Since the collected data is fresh and first hand therefore it makes the study more accurate and genuine.
We at SNS Insider have divided Primary Research into 2 parts.
Part 1 wherein we interview the KOLs of major players as well as the upcoming ones across various geographic regions. This allows us to have their view over the market scenario and acts as an important tool to come closer to the accurate market numbers. As many as 45 paid and unpaid primary interviews are taken from both the demand and supply side of the industry to make sure we land at an accurate judgement and analysis of the market.
This step involves the triangulation of data wherein our team analyses the interview transcripts, online survey responses and observation of on filed participants. The below mentioned chart should give a better understanding of the part 1 of the primary interview.

Part 2: In this part of primary research the data collected via secondary research and the part 1 of the primary research is validated with the interviews from individual consultants and subject matter experts.
Consultants are those set of people who have at least 12 years of experience and expertise within the industry whereas Subject Matter Experts are those with at least 15 years of experience behind their back within the same space. The data with the help of two main processes i.e., FGDs (Focused Group Discussions) and IDs (Individual Discussions). This gives us a 3rd party nonbiased primary view of the market scenario making it a more dependable one while collation of the data pointers.
Step 3: Data Bank Validation
Once all the information is collected via primary and secondary sources, we run that information for data validation. At our intelligence centre our research heads track a lot of information related to the market which includes the quarterly reports, the daily stock prices, and other relevant information. Our data bank server gets updated every fortnight and that is how the information which we collected using our primary and secondary information is revalidated in real time.

Step 4: QA/QC Process
After all the data collection and validation our team does a final level of quality check and quality assurance to get rid of any unwanted or undesired mistakes. This might include but not limited to getting rid of the any typos, duplication of numbers or missing of any important information. The people involved in this process include technical content writers, research heads and graphics people. Once this process is completed the title gets uploader on our platform for our clients to read it.
Step 5: Final QC/QA Process:
This is the last process and comes when the client has ordered the study. In this process a final QA/QC is done before the study is emailed to the client. Since we believe in giving our clients a good experience of our research studies, therefore, to make sure that we do not lack at our end in any way humanly possible we do a final round of quality check and then dispatch the study to the client.
Key Segments
By Grade
Synthetic Grade
Natural Grade
By Application
Detergents
Personal Care & Cosmetics
Lacquer & Coatings
Lubricants
Food Additives
Herbicide
Others
Request for Segment Customization as per your Business Requirement: Segment Customization Request
Regional Coverage:
North America
US
Canada
Mexico
Europe
Eastern Europe
Poland
Romania
Hungary
Turkey
Rest of Eastern Europe
Western Europe
Germany
France
UK
Italy
Spain
Netherlands
Switzerland
Austria
Rest of Western Europe
Asia Pacific
China
India
Japan
South Korea
Vietnam
Singapore
Australia
Rest of Asia Pacific
Middle East & Africa
Middle East
UAE
Egypt
Saudi Arabia
Qatar
Rest of Middle East
Africa
Nigeria
South Africa
Rest of Africa
Latin America
Brazil
Argentina
Colombia
Rest of Latin America
Request for Country Level Research Report: Country Level Customization Request
Available Customization
With the given market data, SNS Insider offers customization as per the company’s specific needs. The following customization options are available for the report:
Product Analysis
Criss-Cross segment analysis (e.g. Product X Application)
Product Matrix which gives a detailed comparison of the product portfolio of each company
Geographic Analysis
Additional countries in any of the regions
Company Information
Detailed analysis and profiling of additional market players (Up to five)
Explore the Oleyl Alcohol Market, focusing on its use in cosmetics, personal care, and industrial applications. Learn about trends in sustainable sourcing, bio-based alcohols, and the growing demand for oleyl alcohol in emollients, surfactants, and lubric
The Rheology Modifiers Market size was USD 8.40 billion in 2023 and is expected to reach USD 11.99 billion by 2032 and grow at a CAGR of 4.04% over the forecast period of 2024-2032.
The Engineered Plastics Market Size was valued at USD 114.80 billion in 2023 and is expected to reach USD 190.68 billion by 2032 and grow at a CAGR of 5.80% over the forecast period 2024-2032.
The Chemical as a Service Market Size was valued at USD 9.07 billion in 2023 and will reach $13.50 billion by 2032 and grow at a CAGR of 7.96% by 2024-2032
Polypropylene Market size was USD 85.40 Billion in 2023 and is expected to reach USD 139.15 Billion by 2032, growing at a CAGR of 5.57% from 2024 to 2032.
The PET Foam Market Size was valued at USD 411.0 million in 2023, and is expected to reach USD 819.3 million by 2032, and grow at a CAGR of 7.14% over the forecast period 2024-2032.

Hi! Click one of our member below to chat on Phone
© 2025 All Rights Reserved by SNS Insider Pvt Ltd


