image

PCIe Switches Market Size & Overview:

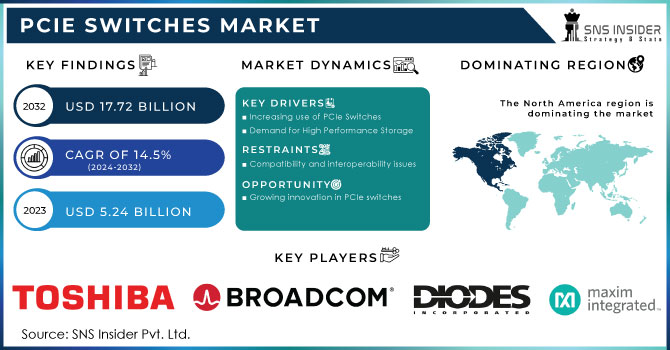
The PCIe Switches Market was valued at USD 1.78 billion in 2023 and is expected to reach USD 4.80 billion by 2032, growing at a CAGR of 11.70% over the forecast period 2024-2032. The PCIe Switches market is propelled by rising adoption in data centers, automotive and industrial applications, and growing deployment in artificial intelligence, cloud computing, and high-performance computing. On the technology front, ever-growing PCIe Gen4 and Gen5 functions help in all categories of bandwidth, latency, and scale giving rise to lower latency in working with a huge amount of data. The production of semiconductors influences supply chain dynamics, with availability fluctuations affecting the deployment timeline. Expected growth is coupled with increasing demand from applications including autonomous vehicles, 5G, and IoT, as PCIe switches become indispensable for seamless connectivity for high bandwidth processing across numerous end-user-specific applications spanning AI workloads to real-time industrial automation.

PCIe Switches Market Revenue Analysis

Get more information on PCIe Switches Market - Request Sample Report

Market Dynamics

Key Drivers: 

  • Rising Demand for PCIe Switches Driven by AI Cloud Computing Data Centers and Automotive Innovations

PCIe Switches are key components that facilitate data exchange between devices within a PCIe network. The PCIe Switches are being driven within high-performance computing applications due to the larger demand for large-scale data processing and faster interconnection in the data centers. In addition, the quick adoption of cloud computing, AI, and ML technologies is also driving demand for more high-end interconnects, such as PCIe. In automotive, the increase in electric vehicle (EVs) power supply and the development of autonomous driving technology that needs to process/communicate large data amounts among sensors is pushing the need for advanced PCIe Switches.

Restrain: 

  • Challenges in PCIe Switches Market Due to Backward Compatibility Complexity and Performance Bottlenecks in Applications

The PCIe Switches market finds one of the major restraining factors in the complexity and backward compatibility limitations. In the Gen3 to Gen4 market environment, legacy devices will have difficulties migrating to the latest standards because their programmable interconnect is based on older generations (e.g., Gen1 or Gen2). This gap in compatibility hinders the applications of newer PCIe standards in industries. Moreover, although PCIe Switches can transfer data very quickly, the performance may drop significantly when the number of devices connected increases, leading to bottlenecks in mega applications.

Opportunity:

  • Automotive Sector and 5G Drive Growth Opportunities for PCIe Switches in EVs IoT and Automation

The growing automotive sector is a big opportunity in the PCIe Switches market, especially with the transition towards electric vehicles (EVs) as well as increasing vehicle system complexity. Supporting high bandwidth applications such as ADAS, infotainment, and autonomous vehicle technologies which will become mainstream, PCIe Switches enable designers to architect more flexible, modular, and integrated solutions. Expect 5G to add even more opportunities with communication infrastructure, where high-speed, low-latency transfer of data is critical. PCIe Switches are witnessing high adoption on the back of massive investments in industrial automation, IoT, and smart manufacturing, opening new growth horizons for companies.

Challenges:

  • Challenges in PCIe Switches Market Include System Integration Performance Power Balance and Ongoing Architecture Innovation

Another big problem is how PCIe Switches fit within heterogeneous infrastructure systems. As interconnectivity plays a pivotal role between PCIe technologies concerning systems, the complexities of interconnected devices, mostly in applications such as data centers and industrial end-machines, make tools and methodologies critical in designing connected systems exploiting complete PCIe Switch capabilities. Another constant challenge involves balancing performance, power consumption, and system stability. In addition, with the increasing demand for more advanced features that is, higher bandwidth and speed PCIe switch architecture innovation is an ongoing requirement that may need further specialized knowledge and lengthy design cycles. This can potentially slow down the speed of adoption in specific markets.

Segment Analysis

By Type

Gen3 dominated with 56.5% of the market share in 2023 and is expected to continue to grow with the fastest CAGR between 2024 and 2032. The dominance is due to the growing need for high-speed data transfer and low-latency communication in general in various industries such as data centers, automotive, and healthcare. PCIe Gen3 has come a long way from its predecessor and is capable of handling higher data throughput for advanced applications such as cloud computing, artificial intelligence, and high-performance computing. The Gen3 segment is also growing because of the rapid growth of cloud infrastructure, 5G networks, and autonomous vehicles. Gen3 has a substantial growth opportunity ahead, particularly driven by the need for speed and efficiency in data processing as the automotive sector moves to Electric Vehicles (EVs) and autonomous solutions. These technologies will continue to grow well into the future, creating higher-performance interconnects such as PCIe Gen3 which will likely be the fastest-growing segment of the overall market in the years ahead.

By Application

Data Center held the largest market share of 59.6% in 2023 and is anticipated to witness the fastest CAGR from 2024 to 2032. This growth is mainly driven by increasing demands for cloud computing, data storage, and high-performance computing. With more businesses and industries leaning towards data-driven solutions, data centers are emerging as core processing and information storage areas that deal with large volumes of data. The high throughput of data needs high-speed interconnects where PCIe Switches play a significant role in providing maximum performance and scalability. Increasing artificial intelligence (AI) and machine learning along with the implementation of 5G also drives the necessity of next-generation data center equipment. PCIe Gen3 switches PCIe Gen3 switches offer efficient, high-bandwidth data transfer solutions needed by these technologies. Furthermore, the implementation of the edge computing scenario and the increased need for low-latency data processing are other reasons driving the PCIe Switches market in data centers with the fastest growing segment.

By Industry

Chemical & Petrochemical had the largest share of the market 24.7% in 2023, due to the high demand for high-performance computing and data transfer in process control, monitoring, and automation systems within this sector. Real-time monitoring of industrial chemical processes and petrochemical production depends upon effective, robust data communication for analytical measurements. PCIe Switches help support efficient data handling as well as integration of advanced technologies such as IoT and machine learning which play an increasingly important role in the industry to optimize operations and effectively reduce downtime, therefore improving productivity in this sector. As the chemical and petrochemical industry has a considerable market share, PCIe Switches will still be in demand, particularly in energy-oriented regions that have put infrastructure development at the forefront.

The automotive sector will exhibit the highest CAGR from 2024-2032, owing to the rising need for advanced data processing and connectivity solutions used in electric vehicles (EVs) and autonomous driving technologies. Point-to-point PCIe Switches also facilitate traditional PCIe use by managing the dispersed systems characterizing modern vehicles, such as advanced driver assistance systems (ADAS), infotainment systems, and real-time sensor data processing. The proliferation of electric and autonomous vehicles will result in an increasing demand for high-speed low-latency data communication which will drive the need for PCIe Switches in the automotive sector. The digitalization of the automotive industry, which continues unabated, is another catalyst for this growth opportunity.
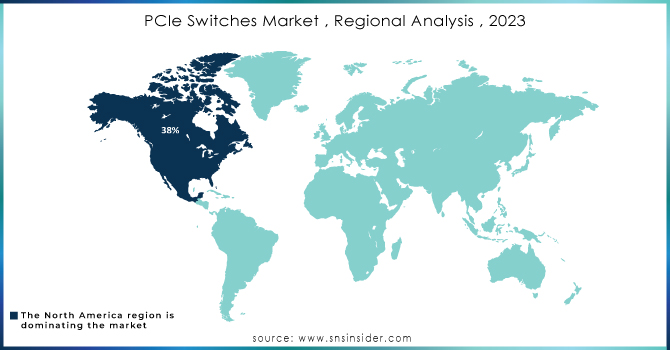
Regional Analysis

The market was led by North America, with a 35.1% share, in 2023, as a result of the growing requirement for the development of data centers, high-performance computing systems, and automotive applications. Countries with larger data centers, like those owned by Google, Amazon, and Microsoft, which want high-speed, low-latency interconnects such as PCIe Switches to support their operations, are in the U.S. Tesla and General Motors are bringing electric and autonomous vehicles to market, and both will present significant challenges that the industry will rely on PCIe Switches to meet — massive volumes of sensor data and high data rates that need to be processed almost in real-time. Continuous technological breakthroughs and infrastructure development in North America remain a driving factor in keeping this market at the top globally.

Asia Pacific is anticipated to grow at the fastest CAGR throughout the anticipated time frame 2024 to 2032, owing to an upsurge in the penetration of 5G, AI, and IoT technology coupled with the growing automotive and manufacturing industry in the region. China and Japan are two of the largest automotive hubs, but companies such as BYD and Toyota, which both have a focus on electric vehicle development, need advanced data communication. Also, there are a considerable number of semiconductor manufacturers in the Asia Pacific, such as TSMC, for the production of advanced chips that power the PCIe Switches. Technological Developments & Investments in Infrastructure in the Asia Pacific Region to Boost Growth of PCIe Switches Market.

PCIe-Switches-Market--Regional-Analysis--2023

Get Customized Report as per your Business Requirement - Request For Customized Report

Key players

Some of the major players in the PCIe Switches Market are:

  • Broadcom (Broadcom PEX88000, Broadcom PEX9700 Series)

  • Intel (Intel Ethernet 800 Series, Intel FPGA PCIe Switch)

  • Microchip Technology (Microchip PCIe Switch, Microchip 8-Port PCIe Switch)

  • NXP Semiconductors (NXP PCIe Switch, NXP Switch Matrix)

  • Qualcomm (Qualcomm QCA6390, Qualcomm 6600 PCIe Switch)

  • Mellanox Technologies (now part of NVIDIA) (Mellanox PCIe Switch, ConnectX-6)

  • IDT (Integrated Device Technology, now part of Renesas) (IDT PCIe Switch, IDT 9DBL100)

  • Xilinx (now part of AMD) (Xilinx Versal, Xilinx Alveo PCIe Switch)

  • Texas Instruments (Texas Instruments TSW1400, PCIe-based switch solutions)

  • Pericom Semiconductor (now part of Diodes Incorporated) (Pericom PCIe Switch, Pericom PI7C9X)

  • Analog Devices (Analog Devices ADM1166, Analog Devices ADP1048)

  • Keysight Technologies (Keysight PCIe Test Solutions, Keysight PathWave)

  • Inphi Corporation (now part of Marvell Technology) (Inphi PCIe Switch, Inphi 400G PCIe)

  • ASMedia Technology (ASMedia ASM1061, ASMedia ASM1480)

  • Vitesse Semiconductor (now part of Microsemi) (Vitesse PCIe Switch, Vitesse 10G/25G Switch)

Recent Trends

  • In March 2024, Broadcom launched the industry's first 5nm PCIe Gen5/Gen6 retimers, enhancing AI workload scalability with extended reach and lower power consumption.

  • In January 2025, Microchip Technology introduced the Switchtec PCIe Gen 4.0 16-lane switches, enhancing data transfer for automotive and embedded computing. The PCI100x family offers scalable, high-performance connectivity for AI, data centers, and advanced computing applications.

PCIe Switches Market Report Scope:

Report Attributes Details
Market Size in 2023 USD 1.78 Billion
Market Size by 2032 USD 4.80 Billion
CAGR CAGR of 11.70% From 2024 to 2032
Base Year 2023
Forecast Period 2024-2032
Historical Data 2020-2022
Report Scope & Coverage Market Size, Segments Analysis, Competitive  Landscape, Regional Analysis, DROC & SWOT Analysis, Forecast Outlook
Key Segments • By Type (Gen1, Gen2, Gen3)
• By Application (Data Center, Communication Industry, Industrial Application, Others)
• By Industry (Chemical & Petrochemical, Oil & Gas, Energy & Power, Automotive, Food & Beverages, Healthcare, Others)
Regional Analysis/Coverage North America (US, Canada, Mexico), Europe (Eastern Europe [Poland, Romania, Hungary, Turkey, Rest of Eastern Europe] Western Europe] Germany, France, UK, Italy, Spain, Netherlands, Switzerland, Austria, Rest of Western Europe]), Asia Pacific (China, India, Japan, South Korea, Vietnam, Singapore, Australia, Rest of Asia Pacific), Middle East & Africa (Middle East [UAE, Egypt, Saudi Arabia, Qatar, Rest of Middle East], Africa [Nigeria, South Africa, Rest of Africa], Latin America (Brazil, Argentina, Colombia, Rest of Latin America)
Company Profiles Broadcom, Intel, Microchip Technology, NXP Semiconductors, Qualcomm, Mellanox Technologies (now part of NVIDIA), IDT (now part of Renesas), Xilinx (now part of AMD), Texas Instruments, Pericom Semiconductor (now part of Diodes Incorporated), Analog Devices, Keysight Technologies, Inphi Corporation (now part of Marvell Technology), ASMedia Technology, Vitesse Semiconductor (now part of Microsemi)

Frequently Asked Questions

Ans: The PCIe Switches Market is expected to grow at a CAGR of 11.70% during 2024-2032.

Ans: PCIe Switches Market size was USD 1.78 billion in 2023 and is expected to Reach USD 4.80 billion by 2032.

Ans: The major growth factor of the PCIe Switches market is the rising demand for high-speed, low-latency data transfer in AI, cloud computing, data centers, and automotive applications.

Ans: The Chemical & Petrochemical segment dominated the PCIe Switches Market in 2023.

Ans: North America dominated the PCIe Switches Market in 2023.

Table of Content

1. Introduction

1.1 Market Definition

1.2 Scope (Inclusion and Exclusions)

1.3 Research Assumptions

2. Executive Summary

2.1 Market Overview

2.2 Regional Synopsis

2.3 Competitive Summary

3. Research Methodology

3.1 Top-Down Approach

3.2 Bottom-up Approach

3.3. Data Validation

3.4 Primary Interviews

4. Market Dynamics Impact Analysis

4.1 Market Driving Factors Analysis

4.1.1 Drivers

4.1.2 Restraints

4.1.3 Opportunities

4.1.4 Challenges

4.2 PESTLE Analysis

4.3 Porter’s Five Forces Model

5. Statistical Insights and Trends Reporting

5.1 Adoption & Deployment Metrics

5.2 Performance & Technical Metrics

      5.3 Demand & Supply Chain Metrics

6. Competitive Landscape

6.1 List of Major Companies, By Region

6.2 Market Share Analysis, By Region

6.3 Product Benchmarking

6.3.1 Product specifications and features

6.3.2 Pricing

6.4 Strategic Initiatives

6.4.1 Marketing and promotional activities

6.4.2 Distribution and Supply Chain Strategies

6.4.3 Expansion plans and new product launches

6.4.4 Strategic partnerships and collaborations

6.5 Technological Advancements

6.6 Market Positioning and Branding

7. PCIe Switches Market Segmentation, By Type

7.1 Chapter Overview

7.2 Gen1

7.2.1 Gen1 Market Trends Analysis (2020-2032)

7.2.2 Gen1 Market Size Estimates and Forecasts to 2032 (USD Billion)

7.3 Gen2

7.3.1 Gen2 Market Trends Analysis (2020-2032)

7.3.2 Gen2 Market Size Estimates and Forecasts to 2032 (USD Billion)

7.4 Gen3

7.4.1 Gen3 Market Trends Analysis (2020-2032)

7.4.2 Gen3 Market Size Estimates and Forecasts to 2032 (USD Billion)

8. PCIe Switches Market Segmentation, By Application

8.1 Chapter Overview

8.2 Data Center

8.2.1 Data Center Market Trends Analysis (2020-2032)

8.2.2 Data Center Market Size Estimates and Forecasts to 2032 (USD Billion)

8.3 Communication Industry

8.3.1 Communication Industry Market Trends Analysis (2020-2032)

8.3.2 Communication Industry Market Size Estimates and Forecasts to 2032 (USD Billion)

8.4 Industrial Application

8.4.1 Industrial Application Market Trends Analysis (2020-2032)

8.4.2 Industrial Application Market Size Estimates and Forecasts to 2032 (USD Billion)

8.5 Others

8.5.1 Others Market Trends Analysis (2020-2032)

8.5.2 Others Market Size Estimates and Forecasts to 2032 (USD Billion)

9. PCIe Switches Market Segmentation, By Industry

9.1 Chapter Overview

9.2 Chemical & Petrochemical

9.2.1 Chemical & Petrochemical Market Trends Analysis (2020-2032)

9.2.2 Chemical & Petrochemical Market Size Estimates and Forecasts to 2032 (USD Billion)

9.3 Oil & Gas

              9.3.1 Oil & Gas Market Trends Analysis (2020-2032)

9.3.2 Oil & Gas Market Size Estimates and Forecasts to 2032 (USD Billion)

9.4 Energy & Power

              9.4.1 Energy & Power Market Trends Analysis (2020-2032)

9.4.2 Energy & Power Market Size Estimates and Forecasts to 2032 (USD Billion)

9.5 Automotive

              9.5.1 Automotive Market Trends Analysis (2020-2032)

9.5.2 Automotive Market Size Estimates and Forecasts to 2032 (USD Billion)

9.6 Food & Beverages

              9.6.1 Food & Beverages Market Trends Analysis (2020-2032)

9.6.2 Food & Beverages Market Size Estimates and Forecasts to 2032 (USD Billion)

9.7 Healthcare

              9.7.1 Healthcare Market Trends Analysis (2020-2032)

9.7.2 Healthcare Market Size Estimates and Forecasts to 2032 (USD Billion)

9.8 Others

              9.8.1 Others Market Trends Analysis (2020-2032)

9.8.2 Others Market Size Estimates and Forecasts to 2032 (USD Billion)

10. Regional Analysis

10.1 Chapter Overview

10.2 North America

10.2.1 Trends Analysis

10.2.2 North America PCIe Switches Market Estimates and Forecasts, by Country (2020-2032) (USD Billion)

10.2.3 North America PCIe Switches Market Estimates and Forecasts, By Type (2020-2032) (USD Billion) 

10.2.4 North America PCIe Switches Market Estimates and Forecasts, By Application (2020-2032) (USD Billion)

10.2.5 North America PCIe Switches Market Estimates and Forecasts, By Industry (2020-2032) (USD Billion)

10.2.6 USA

10.2.6.1 USA PCIe Switches Market Estimates and Forecasts, By Type (2020-2032) (USD Billion)

10.2.6.2 USA PCIe Switches Market Estimates and Forecasts, By Application (2020-2032) (USD Billion)

10.2.6.3 USA PCIe Switches Market Estimates and Forecasts, By Industry (2020-2032) (USD Billion)

10.2.7 Canada

10.2.7.1 Canada PCIe Switches Market Estimates and Forecasts, By Type (2020-2032) (USD Billion)

10.2.7.2 Canada PCIe Switches Market Estimates and Forecasts, By Application (2020-2032) (USD Billion)

10.2.7.3 Canada PCIe Switches Market Estimates and Forecasts, By Industry (2020-2032) (USD Billion)

10.2.8 Mexico

10.2.8.1 Mexico PCIe Switches Market Estimates and Forecasts, By Type (2020-2032) (USD Billion)

10.2.8.2 Mexico PCIe Switches Market Estimates and Forecasts, By Application (2020-2032) (USD Billion)

10.2.8.3 Mexico PCIe Switches Market Estimates and Forecasts, By Industry (2020-2032) (USD Billion)

10.3 Europe

10.3.1 Eastern Europe

10.3.1.1 Trends Analysis

10.3.1.2 Eastern Europe PCIe Switches Market Estimates and Forecasts, by Country (2020-2032) (USD Billion)

10.3.1.3 Eastern Europe PCIe Switches Market Estimates and Forecasts, By Type (2020-2032) (USD Billion) 

10.3.1.4 Eastern Europe PCIe Switches Market Estimates and Forecasts, By Application (2020-2032) (USD Billion)

10.3.1.5 Eastern Europe PCIe Switches Market Estimates and Forecasts, By Industry (2020-2032) (USD Billion)

10.3.1.6 Poland

10.3.1.6.1 Poland PCIe Switches Market Estimates and Forecasts, By Type (2020-2032) (USD Billion)

10.3.1.6.2 Poland PCIe Switches Market Estimates and Forecasts, By Application (2020-2032) (USD Billion)

10.3.1.6.3 Poland PCIe Switches Market Estimates and Forecasts, By Industry (2020-2032) (USD Billion)

10.3.1.7 Romania

10.3.1.7.1 Romania PCIe Switches Market Estimates and Forecasts, By Type (2020-2032) (USD Billion)

10.3.1.7.2 Romania PCIe Switches Market Estimates and Forecasts, By Application (2020-2032) (USD Billion)

10.3.1.7.3 Romania PCIe Switches Market Estimates and Forecasts, By Industry (2020-2032) (USD Billion)

10.3.1.8 Hungary

10.3.1.8.1 Hungary PCIe Switches Market Estimates and Forecasts, By Type (2020-2032) (USD Billion)

10.3.1.8.2 Hungary PCIe Switches Market Estimates and Forecasts, By Application (2020-2032) (USD Billion)

10.3.1.8.3 Hungary PCIe Switches Market Estimates and Forecasts, By Industry (2020-2032) (USD Billion)

10.3.1.9 Turkey

10.3.1.9.1 Turkey PCIe Switches Market Estimates and Forecasts, By Type (2020-2032) (USD Billion)

10.3.1.9.2 Turkey PCIe Switches Market Estimates and Forecasts, By Application (2020-2032) (USD Billion)

10.3.1.9.3 Turkey PCIe Switches Market Estimates and Forecasts, By Industry (2020-2032) (USD Billion)

10.3.1.10 Rest of Eastern Europe

10.3.1.10.1 Rest of Eastern Europe PCIe Switches Market Estimates and Forecasts, By Type (2020-2032) (USD Billion)

10.3.1.10.2 Rest of Eastern Europe PCIe Switches Market Estimates and Forecasts, By Application (2020-2032) (USD Billion)

10.3.1.10.3 Rest of Eastern Europe PCIe Switches Market Estimates and Forecasts, By Industry (2020-2032) (USD Billion)

10.3.2 Western Europe

10.3.2.1 Trends Analysis

10.3.2.2 Western Europe PCIe Switches Market Estimates and Forecasts, by Country (2020-2032) (USD Billion)

10.3.2.3 Western Europe PCIe Switches Market Estimates and Forecasts, By Type (2020-2032) (USD Billion) 

10.3.2.4 Western Europe PCIe Switches Market Estimates and Forecasts, By Application (2020-2032) (USD Billion)

10.3.2.5 Western Europe PCIe Switches Market Estimates and Forecasts, By Industry (2020-2032) (USD Billion)

10.3.2.6 Germany

10.3.2.6.1 Germany PCIe Switches Market Estimates and Forecasts, By Type (2020-2032) (USD Billion)

10.3.2.6.2 Germany PCIe Switches Market Estimates and Forecasts, By Application (2020-2032) (USD Billion)

10.3.2.6.3 Germany PCIe Switches Market Estimates and Forecasts, By Industry (2020-2032) (USD Billion)

10.3.2.7 France

10.3.2.7.1 France PCIe Switches Market Estimates and Forecasts, By Type (2020-2032) (USD Billion)

10.3.2.7.2 France PCIe Switches Market Estimates and Forecasts, By Application (2020-2032) (USD Billion)

10.3.2.7.3 France PCIe Switches Market Estimates and Forecasts, By Industry (2020-2032) (USD Billion)

10.3.2.8 UK

10.3.2.8.1 UK PCIe Switches Market Estimates and Forecasts, By Type (2020-2032) (USD Billion)

10.3.2.8.2 UK PCIe Switches Market Estimates and Forecasts, By Application (2020-2032) (USD Billion)

10.3.2.8.3 UK PCIe Switches Market Estimates and Forecasts, By Industry (2020-2032) (USD Billion)

10.3.2.9 Italy

10.3.2.9.1 Italy PCIe Switches Market Estimates and Forecasts, By Type (2020-2032) (USD Billion)

10.3.2.9.2 Italy PCIe Switches Market Estimates and Forecasts, By Application (2020-2032) (USD Billion)

10.3.2.9.3 Italy PCIe Switches Market Estimates and Forecasts, By Industry (2020-2032) (USD Billion)

10.3.2.10 Spain

10.3.2.10.1 Spain PCIe Switches Market Estimates and Forecasts, By Type (2020-2032) (USD Billion)

10.3.2.10.2 Spain PCIe Switches Market Estimates and Forecasts, By Application (2020-2032) (USD Billion)

10.3.2.10.3 Spain PCIe Switches Market Estimates and Forecasts, By Industry (2020-2032) (USD Billion)

10.3.2.11 Netherlands

10.3.2.11.1 Netherlands PCIe Switches Market Estimates and Forecasts, By Type (2020-2032) (USD Billion)

10.3.2.11.2 Netherlands PCIe Switches Market Estimates and Forecasts, By Application (2020-2032) (USD Billion)

10.3.2.11.3 Netherlands PCIe Switches Market Estimates and Forecasts, By Industry (2020-2032) (USD Billion)

10.3.2.12 Switzerland

10.3.2.12.1 Switzerland PCIe Switches Market Estimates and Forecasts, By Type (2020-2032) (USD Billion)

10.3.2.12.2 Switzerland PCIe Switches Market Estimates and Forecasts, By Application (2020-2032) (USD Billion)

10.3.2.12.3 Switzerland PCIe Switches Market Estimates and Forecasts, By Industry (2020-2032) (USD Billion)

10.3.2.13 Austria

10.3.2.13.1 Austria PCIe Switches Market Estimates and Forecasts, By Type (2020-2032) (USD Billion)

10.3.2.13.2 Austria PCIe Switches Market Estimates and Forecasts, By Application (2020-2032) (USD Billion)

10.3.2.13.3 Austria PCIe Switches Market Estimates and Forecasts, By Industry (2020-2032) (USD Billion)

10.3.2.14 Rest of Western Europe

10.3.2.14.1 Rest of Western Europe PCIe Switches Market Estimates and Forecasts, By Type (2020-2032) (USD Billion)

10.3.2.14.2 Rest of Western Europe PCIe Switches Market Estimates and Forecasts, By Application (2020-2032) (USD Billion)

10.3.2.14.3 Rest of Western Europe PCIe Switches Market Estimates and Forecasts, By Industry (2020-2032) (USD Billion)

10.4 Asia Pacific

10.4.1 Trends Analysis

10.4.2 Asia Pacific PCIe Switches Market Estimates and Forecasts, by Country (2020-2032) (USD Billion)

10.4.3 Asia Pacific PCIe Switches Market Estimates and Forecasts, By Type (2020-2032) (USD Billion) 

10.4.4 Asia Pacific PCIe Switches Market Estimates and Forecasts, By Application (2020-2032) (USD Billion)

10.4.5 Asia Pacific PCIe Switches Market Estimates and Forecasts, By Industry (2020-2032) (USD Billion)

10.4.6 China

10.4.6.1 China PCIe Switches Market Estimates and Forecasts, By Type (2020-2032) (USD Billion)

10.4.6.2 China PCIe Switches Market Estimates and Forecasts, By Application (2020-2032) (USD Billion)

10.4.6.3 China PCIe Switches Market Estimates and Forecasts, By Industry (2020-2032) (USD Billion)

10.4.7 India

10.4.7.1 India PCIe Switches Market Estimates and Forecasts, By Type (2020-2032) (USD Billion)

10.4.7.2 India PCIe Switches Market Estimates and Forecasts, By Application (2020-2032) (USD Billion)

10.4.7.3 India PCIe Switches Market Estimates and Forecasts, By Industry (2020-2032) (USD Billion)

10.4.8 Japan

10.4.8.1 Japan PCIe Switches Market Estimates and Forecasts, By Type (2020-2032) (USD Billion)

10.4.8.2 Japan PCIe Switches Market Estimates and Forecasts, By Application (2020-2032) (USD Billion)

10.4.8.3 Japan PCIe Switches Market Estimates and Forecasts, By Industry (2020-2032) (USD Billion)

10.4.9 South Korea

10.4.9.1 South Korea PCIe Switches Market Estimates and Forecasts, By Type (2020-2032) (USD Billion)

10.4.9.2 South Korea PCIe Switches Market Estimates and Forecasts, By Application (2020-2032) (USD Billion)

10.4.9.3 South Korea PCIe Switches Market Estimates and Forecasts, By Industry (2020-2032) (USD Billion)

10.4.10 Vietnam

10.4.10.1 Vietnam PCIe Switches Market Estimates and Forecasts, By Type (2020-2032) (USD Billion)

10.4.10.2 Vietnam PCIe Switches Market Estimates and Forecasts, By Application (2020-2032) (USD Billion)

10.4.10.3 Vietnam PCIe Switches Market Estimates and Forecasts, By Industry (2020-2032) (USD Billion)

10.4.11 Singapore

10.4.11.1 Singapore PCIe Switches Market Estimates and Forecasts, By Type (2020-2032) (USD Billion)

10.4.11.2 Singapore PCIe Switches Market Estimates and Forecasts, By Application (2020-2032) (USD Billion)

10.4.11.3 Singapore PCIe Switches Market Estimates and Forecasts, By Industry (2020-2032) (USD Billion)

10.4.12 Australia

10.4.12.1 Australia PCIe Switches Market Estimates and Forecasts, By Type (2020-2032) (USD Billion)

10.4.12.2 Australia PCIe Switches Market Estimates and Forecasts, By Application (2020-2032) (USD Billion)

10.4.12.3 Australia PCIe Switches Market Estimates and Forecasts, By Industry (2020-2032) (USD Billion)

10.4.13 Rest of Asia Pacific

10.4.13.1 Rest of Asia Pacific PCIe Switches Market Estimates and Forecasts, By Type (2020-2032) (USD Billion)

10.4.13.2 Rest of Asia Pacific PCIe Switches Market Estimates and Forecasts, By Application (2020-2032) (USD Billion)

10.4.13.3 Rest of Asia Pacific PCIe Switches Market Estimates and Forecasts, By Industry (2020-2032) (USD Billion)

10.5 Middle East and Africa

10.5.1 Middle East

10.5.1.1 Trends Analysis

10.5.1.2 Middle East PCIe Switches Market Estimates and Forecasts, by Country (2020-2032) (USD Billion)

10.5.1.3 Middle East PCIe Switches Market Estimates and Forecasts, By Type (2020-2032) (USD Billion) 

10.5.1.4 Middle East PCIe Switches Market Estimates and Forecasts, By Application (2020-2032) (USD Billion)

10.5.1.5 Middle East PCIe Switches Market Estimates and Forecasts, By Industry (2020-2032) (USD Billion)

10.5.1.6 UAE

10.5.1.6.1 UAE PCIe Switches Market Estimates and Forecasts, By Type (2020-2032) (USD Billion)

10.5.1.6.2 UAE PCIe Switches Market Estimates and Forecasts, By Application (2020-2032) (USD Billion)

10.5.1.6.3 UAE PCIe Switches Market Estimates and Forecasts, By Industry (2020-2032) (USD Billion)

10.5.1.7 Egypt

10.5.1.7.1 Egypt PCIe Switches Market Estimates and Forecasts, By Type (2020-2032) (USD Billion)

10.5.1.7.2 Egypt PCIe Switches Market Estimates and Forecasts, By Application (2020-2032) (USD Billion)

10.5.1.7.3 Egypt PCIe Switches Market Estimates and Forecasts, By Industry (2020-2032) (USD Billion)

10.5.1.8 Saudi Arabia

10.5.1.8.1 Saudi Arabia PCIe Switches Market Estimates and Forecasts, By Type (2020-2032) (USD Billion)

10.5.1.8.2 Saudi Arabia PCIe Switches Market Estimates and Forecasts, By Application (2020-2032) (USD Billion)

10.5.1.8.3 Saudi Arabia PCIe Switches Market Estimates and Forecasts, By Industry (2020-2032) (USD Billion)

10.5.1.9 Qatar

10.5.1.9.1 Qatar PCIe Switches Market Estimates and Forecasts, By Type (2020-2032) (USD Billion)

10.5.1.9.2 Qatar PCIe Switches Market Estimates and Forecasts, By Application (2020-2032) (USD Billion)

10.5.1.9.3 Qatar PCIe Switches Market Estimates and Forecasts, By Industry (2020-2032) (USD Billion)

10.5.1.10 Rest of Middle East

10.5.1.10.1 Rest of Middle East PCIe Switches Market Estimates and Forecasts, By Type (2020-2032) (USD Billion)

10.5.1.10.2 Rest of Middle East PCIe Switches Market Estimates and Forecasts, By Application (2020-2032) (USD Billion)

10.5.1.10.3 Rest of Middle East PCIe Switches Market Estimates and Forecasts, By Industry (2020-2032) (USD Billion)

10.5.2 Africa

10.5.2.1 Trends Analysis

10.5.2.2 Africa PCIe Switches Market Estimates and Forecasts, by Country (2020-2032) (USD Billion)

10.5.2.3 Africa PCIe Switches Market Estimates and Forecasts, By Type (2020-2032) (USD Billion) 

10.5.2.4 Africa PCIe Switches Market Estimates and Forecasts, By Application (2020-2032) (USD Billion)

10.5.2.5 Africa PCIe Switches Market Estimates and Forecasts, By Industry (2020-2032) (USD Billion)

10.5.2.6 South Africa

10.5.2.6.1 South Africa PCIe Switches Market Estimates and Forecasts, By Type (2020-2032) (USD Billion)

10.5.2.6.2 South Africa PCIe Switches Market Estimates and Forecasts, By Application (2020-2032) (USD Billion)

10.5.2.6.3 South Africa PCIe Switches Market Estimates and Forecasts, By Industry (2020-2032) (USD Billion)

10.5.2.7 Nigeria

10.5.2.7.1 Nigeria PCIe Switches Market Estimates and Forecasts, By Type (2020-2032) (USD Billion)

10.5.2.7.2 Nigeria PCIe Switches Market Estimates and Forecasts, By Application (2020-2032) (USD Billion)

10.5.2.7.3 Nigeria PCIe Switches Market Estimates and Forecasts, By Industry (2020-2032) (USD Billion)

10.5.2.8 Rest of Africa

10.5.2.8.1 Rest of Africa PCIe Switches Market Estimates and Forecasts, By Type (2020-2032) (USD Billion)

10.5.2.8.2 Rest of Africa PCIe Switches Market Estimates and Forecasts, By Application (2020-2032) (USD Billion)

10.5.2.8.3 Rest of Africa PCIe Switches Market Estimates and Forecasts, By Industry (2020-2032) (USD Billion)

10.6 Latin America

10.6.1 Trends Analysis

10.6.2 Latin America PCIe Switches Market Estimates and Forecasts, by Country (2020-2032) (USD Billion)

10.6.3 Latin America PCIe Switches Market Estimates and Forecasts, By Type (2020-2032) (USD Billion) 

10.6.4 Latin America PCIe Switches Market Estimates and Forecasts, By Application (2020-2032) (USD Billion)

10.6.5 Latin America PCIe Switches Market Estimates and Forecasts, By Industry (2020-2032) (USD Billion)

10.6.6 Brazil

10.6.6.1 Brazil PCIe Switches Market Estimates and Forecasts, By Type (2020-2032) (USD Billion)

10.6.6.2 Brazil PCIe Switches Market Estimates and Forecasts, By Application (2020-2032) (USD Billion)

10.6.6.3 Brazil PCIe Switches Market Estimates and Forecasts, By Industry (2020-2032) (USD Billion)

10.6.7 Argentina

10.6.7.1 Argentina PCIe Switches Market Estimates and Forecasts, By Type (2020-2032) (USD Billion)

10.6.7.2 Argentina PCIe Switches Market Estimates and Forecasts, By Application (2020-2032) (USD Billion)

10.6.7.3 Argentina PCIe Switches Market Estimates and Forecasts, By Industry (2020-2032) (USD Billion)

10.6.8 Colombia

10.6.8.1 Colombia PCIe Switches Market Estimates and Forecasts, By Type (2020-2032) (USD Billion)

10.6.8.2 Colombia PCIe Switches Market Estimates and Forecasts, By Application (2020-2032) (USD Billion)

10.6.8.3 Colombia PCIe Switches Market Estimates and Forecasts, By Industry (2020-2032) (USD Billion)

10.6.9 Rest of Latin America

10.6.9.1 Rest of Latin America PCIe Switches Market Estimates and Forecasts, By Type (2020-2032) (USD Billion)

10.6.9.2 Rest of Latin America PCIe Switches Market Estimates and Forecasts, By Application (2020-2032) (USD Billion)

10.6.9.3 Rest of Latin America PCIe Switches Market Estimates and Forecasts, By Industry (2020-2032) (USD Billion)

11. Company Profiles

11.1 Broadcom.

11.1.1 Company Overview

11.1.2 Financial

11.1.3 Products/ Services Offered

11.1.4 SWOT Analysis

11.2 Intel

11.2.1 Company Overview

11.2.2 Financial

11.2.3 Products/ Services Offered

11.2.4 SWOT Analysis

11.3 Microchip Technology

11.3.1 Company Overview

11.3.2 Financial

11.3.3 Products/ Services Offered

11.3.4 SWOT Analysis

11.4 NXP Semiconductors

11.4.1 Company Overview

11.4.2 Financial

11.4.3 Products/ Services Offered

11.4.4 SWOT Analysis

11.5 Qualcomm

11.5.1 Company Overview

11.5.2 Financial

11.5.3 Products/ Services Offered

11.5.4 SWOT Analysis

11.6 Mellanox Technologies (now part of NVIDIA)

11.6.1 Company Overview

11.6.2 Financial

11.6.3 Products/ Services Offered

11.6.4 SWOT Analysis

11.7 IDT (Integrated Device Technology, now part of Renesas)

11.7.1 Company Overview

11.7.2 Financial

11.7.3 Products/ Services Offered

11.7.4 SWOT Analysis

11.8 Xilinx.

11.8.1 Company Overview

11.8.2 Financial

11.8.3 Products/ Services Offered

11.8.4 SWOT Analysis

11.9 Texas Instruments

11.9.1 Company Overview

11.9.2 Financial

11.9.3 Products/ Services Offered

11.9.4 SWOT Analysis

11.10 Pericom Semiconductor

11.10.1 Company Overview

11.10.2 Financial

11.10.3 Products/ Services Offered

11.10.4 SWOT Analysis

12. Use Cases and Best Practices

13. Conclusion

An accurate research report requires proper strategizing as well as implementation. There are multiple factors involved in the completion of good and accurate research report and selecting the best methodology to compete the research is the toughest part. Since the research reports we provide play a crucial role in any company’s decision-making process, therefore we at SNS Insider always believe that we should choose the best method which gives us results closer to reality. This allows us to reach at a stage wherein we can provide our clients best and accurate investment to output ratio.

Each report that we prepare takes a timeframe of 350-400 business hours for production. Starting from the selection of titles through a couple of in-depth brain storming session to the final QC process before uploading our titles on our website we dedicate around 350 working hours. The titles are selected based on their current market cap and the foreseen CAGR and growth.


The 5 steps process:

Step 1: Secondary Research:

Secondary Research or Desk Research is as the name suggests is a research process wherein, we collect data through the readily available information. In this process we use various paid and unpaid databases which our team has access to and gather data through the same. This includes examining of listed companies’ annual reports, Journals, SEC filling etc. Apart from this our team has access to various associations across the globe across different industries. Lastly, we have exchange relationships with various university as well as individual libraries.

Secondary Research

Step 2: Primary Research

When we talk about primary research, it is a type of study in which the researchers collect relevant data samples directly, rather than relying on previously collected data.  This type of research is focused on gaining content specific facts that can be sued to solve specific problems. Since the collected data is fresh and first hand therefore it makes the study more accurate and genuine.

We at SNS Insider have divided Primary Research into 2 parts.

Part 1 wherein we interview the KOLs of major players as well as the upcoming ones across various geographic regions. This allows us to have their view over the market scenario and acts as an important tool to come closer to the accurate market numbers. As many as 45 paid and unpaid primary interviews are taken from both the demand and supply side of the industry to make sure we land at an accurate judgement and analysis of the market.

This step involves the triangulation of data wherein our team analyses the interview transcripts, online survey responses and observation of on filed participants. The below mentioned chart should give a better understanding of the part 1 of the primary interview.

Primary Research

Part 2: In this part of primary research the data collected via secondary research and the part 1 of the primary research is validated with the interviews from individual consultants and subject matter experts.

Consultants are those set of people who have at least 12 years of experience and expertise within the industry whereas Subject Matter Experts are those with at least 15 years of experience behind their back within the same space. The data with the help of two main processes i.e., FGDs (Focused Group Discussions) and IDs (Individual Discussions). This gives us a 3rd party nonbiased primary view of the market scenario making it a more dependable one while collation of the data pointers.

Step 3: Data Bank Validation

Once all the information is collected via primary and secondary sources, we run that information for data validation. At our intelligence centre our research heads track a lot of information related to the market which includes the quarterly reports, the daily stock prices, and other relevant information. Our data bank server gets updated every fortnight and that is how the information which we collected using our primary and secondary information is revalidated in real time.

Data Bank Validation

Step 4: QA/QC Process

After all the data collection and validation our team does a final level of quality check and quality assurance to get rid of any unwanted or undesired mistakes. This might include but not limited to getting rid of the any typos, duplication of numbers or missing of any important information. The people involved in this process include technical content writers, research heads and graphics people. Once this process is completed the title gets uploader on our platform for our clients to read it.

Step 5: Final QC/QA Process:

This is the last process and comes when the client has ordered the study. In this process a final QA/QC is done before the study is emailed to the client. Since we believe in giving our clients a good experience of our research studies, therefore, to make sure that we do not lack at our end in any way humanly possible we do a final round of quality check and then dispatch the study to the client.

Key Segments:

By Type

  • Gen1

  • Gen2

  • Gen3

By Application

  • Data Center

  • Communication Industry

  • Industrial Application

  • Others

By Industry

    • Chemical & Petrochemical

    • Oil & Gas

    • Energy & Power

    • Automotive

    • Food & Beverages

    • Healthcare

    • Others

Request for Segment Customization as per your Business Requirement: Segment Customization Request

Regional Coverage:

North America

  • US

  • Canada

  • Mexico

Europe

  • Eastern Europe

    • Poland

    • Romania

    • Hungary

    • Turkey

    • Rest of Eastern Europe

  • Western Europe

    • Germany

    • France

    • UK

    • Italy

    • Spain

    • Netherlands

    • Switzerland

    • Austria

    • Rest of Western Europe

Asia Pacific

  • China

  • India

  • Japan

  • South Korea

  • Vietnam

  • Singapore

  • Australia

  • Rest of Asia Pacific

Middle East & Africa

  • Middle East

    • UAE

    • Egypt

    • Saudi Arabia

    • Qatar

    • Rest of Middle East

  • Africa

    • Nigeria

    • South Africa

    • Rest of Africa

Latin America

  • Brazil

  • Argentina

  • Colombia

  • Rest of Latin America

Request for Country Level Research Report: Country Level Customization Request

Available Customization

With the given market data, SNS Insider offers customization as per the company’s specific needs. The following customization options are available for the report:

  • Detailed Volume Analysis

  • Criss-Cross segment analysis (e.g. Product X Application)

  • Competitive Product Benchmarking

  • Geographic Analysis

  • Additional countries in any of the regions

  • Customized Data Representation

  • Detailed analysis and profiling of additional market players


  •            5000 (33% Discount)


  •            8950 (40% Discount)


  •            3050 (23% Discount)

Start a Conversation

Hi! Click one of our member below to chat on Phone