Get more information on Patient Access Solutions Market - Request Sample Report
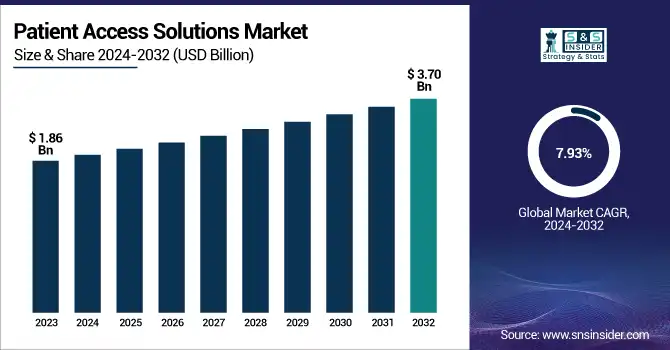
The Patient Access Solutions Market Size was valued at USD 1.86 Billion in 2023 and is expected to reach USD 3.70 Billion by 2032, growing at a CAGR of 7.93% over the forecast period of 2024-2032.
The Patient Access Solutions Market is evolving rapidly, fueled by rising investments in AI-driven and cloud-based technologies. Investment and funding trends reveal increasing capital flow into automation and interoperability, while patent analysis highlights innovations shaping seamless healthcare access. Enhancing patient engagement and satisfaction levels remains a priority, driving demand for efficient scheduling and verification systems. End-user spending trends indicate a shift toward digital transformation, with hospitals prioritizing seamless workflows. Evaluating return on investment (ROI) for hospitals and clinics is crucial, as providers seek cost-effective solutions. Meanwhile, healthcare provider budget allocations reflect growing investments in digital infrastructure to ensure efficiency and compliance. Our report explores these key dynamics, offering a comprehensive market perspective.
Drivers
Rising Integration of Blockchain Technology in Patient Access Solutions Enhances Data Security and Transparency
The integration of blockchain technology in patient access solutions is addressing critical challenges related to data security, interoperability, and transparency. Blockchain ensures tamper-proof data storage, reducing the risk of fraudulent activities and unauthorized access to patient records. With increasing concerns over data breaches in healthcare, blockchain-based solutions provide a decentralized and secure platform for managing patient data efficiently. Additionally, blockchain enhances interoperability by enabling seamless data sharing between healthcare providers, insurers, and patients, improving coordination in care delivery. The demand for transparent and secure transactions in the healthcare sector is accelerating the adoption of blockchain-based patient access solutions. As regulatory frameworks evolve to support blockchain integration, healthcare organizations are increasingly exploring its potential to enhance patient trust and compliance. Furthermore, blockchain-powered smart contracts are automating various administrative processes, such as insurance claims processing and patient consent management, improving overall efficiency. The growing collaboration between healthcare technology firms and blockchain service providers is also fostering innovation in patient access solutions.
Restraints
Concerns Over Data Privacy and Compliance Regulations Limit the Adoption of Digital Patient Access Solutions
Stringent data privacy regulations, such as HIPAA in the United States and GDPR in Europe, pose challenges to the widespread adoption of digital patient access solutions. Healthcare organizations must ensure compliance with these regulations while managing vast amounts of sensitive patient data. Any security breach or non-compliance can result in significant legal and financial repercussions, discouraging providers from adopting new digital solutions. Additionally, patient concerns regarding data privacy and unauthorized access to personal health information create hesitation in using digital platforms. The complexity of navigating compliance requirements across different regions further limits the seamless implementation of patient access solutions globally. Moreover, the growing adoption of cloud-based solutions raises additional security concerns, as cyberattacks and data breaches become more sophisticated. Healthcare providers must invest in robust cybersecurity measures, such as encryption and multi-factor authentication, to mitigate risks and ensure patient trust.
Opportunities
Expansion of Telehealth and Remote Patient Monitoring Creates New Growth Avenues for Patient Access Solutions Market
The rapid expansion of telehealth and remote patient monitoring services is opening new opportunities for patient access solutions. With the growing preference for virtual consultations, healthcare providers are investing in digital platforms that enable seamless patient onboarding, appointment scheduling, and remote access to medical records. Telehealth adoption has accelerated post-pandemic, driving the demand for integrated patient access solutions that support virtual care models. Additionally, remote patient monitoring tools require efficient data exchange between patients and healthcare providers, further necessitating advanced patient access platforms. As telehealth regulations continue to evolve, healthcare organizations are focusing on enhancing digital accessibility, paving the way for market growth. Furthermore, the integration of artificial intelligence (AI) and wearable technology is improving the accuracy and efficiency of remote patient monitoring. Healthcare providers are also leveraging cloud-based platforms to enable real-time access to patient data, enhancing decision-making and care coordination.
Challenge
Resistance to Digital Transformation Among Healthcare Providers Slows Down the Adoption of Patient Access Solutions
Despite the benefits of digital patient access solutions, resistance to technological change among healthcare providers remains a key challenge. Many hospitals and clinics continue to rely on traditional administrative processes, fearing operational disruptions during the transition to digital platforms. Limited technical expertise and staff reluctance to adopt new systems further hinder implementation efforts. Additionally, concerns about data security, system reliability, and interoperability issues contribute to hesitation in embracing digital transformation. Overcoming these challenges requires extensive training programs and robust change management strategies to encourage widespread adoption of patient access solutions. Furthermore, the reluctance of senior management to allocate sufficient budgets for IT upgrades is slowing down market penetration. Addressing these issues requires stronger collaboration between healthcare providers and technology vendors to ensure seamless integration and user-friendly system designs.
By Offering
Software dominated the Patient Access Solutions Market in 2023 with a market share of 59.8%. Within this segment, Eligibility Verification emerged as the leading subsegment due to the increasing complexity of insurance policies and the growing emphasis on accurate pre-service financial clearance. The rising adoption of AI-driven solutions for real-time insurance verification by healthcare providers such as Epic Systems, Cerner (Oracle Health), and Change Healthcare has fueled this growth. Additionally, government initiatives like the Centers for Medicare & Medicaid Services (CMS) Interoperability and Prior Authorization Proposed Rule (2023) emphasize automation in eligibility verification, further driving market adoption. As hospitals and clinics seek to minimize claim denials and revenue losses, advanced software solutions integrating AI and machine learning are being widely implemented across healthcare networks.
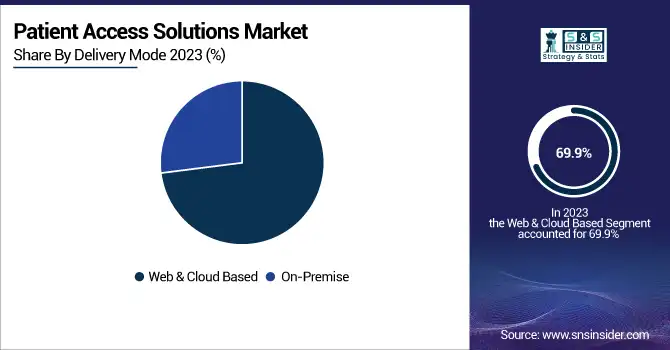
By Delivery Mode
Web & Cloud-Based solutions dominated the Patient Access Solutions Market in 2023 with a market share of 69.9%. The dominance of this segment is driven by its scalability, cost-effectiveness, and ease of deployment, making it the preferred choice for hospitals, clinics, and large healthcare networks. The U.S. Department of Health and Human Services (HHS) has actively promoted cloud-based healthcare IT adoption to improve interoperability and patient data exchange. Major players such as Athenahealth, Allscripts, and Optum have expanded their cloud-based patient access platforms, allowing seamless integration with electronic health records (EHRs). Additionally, the Healthcare Information and Management Systems Society (HIMSS) has highlighted cloud-based solutions as a key enabler for enhancing patient engagement and reducing administrative burdens. The pandemic further accelerated cloud adoption, with healthcare providers prioritizing remote access to patient data and automated scheduling systems.
By End-User
Healthcare Providers dominated the Patient Access Solutions Market in 2023 with a market share of 45.4%. The growing need for efficient revenue cycle management, reduced administrative costs, and enhanced patient experience has driven hospitals, clinics, and outpatient facilities to invest in advanced patient access solutions. The American Hospital Association (AHA) and the Centers for Medicare & Medicaid Services (CMS) have emphasized the importance of digital patient access solutions to improve care coordination and reduce claim denials. Large hospital networks, including Mayo Clinic, Cleveland Clinic, and Kaiser Permanente, have adopted AI-powered patient access software to streamline eligibility verification, appointment scheduling, and prior authorizations. Additionally, the surge in patient volume post-pandemic has further fueled the demand for automated solutions that enhance operational efficiency and ensure compliance with evolving healthcare regulations.
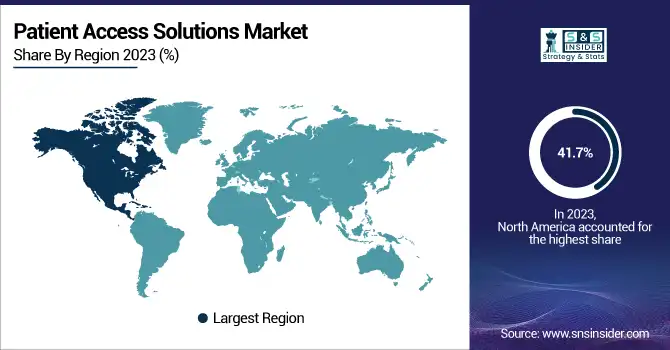
North America dominated the Patient Access Solutions Market in 2023 with a market share of 41.7%. The region's dominance is driven by the rapid digitalization of healthcare, favorable government initiatives, and the presence of key market players such as Optum, Cerner Corporation (Oracle Health), Epic Systems, and McKesson Corporation. The U.S. leads the market due to strong investments in healthcare IT infrastructure, stringent regulatory policies under the Health Insurance Portability and Accountability Act (HIPAA), and the 21st Century Cures Act, which mandates interoperability between healthcare providers. According to the Centers for Medicare & Medicaid Services (CMS), U.S. hospitals are increasingly adopting AI-driven patient access solutions to reduce administrative burdens and improve revenue cycle management. Canada is also experiencing significant adoption, with initiatives like the Pan-Canadian Interoperability Roadmap driving digital health transformation. The demand for cloud-based patient access solutions surged post-pandemic, leading to increased deployment across major healthcare networks.
Moreover, Asia Pacific emerged as the fastest-growing region in the Patient Access Solutions Market, with a significant CAGR during the forecast period. The region's growth is fueled by the increasing adoption of digital healthcare technologies, expanding healthcare infrastructure, and government-led initiatives promoting electronic health records (EHRs) and automated patient management solutions. China is leading the market due to its Healthy China 2030 strategy, which emphasizes digital health transformation and AI-driven healthcare IT adoption. According to the National Health Commission of China, over 80% of hospitals have implemented some form of digital patient access solutions. India is another major growth hub, with the Ayushman Bharat Digital Mission (ABDM) promoting interoperability and digital patient engagement platforms. Japan, backed by its Society 5.0 vision, is also investing heavily in healthcare automation, with hospitals adopting AI-powered eligibility verification and claims management software to streamline administrative processes.
Need any customization research on Patient Access Solutions Market - Enquiry Now
3M (M Modal Fluency for Coding, 3M 360 Encompass, 3M Health Data Management)
Allscripts Healthcare Solutions, Inc. (Allscripts Payerpath, Allscripts Revenue Cycle Management, Allscripts Practice Management)
Cognizant Technology Solutions Corporation (Trizetto Patient Access Solutions, Cognizant Health TranZform, Cognizant Intelligent Authorization)
Conifer Health Solutions (Conifer Patient Access Solutions, Conifer Revenue Cycle Solutions, Conifer Care Navigation)
Cerner Corporation (Cerner Registration Management, Cerner Eligibility & Coverage Verification, Cerner Revenue Cycle Management)
Cirius Group, Inc. (Cirius Eligibility Verification, Cirius Financial Clearance, Cirius Claim Management)
Craneware, Inc. (Trisus Patient Access, Chargemaster Toolkit, Trisus Claims Informatics)
Epic Systems Corporation (Epic Prelude, Epic Cadence, Epic Resolute)
Experian plc (Experian Health Patient Access, Experian eCare NEXT, Experian Revenue Cycle Management)
Genentech, Inc. (Genentech Access Solutions, Genentech MyPatientSolutions, Genentech Co-pay Programs)
Innovaccer Inc. (Innovaccer Health Cloud, Innovaccer Patient Relationship Management, Innovaccer Provider Network Management)
Kyruus (Kyruus ProviderMatch, Kyruus Patient Access Suite, Kyruus Connect)
McKesson Corporation (McKesson RelayHealth, McKesson Patient Access Solutions, McKesson Revenue Cycle Solutions)
MEDHOST (MEDHOST Enterprise Scheduling, MEDHOST Patient Access Solutions, MEDHOST Revenue Cycle Management)
Optum, Inc. (Optum One, Optum Eligibility & Claims Verification, Optum Financial Clearance)
Oracle Corporation (Oracle Health Revenue Cycle Management, Oracle Patient Access Solutions, Oracle Cloud Healthcare)
The SSI Group, LLC (SSI Access Management, SSI Claims Management, SSI Eligibility Verification)
TransUnion LLC (TransUnion ClearIQ, TransUnion Healthcare Eligibility Verification, TransUnion Revenue Cycle Solutions)
January 2025: Diatech Pharmacogenetics expanded its collaboration with Merck to enhance patient access to personalized medicine in the Middle East and Africa, improving RAS biomarker testing for colorectal cancer patients.
April 2024: CareMetx acquired PX Technology to streamline patient access to specialty medications, integrating digital solutions to reduce administrative burdens and improve efficiency.
April 2024: Kiosk Operators LLC (KO) acquired Wellmation to enhance healthcare and pharmaceutical access through advanced patient engagement solutions.
Report Attributes | Details |
---|---|
Market Size in 2023 | USD 1.86 Billion |
Market Size by 2032 | USD 3.70 Billion |
CAGR | CAGR of 7.93% From 2024 to 2032 |
Base Year | 2023 |
Forecast Period | 2024-2032 |
Historical Data | 2020-2022 |
Report Scope & Coverage | Market Size, Segments Analysis, Competitive Landscape, Regional Analysis, DROC & SWOT Analysis, Forecast Outlook |
Key Segments | •By Offering (Services [Support & Maintenance, Training & Education, Implementation], Software [Eligibility Verification, Medical Necessity Management, Pre-Certification & Authorization, Claims Denial & Appeal management, Payments Estimation Software, Claims Payment Assessment Software]) •By Delivery Mode (Web & Cloud Based, On-Premise) •By End-User (Healthcare Providers, HCIT Outsourcing Companies, Others) |
Regional Analysis/Coverage | North America (US, Canada, Mexico), Europe (Eastern Europe [Poland, Romania, Hungary, Turkey, Rest of Eastern Europe] Western Europe] Germany, France, UK, Italy, Spain, Netherlands, Switzerland, Austria, Rest of Western Europe]), Asia Pacific (China, India, Japan, South Korea, Vietnam, Singapore, Australia, Rest of Asia Pacific), Middle East & Africa (Middle East [UAE, Egypt, Saudi Arabia, Qatar, Rest of Middle East], Africa [Nigeria, South Africa, Rest of Africa], Latin America (Brazil, Argentina, Colombia, Rest of Latin America) |
Company Profiles | Optum, Inc., McKesson Corporation, Cerner Corporation, Epic Systems Corporation, Cognizant Technology Solutions Corporation, Experian plc, Conifer Health Solutions, Allscripts Healthcare Solutions, Inc., Oracle Corporation, 3M and other key players |
Ans: The Patient Access Solutions Market is expected to grow at a CAGR of 7.93% from 2024 to 2032.
Ans: The Patient Access Solutions Market is driven by AI adoption, cloud-based technologies, and increasing digital transformation.
Ans: The Patient Access Solutions Market is seeing enhanced data security and interoperability through blockchain integration.
Ans: In the Patient Access Solutions Market, the software segment leads, with eligibility verification as a key subsegment.
Ans: North America dominates the Patient Access Solutions Market due to strong healthcare IT infrastructure and regulatory support.
Table of Contents
1. Introduction
1.1 Market Definition
1.2 Scope (Inclusion and Exclusions)
1.3 Research Assumptions
2. Executive Summary
2.1 Market Overview
2.2 Regional Synopsis
2.3 Competitive Summary
3. Research Methodology
3.1 Top-Down Approach
3.2 Bottom-up Approach
3.3. Data Validation
3.4 Primary Interviews
4. Market Dynamics Impact Analysis
4.1 Market Driving Factors Analysis
4.1.1 Drivers
4.1.2 Restraints
4.1.3 Opportunities
4.1.4 Challenges
4.2 PESTLE Analysis
4.3 Porter’s Five Forces Model
5. Statistical Insights and Trends Reporting
5.1 Investment & Funding Trends
5.2 Patent Analysis
5.3 Patient Engagement & Satisfaction Levels
5.4 End-User Spending Trends
5.5 Return on Investment (ROI) for Hospitals & Clinics
5.6 Healthcare Provider Budget Allocations
6. Competitive Landscape
6.1 List of Major Companies, By Region
6.2 Market Share Analysis, By Region
6.3 Product Benchmarking
6.3.1 Product specifications and features
6.3.2 Pricing
6.4 Strategic Initiatives
6.4.1 Marketing and promotional activities
6.4.2 Distribution and supply chain strategies
6.4.3 Expansion plans and new product launches
6.4.4 Strategic partnerships and collaborations
6.5 Technological Advancements
6.6 Market Positioning and Branding
7. Patient Access Solutions Market Segmentation, by Offering
7.1 Chapter Overview
7.2 Services
7.2.1 Services Market Trends Analysis (2020-2032)
7.2.2 Services Market Size Estimates and Forecasts to 2032 (USD Billion)
7.3 Software
7.3.1 Software Market Trends Analysis (2020-2032)
7.3.2 Software Market Size Estimates and Forecasts to 2032 (USD Billion)
8. Patient Access Solutions Market Segmentation, by Delivery Mode
8.1 Chapter Overview
8.2 Web & Cloud Based
8.2.1 Web & Cloud Based Market Trends Analysis (2020-2032)
8.2.2 Web & Cloud Based Market Size Estimates and Forecasts to 2032 (USD Billion)
8.3 On-Premise
8.3.1 On-Premise Market Trends Analysis (2020-2032)
8.3.2 On-Premise Market Size Estimates and Forecasts to 2032 (USD Billion)
9. Patient Access Solutions Market Segmentation, by End User
9.1 Chapter Overview
9.2 Healthcare Providers
9.2.1 Healthcare Providers Market Trends Analysis (2020-2032)
9.2.2 Healthcare Providers Market Size Estimates and Forecasts to 2032 (USD Billion)
9.3 HCIT Outsourcing Companies
9.3.1 HCIT Outsourcing Companies Market Trends Analysis (2020-2032)
9.3.2 HCIT Outsourcing Companies Market Size Estimates and Forecasts to 2032 (USD Billion)
9.4 Others
9.4.1 Others Market Trends Analysis (2020-2032)
9.4.2 Others Market Size Estimates and Forecasts to 2032 (USD Billion)
10. Regional Analysis
10.1 Chapter Overview
10.2 North America
10.2.1 Trends Analysis
10.2.2 North America Patient Access Solutions Market Estimates and Forecasts, by Country (2020-2032) (USD Billion)
10.2.3 North America Patient Access Solutions Market Estimates and Forecasts, by Offering (2020-2032) (USD Billion)
10.2.4 North America Patient Access Solutions Market Estimates and Forecasts, by Delivery Mode (2020-2032) (USD Billion)
10.2.5 North America Patient Access Solutions Market Estimates and Forecasts, by End User (2020-2032) (USD Billion)
10.2.6 USA
10.2.6.1 USA Patient Access Solutions Market Estimates and Forecasts, by Offering (2020-2032) (USD Billion)
10.2.6.2 USA Patient Access Solutions Market Estimates and Forecasts, by Delivery Mode (2020-2032) (USD Billion)
10.2.6.3 USA Patient Access Solutions Market Estimates and Forecasts, by End User (2020-2032) (USD Billion)
10.2.7 Canada
10.2.7.1 Canada Patient Access Solutions Market Estimates and Forecasts, by Offering (2020-2032) (USD Billion)
10.2.7.2 Canada Patient Access Solutions Market Estimates and Forecasts, by Delivery Mode (2020-2032) (USD Billion)
10.2.7.3 Canada Patient Access Solutions Market Estimates and Forecasts, by End User (2020-2032) (USD Billion)
10.2.8 Mexico
10.2.8.1 Mexico Patient Access Solutions Market Estimates and Forecasts, by Offering (2020-2032) (USD Billion)
10.2.8.2 Mexico Patient Access Solutions Market Estimates and Forecasts, by Delivery Mode (2020-2032) (USD Billion)
10.2.8.3 Mexico Patient Access Solutions Market Estimates and Forecasts, by End User (2020-2032) (USD Billion)
10.3 Europe
10.3.1 Eastern Europe
10.3.1.1 Trends Analysis
10.3.1.2 Eastern Europe Patient Access Solutions Market Estimates and Forecasts, by Country (2020-2032) (USD Billion)
10.3.1.3 Eastern Europe Patient Access Solutions Market Estimates and Forecasts, by Offering (2020-2032) (USD Billion)
10.3.1.4 Eastern Europe Patient Access Solutions Market Estimates and Forecasts, by Delivery Mode (2020-2032) (USD Billion)
10.3.1.5 Eastern Europe Patient Access Solutions Market Estimates and Forecasts, by End User (2020-2032) (USD Billion)
10.3.1.6 Poland
10.3.1.6.1 Poland Patient Access Solutions Market Estimates and Forecasts, by Offering (2020-2032) (USD Billion)
10.3.1.6.2 Poland Patient Access Solutions Market Estimates and Forecasts, by Delivery Mode (2020-2032) (USD Billion)
10.3.1.6.3 Poland Patient Access Solutions Market Estimates and Forecasts, by End User (2020-2032) (USD Billion)
10.3.1.7 Romania
10.3.1.7.1 Romania Patient Access Solutions Market Estimates and Forecasts, by Offering (2020-2032) (USD Billion)
10.3.1.7.2 Romania Patient Access Solutions Market Estimates and Forecasts, by Delivery Mode (2020-2032) (USD Billion)
10.3.1.7.3 Romania Patient Access Solutions Market Estimates and Forecasts, by End User (2020-2032) (USD Billion)
10.3.1.8 Hungary
10.3.1.8.1 Hungary Patient Access Solutions Market Estimates and Forecasts, by Offering (2020-2032) (USD Billion)
10.3.1.8.2 Hungary Patient Access Solutions Market Estimates and Forecasts, by Delivery Mode (2020-2032) (USD Billion)
10.3.1.8.3 Hungary Patient Access Solutions Market Estimates and Forecasts, by End User (2020-2032) (USD Billion)
10.3.1.9 Turkey
10.3.1.9.1 Turkey Patient Access Solutions Market Estimates and Forecasts, by Offering (2020-2032) (USD Billion)
10.3.1.9.2 Turkey Patient Access Solutions Market Estimates and Forecasts, by Delivery Mode (2020-2032) (USD Billion)
10.3.1.9.3 Turkey Patient Access Solutions Market Estimates and Forecasts, by End User (2020-2032) (USD Billion)
10.3.1.10 Rest of Eastern Europe
10.3.1.10.1 Rest of Eastern Europe Patient Access Solutions Market Estimates and Forecasts, by Offering (2020-2032) (USD Billion)
10.3.1.10.2 Rest of Eastern Europe Patient Access Solutions Market Estimates and Forecasts, by Delivery Mode (2020-2032) (USD Billion)
10.3.1.10.3 Rest of Eastern Europe Patient Access Solutions Market Estimates and Forecasts, by End User (2020-2032) (USD Billion)
10.3.2 Western Europe
10.3.2.1 Trends Analysis
10.3.2.2 Western Europe Patient Access Solutions Market Estimates and Forecasts, by Country (2020-2032) (USD Billion)
10.3.2.3 Western Europe Patient Access Solutions Market Estimates and Forecasts, by Offering (2020-2032) (USD Billion)
10.3.2.4 Western Europe Patient Access Solutions Market Estimates and Forecasts, by Delivery Mode (2020-2032) (USD Billion)
10.3.2.5 Western Europe Patient Access Solutions Market Estimates and Forecasts, by End User (2020-2032) (USD Billion)
10.3.2.6 Germany
10.3.2.6.1 Germany Patient Access Solutions Market Estimates and Forecasts, by Offering (2020-2032) (USD Billion)
10.3.2.6.2 Germany Patient Access Solutions Market Estimates and Forecasts, by Delivery Mode (2020-2032) (USD Billion)
10.3.2.6.3 Germany Patient Access Solutions Market Estimates and Forecasts, by End User (2020-2032) (USD Billion)
10.3.2.7 France
10.3.2.7.1 France Patient Access Solutions Market Estimates and Forecasts, by Offering (2020-2032) (USD Billion)
10.3.2.7.2 France Patient Access Solutions Market Estimates and Forecasts, by Delivery Mode (2020-2032) (USD Billion)
10.3.2.7.3 France Patient Access Solutions Market Estimates and Forecasts, by End User (2020-2032) (USD Billion)
10.3.2.8 UK
10.3.2.8.1 UK Patient Access Solutions Market Estimates and Forecasts, by Offering (2020-2032) (USD Billion)
10.3.2.8.2 UK Patient Access Solutions Market Estimates and Forecasts, by Delivery Mode (2020-2032) (USD Billion)
10.3.2.8.3 UK Patient Access Solutions Market Estimates and Forecasts, by End User (2020-2032) (USD Billion)
10.3.2.9 Italy
10.3.2.9.1 Italy Patient Access Solutions Market Estimates and Forecasts, by Offering (2020-2032) (USD Billion)
10.3.2.9.2 Italy Patient Access Solutions Market Estimates and Forecasts, by Delivery Mode (2020-2032) (USD Billion)
10.3.2.9.3 Italy Patient Access Solutions Market Estimates and Forecasts, by End User (2020-2032) (USD Billion)
10.3.2.10 Spain
10.3.2.10.1 Spain Patient Access Solutions Market Estimates and Forecasts, by Offering (2020-2032) (USD Billion)
10.3.2.10.2 Spain Patient Access Solutions Market Estimates and Forecasts, by Delivery Mode (2020-2032) (USD Billion)
10.3.2.10.3 Spain Patient Access Solutions Market Estimates and Forecasts, by End User (2020-2032) (USD Billion)
10.3.2.11 Netherlands
10.3.2.11.1 Netherlands Patient Access Solutions Market Estimates and Forecasts, by Offering (2020-2032) (USD Billion)
10.3.2.11.2 Netherlands Patient Access Solutions Market Estimates and Forecasts, by Delivery Mode (2020-2032) (USD Billion)
10.3.2.11.3 Netherlands Patient Access Solutions Market Estimates and Forecasts, by End User (2020-2032) (USD Billion)
10.3.2.12 Switzerland
10.3.2.12.1 Switzerland Patient Access Solutions Market Estimates and Forecasts, by Offering (2020-2032) (USD Billion)
10.3.2.12.2 Switzerland Patient Access Solutions Market Estimates and Forecasts, by Delivery Mode (2020-2032) (USD Billion)
10.3.2.12.3 Switzerland Patient Access Solutions Market Estimates and Forecasts, by End User (2020-2032) (USD Billion)
10.3.2.13 Austria
10.3.2.13.1 Austria Patient Access Solutions Market Estimates and Forecasts, by Offering (2020-2032) (USD Billion)
10.3.2.13.2 Austria Patient Access Solutions Market Estimates and Forecasts, by Delivery Mode (2020-2032) (USD Billion)
10.3.2.13.3 Austria Patient Access Solutions Market Estimates and Forecasts, by End User (2020-2032) (USD Billion)
10.3.2.14 Rest of Western Europe
10.3.2.14.1 Rest of Western Europe Patient Access Solutions Market Estimates and Forecasts, by Offering (2020-2032) (USD Billion)
10.3.2.14.2 Rest of Western Europe Patient Access Solutions Market Estimates and Forecasts, by Delivery Mode (2020-2032) (USD Billion)
10.3.2.14.3 Rest of Western Europe Patient Access Solutions Market Estimates and Forecasts, by End User (2020-2032) (USD Billion)
10.4 Asia Pacific
10.4.1 Trends Analysis
10.4.2 Asia Pacific Patient Access Solutions Market Estimates and Forecasts, by Country (2020-2032) (USD Billion)
10.4.3 Asia Pacific Patient Access Solutions Market Estimates and Forecasts, by Offering (2020-2032) (USD Billion)
10.4.4 Asia Pacific Patient Access Solutions Market Estimates and Forecasts, by Delivery Mode (2020-2032) (USD Billion)
10.4.5 Asia Pacific Patient Access Solutions Market Estimates and Forecasts, by End User (2020-2032) (USD Billion)
10.4.6 China
10.4.6.1 China Patient Access Solutions Market Estimates and Forecasts, by Offering (2020-2032) (USD Billion)
10.4.6.2 China Patient Access Solutions Market Estimates and Forecasts, by Delivery Mode (2020-2032) (USD Billion)
10.4.6.3 China Patient Access Solutions Market Estimates and Forecasts, by End User (2020-2032) (USD Billion)
10.4.7 India
10.4.7.1 India Patient Access Solutions Market Estimates and Forecasts, by Offering (2020-2032) (USD Billion)
10.4.7.2 India Patient Access Solutions Market Estimates and Forecasts, by Delivery Mode (2020-2032) (USD Billion)
10.4.7.3 India Patient Access Solutions Market Estimates and Forecasts, by End User (2020-2032) (USD Billion)
10.4.8 Japan
10.4.8.1 Japan Patient Access Solutions Market Estimates and Forecasts, by Offering (2020-2032) (USD Billion)
10.4.8.2 Japan Patient Access Solutions Market Estimates and Forecasts, by Delivery Mode (2020-2032) (USD Billion)
10.4.8.3 Japan Patient Access Solutions Market Estimates and Forecasts, by End User (2020-2032) (USD Billion)
10.4.9 South Korea
10.4.9.1 South Korea Patient Access Solutions Market Estimates and Forecasts, by Offering (2020-2032) (USD Billion)
10.4.9.2 South Korea Patient Access Solutions Market Estimates and Forecasts, by Delivery Mode (2020-2032) (USD Billion)
10.4.9.3 South Korea Patient Access Solutions Market Estimates and Forecasts, by End User (2020-2032) (USD Billion)
10.4.10 Vietnam
10.4.10.1 Vietnam Patient Access Solutions Market Estimates and Forecasts, by Offering (2020-2032) (USD Billion)
10.4.10.2 Vietnam Patient Access Solutions Market Estimates and Forecasts, by Delivery Mode (2020-2032) (USD Billion)
10.4.10.3 Vietnam Patient Access Solutions Market Estimates and Forecasts, by End User (2020-2032) (USD Billion)
10.4.11 Singapore
10.4.11.1 Singapore Patient Access Solutions Market Estimates and Forecasts, by Offering (2020-2032) (USD Billion)
10.4.11.2 Singapore Patient Access Solutions Market Estimates and Forecasts, by Delivery Mode (2020-2032) (USD Billion)
10.4.11.3 Singapore Patient Access Solutions Market Estimates and Forecasts, by End User (2020-2032) (USD Billion)
10.4.12 Australia
10.4.12.1 Australia Patient Access Solutions Market Estimates and Forecasts, by Offering (2020-2032) (USD Billion)
10.4.12.2 Australia Patient Access Solutions Market Estimates and Forecasts, by Delivery Mode (2020-2032) (USD Billion)
10.4.12.3 Australia Patient Access Solutions Market Estimates and Forecasts, by End User (2020-2032) (USD Billion)
10.4.13 Rest of Asia Pacific
10.4.13.1 Rest of Asia Pacific Patient Access Solutions Market Estimates and Forecasts, by Offering (2020-2032) (USD Billion)
10.4.13.2 Rest of Asia Pacific Patient Access Solutions Market Estimates and Forecasts, by Delivery Mode (2020-2032) (USD Billion)
10.4.13.3 Rest of Asia Pacific Patient Access Solutions Market Estimates and Forecasts, by End User (2020-2032) (USD Billion)
10.5 Middle East and Africa
10.5.1 Middle East
10.5.1.1 Trends Analysis
10.5.1.2 Middle East Patient Access Solutions Market Estimates and Forecasts, by Country (2020-2032) (USD Billion)
10.5.1.3 Middle East Patient Access Solutions Market Estimates and Forecasts, by Offering (2020-2032) (USD Billion)
10.5.1.4 Middle East Patient Access Solutions Market Estimates and Forecasts, by Delivery Mode (2020-2032) (USD Billion)
10.5.1.5 Middle East Patient Access Solutions Market Estimates and Forecasts, by End User (2020-2032) (USD Billion)
10.5.1.6 UAE
10.5.1.6.1 UAE Patient Access Solutions Market Estimates and Forecasts, by Offering (2020-2032) (USD Billion)
10.5.1.6.2 UAE Patient Access Solutions Market Estimates and Forecasts, by Delivery Mode (2020-2032) (USD Billion)
10.5.1.6.3 UAE Patient Access Solutions Market Estimates and Forecasts, by End User (2020-2032) (USD Billion)
10.5.1.7 Egypt
10.5.1.7.1 Egypt Patient Access Solutions Market Estimates and Forecasts, by Offering (2020-2032) (USD Billion)
10.5.1.7.2 Egypt Patient Access Solutions Market Estimates and Forecasts, by Delivery Mode (2020-2032) (USD Billion)
10.5.1.7.3 Egypt Patient Access Solutions Market Estimates and Forecasts, by End User (2020-2032) (USD Billion)
10.5.1.8 Saudi Arabia
10.5.1.8.1 Saudi Arabia Patient Access Solutions Market Estimates and Forecasts, by Offering (2020-2032) (USD Billion)
10.5.1.8.2 Saudi Arabia Patient Access Solutions Market Estimates and Forecasts, by Delivery Mode (2020-2032) (USD Billion)
10.5.1.8.3 Saudi Arabia Patient Access Solutions Market Estimates and Forecasts, by End User (2020-2032) (USD Billion)
10.5.1.9 Qatar
10.5.1.9.1 Qatar Patient Access Solutions Market Estimates and Forecasts, by Offering (2020-2032) (USD Billion)
10.5.1.9.2 Qatar Patient Access Solutions Market Estimates and Forecasts, by Delivery Mode (2020-2032) (USD Billion)
10.5.1.9.3 Qatar Patient Access Solutions Market Estimates and Forecasts, by End User (2020-2032) (USD Billion)
10.5.1.10 Rest of Middle East
10.5.1.10.1 Rest of Middle East Patient Access Solutions Market Estimates and Forecasts, by Offering (2020-2032) (USD Billion)
10.5.1.10.2 Rest of Middle East Patient Access Solutions Market Estimates and Forecasts, by Delivery Mode (2020-2032) (USD Billion)
10.5.1.10.3 Rest of Middle East Patient Access Solutions Market Estimates and Forecasts, by End User (2020-2032) (USD Billion)
10.5.2 Africa
10.5.2.1 Trends Analysis
10.5.2.2 Africa Patient Access Solutions Market Estimates and Forecasts, by Country (2020-2032) (USD Billion)
10.5.2.3 Africa Patient Access Solutions Market Estimates and Forecasts, by Offering (2020-2032) (USD Billion)
10.5.2.4 Africa Patient Access Solutions Market Estimates and Forecasts, by Delivery Mode (2020-2032) (USD Billion)
10.5.2.5 Africa Patient Access Solutions Market Estimates and Forecasts, by End User (2020-2032) (USD Billion)
10.5.2.6 South Africa
10.5.2.6.1 South Africa Patient Access Solutions Market Estimates and Forecasts, by Offering (2020-2032) (USD Billion)
10.5.2.6.2 South Africa Patient Access Solutions Market Estimates and Forecasts, by Delivery Mode (2020-2032) (USD Billion)
10.5.2.6.3 South Africa Patient Access Solutions Market Estimates and Forecasts, by End User (2020-2032) (USD Billion)
10.5.2.7 Nigeria
10.5.2.7.1 Nigeria Patient Access Solutions Market Estimates and Forecasts, by Offering (2020-2032) (USD Billion)
10.5.2.7.2 Nigeria Patient Access Solutions Market Estimates and Forecasts, by Delivery Mode (2020-2032) (USD Billion)
10.5.2.7.3 Nigeria Patient Access Solutions Market Estimates and Forecasts, by End User (2020-2032) (USD Billion)
10.5.2.8 Rest of Africa
10.5.2.8.1 Rest of Africa Patient Access Solutions Market Estimates and Forecasts, by Offering (2020-2032) (USD Billion)
10.5.2.8.2 Rest of Africa Patient Access Solutions Market Estimates and Forecasts, by Delivery Mode (2020-2032) (USD Billion)
10.5.2.8.3 Rest of Africa Patient Access Solutions Market Estimates and Forecasts, by End User (2020-2032) (USD Billion)
10.6 Latin America
10.6.1 Trends Analysis
10.6.2 Latin America Patient Access Solutions Market Estimates and Forecasts, by Country (2020-2032) (USD Billion)
10.6.3 Latin America Patient Access Solutions Market Estimates and Forecasts, by Offering (2020-2032) (USD Billion)
10.6.4 Latin America Patient Access Solutions Market Estimates and Forecasts, by Delivery Mode (2020-2032) (USD Billion)
10.6.5 Latin America Patient Access Solutions Market Estimates and Forecasts, by End User (2020-2032) (USD Billion)
10.6.6 Brazil
10.6.6.1 Brazil Patient Access Solutions Market Estimates and Forecasts, by Offering (2020-2032) (USD Billion)
10.6.6.2 Brazil Patient Access Solutions Market Estimates and Forecasts, by Delivery Mode (2020-2032) (USD Billion)
10.6.6.3 Brazil Patient Access Solutions Market Estimates and Forecasts, by End User (2020-2032) (USD Billion)
10.6.7 Argentina
10.6.7.1 Argentina Patient Access Solutions Market Estimates and Forecasts, by Offering (2020-2032) (USD Billion)
10.6.7.2 Argentina Patient Access Solutions Market Estimates and Forecasts, by Delivery Mode (2020-2032) (USD Billion)
10.6.7.3 Argentina Patient Access Solutions Market Estimates and Forecasts, by End User (2020-2032) (USD Billion)
10.6.8 Colombia
10.6.8.1 Colombia Patient Access Solutions Market Estimates and Forecasts, by Offering (2020-2032) (USD Billion)
10.6.8.2 Colombia Patient Access Solutions Market Estimates and Forecasts, by Delivery Mode (2020-2032) (USD Billion)
10.6.8.3 Colombia Patient Access Solutions Market Estimates and Forecasts, by End User (2020-2032) (USD Billion)
10.6.9 Rest of Latin America
10.6.9.1 Rest of Latin America Patient Access Solutions Market Estimates and Forecasts, by Offering (2020-2032) (USD Billion)
10.6.9.2 Rest of Latin America Patient Access Solutions Market Estimates and Forecasts, by Delivery Mode (2020-2032) (USD Billion)
10.6.9.3 Rest of Latin America Patient Access Solutions Market Estimates and Forecasts, by End User (2020-2032) (USD Billion)
11. Company Profiles
11.1 Optum, Inc.
11.1.1 Company Overview
11.1.2 Financial
11.1.3 Products/ Services Offered
11.1.4 SWOT Analysis
11.2 McKesson Corporation
11.2.1 Company Overview
11.2.2 Financial
11.2.3 Products/ Services Offered
11.2.4 SWOT Analysis
11.3 Cerner Corporation
11.3.1 Company Overview
11.3.2 Financial
11.3.3 Products/ Services Offered
11.3.4 SWOT Analysis
11.4 Epic Systems Corporation
11.4.1 Company Overview
11.4.2 Financial
11.4.3 Products/ Services Offered
11.4.4 SWOT Analysis
11.5 Cognizant Technology Solutions Corporation
11.5.1 Company Overview
11.5.2 Financial
11.5.3 Products/ Services Offered
11.5.4 SWOT Analysis
11.6 Experian plc
11.6.1 Company Overview
11.6.2 Financial
11.6.3 Products/ Services Offered
11.6.4 SWOT Analysis
11.7 Conifer Health Solutions
11.7.1 Company Overview
11.7.2 Financial
11.7.3 Products/ Services Offered
11.7.4 SWOT Analysis
11.8 Allscripts Healthcare Solutions, Inc.
11.8.1 Company Overview
11.8.2 Financial
11.8.3 Products/ Services Offered
11.8.4 SWOT Analysis
11.9 Oracle Corporation
11.9.1 Company Overview
11.9.2 Financial
11.9.3 Products/ Services Offered
11.9.4 SWOT Analysis
11.10 3M
11.10.1 Company Overview
11.10.2 Financial
11.10.3 Products/ Services Offered
11.10.4 SWOT Analysis
12. Use Cases and Best Practices
13. Conclusion
An accurate research report requires proper strategizing as well as implementation. There are multiple factors involved in the completion of good and accurate research report and selecting the best methodology to compete the research is the toughest part. Since the research reports we provide play a crucial role in any company’s decision-making process, therefore we at SNS Insider always believe that we should choose the best method which gives us results closer to reality. This allows us to reach at a stage wherein we can provide our clients best and accurate investment to output ratio.
Each report that we prepare takes a timeframe of 350-400 business hours for production. Starting from the selection of titles through a couple of in-depth brain storming session to the final QC process before uploading our titles on our website we dedicate around 350 working hours. The titles are selected based on their current market cap and the foreseen CAGR and growth.
The 5 steps process:
Step 1: Secondary Research:
Secondary Research or Desk Research is as the name suggests is a research process wherein, we collect data through the readily available information. In this process we use various paid and unpaid databases which our team has access to and gather data through the same. This includes examining of listed companies’ annual reports, Journals, SEC filling etc. Apart from this our team has access to various associations across the globe across different industries. Lastly, we have exchange relationships with various university as well as individual libraries.
Step 2: Primary Research
When we talk about primary research, it is a type of study in which the researchers collect relevant data samples directly, rather than relying on previously collected data. This type of research is focused on gaining content specific facts that can be sued to solve specific problems. Since the collected data is fresh and first hand therefore it makes the study more accurate and genuine.
We at SNS Insider have divided Primary Research into 2 parts.
Part 1 wherein we interview the KOLs of major players as well as the upcoming ones across various geographic regions. This allows us to have their view over the market scenario and acts as an important tool to come closer to the accurate market numbers. As many as 45 paid and unpaid primary interviews are taken from both the demand and supply side of the industry to make sure we land at an accurate judgement and analysis of the market.
This step involves the triangulation of data wherein our team analyses the interview transcripts, online survey responses and observation of on filed participants. The below mentioned chart should give a better understanding of the part 1 of the primary interview.
Part 2: In this part of primary research the data collected via secondary research and the part 1 of the primary research is validated with the interviews from individual consultants and subject matter experts.
Consultants are those set of people who have at least 12 years of experience and expertise within the industry whereas Subject Matter Experts are those with at least 15 years of experience behind their back within the same space. The data with the help of two main processes i.e., FGDs (Focused Group Discussions) and IDs (Individual Discussions). This gives us a 3rd party nonbiased primary view of the market scenario making it a more dependable one while collation of the data pointers.
Step 3: Data Bank Validation
Once all the information is collected via primary and secondary sources, we run that information for data validation. At our intelligence centre our research heads track a lot of information related to the market which includes the quarterly reports, the daily stock prices, and other relevant information. Our data bank server gets updated every fortnight and that is how the information which we collected using our primary and secondary information is revalidated in real time.
Step 4: QA/QC Process
After all the data collection and validation our team does a final level of quality check and quality assurance to get rid of any unwanted or undesired mistakes. This might include but not limited to getting rid of the any typos, duplication of numbers or missing of any important information. The people involved in this process include technical content writers, research heads and graphics people. Once this process is completed the title gets uploader on our platform for our clients to read it.
Step 5: Final QC/QA Process:
This is the last process and comes when the client has ordered the study. In this process a final QA/QC is done before the study is emailed to the client. Since we believe in giving our clients a good experience of our research studies, therefore, to make sure that we do not lack at our end in any way humanly possible we do a final round of quality check and then dispatch the study to the client.
Key Segments:
By Offering
Services
Support & Maintenance
Training & Education
Implementation
Software
Eligibility Verification
Medical Necessity Management
Pre-Certification & Authorization
Claims Denial & Appeal management
Payments Estimation Software
Claims Payment Assessment Software
By Delivery Mode
Web & Cloud Based
On-Premise
By End-User
Healthcare Providers
HCIT Outsourcing Companies
Others
Request for Segment Customization as per your Business Requirement: Segment Customization Request
Regional Coverage:
North America
US
Canada
Mexico
Europe
Eastern Europe
Poland
Romania
Hungary
Turkey
Rest of Eastern Europe
Western Europe
Germany
France
UK
Italy
Spain
Netherlands
Switzerland
Austria
Rest of Western Europe
Asia Pacific
China
India
Japan
South Korea
Vietnam
Singapore
Australia
Rest of Asia Pacific
Middle East & Africa
Middle East
UAE
Egypt
Saudi Arabia
Qatar
Rest of Middle East
Africa
Nigeria
South Africa
Rest of Africa
Latin America
Brazil
Argentina
Colombia
Rest of Latin America
Request for Country Level Research Report: Country Level Customization Request
Available Customization
With the given market data, SNS Insider offers customization as per the company’s specific needs. The following customization options are available for the report:
Detailed Volume Analysis
Criss-Cross segment analysis (e.g. Product X Application)
Competitive Product Benchmarking
Geographic Analysis
Additional countries in any of the regions
Customized Data Representation
Detailed analysis and profiling of additional market players
The Ovulation Test Kits Market size was valued at USD 1.53 billion in 2023, and is expected to reach USD 2.95 billion by 2032, and grow at a CAGR of 7.57% over the forecast period 2024-2032.
The Blood Transfusion Diagnostics Market was estimated at USD 4.70 billion in 2022 and is poised to reach 8.38 billion in 2030 anticipated to expand at a compound annual growth rate approx. CAGR of 7.2% for the forecast period of 2023-2030.
The Pancreatic Cancer Treatment Market size was valued at USD 2.8 billion in 2023 and is expected to reach USD 10.53 billion by 2032 and grow at a CAGR of 15.85%.
The Recombinant Proteins Market size was USD 2.5 billion in 2023 and is expected to reach USD 5.0 billion by 2032 with a growing CAGR of 7.6% by 2023-2032.
The Cold, Cough, and Sore Throat Remedies Market size was estimated USD 41.22 billion in 2023 and is expected to reach USD 56.17 billion by 2032 at a CAGR of 3.5% during the forecast period of 2024-2032.
The Influenza Diagnostics Market Size was USD 1.49 billion in 2023 and will reach USD 2.45 billion by 2032, growing at a CAGR of 5.69% from 2024-2032.
Hi! Click one of our member below to chat on Phone