Passive Optical Network Market Report Scope & Overview:
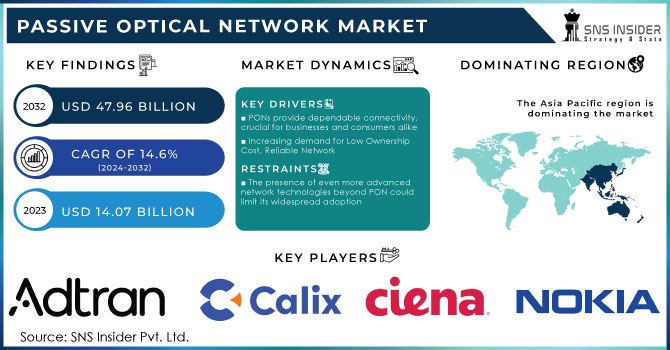
The Passive Optical Network Market Size was valued at USD 14.44 Billion in 2023 and is expected to reach USD 49.03 Billion by 2032 and grow at a CAGR of 14.55% over the forecast period 2024-2032.
Get more information on Passive Optical Network (PON) Market - Request Sample Report
The Passive Optical Network (PON) market is experiencing substantial growth driven by advancements in fiber optic technology, including the development of 50G PON, which supports faster speeds and higher bandwidth. As data traffic grows exponentially, the demand for networks with greater capacity is escalating. PONs offer a viable solution, delivering gigabit speeds over long distances without requiring active components or expensive optical fiber. This is particularly important as consumers increasingly demand faster, more reliable networks to support bandwidth-intensive applications such as video streaming, cloud gaming, and ultra-HD TV. According to the UN, over 68% of the global population is expected to live in urban areas by 2050, fueling the rise of smart city projects, which rely heavily on fiber optic networks to support IoT infrastructure for utilities like water, electricity, and security. The demand for high-speed internet is also being driven by the rapid adoption of fiber-to-the-home (FTTH) solutions, particularly in emerging economies with limited high-speed internet penetration. For instance, in China, mobile data usage per user doubled over the past three years, reaching 14.9 GB monthly, partly due to Passive Optical Network technology's ability to deliver high-speed data symmetrically supports growing demand for connected smart home products and ensures a high return on investment with low ownership costs. Additionally, the global expansion of 5G networks and the growing reliance on cloud computing are contributing to the increasing demand for high-performance optical networks. With innovations in dynamic bandwidth allocation and scalable 25G and 50G Passive Optical Network technologies, the Passive Optical Network market is poised for continued growth, supporting next-generation applications such as smart farming, augmented reality, and remote healthcare.
Market Dynamics
Drivers
-
The global 5G network rollout is driving increased demand for high-speed backhaul solutions, fueling the need for Passive Optical Network technology.
Passive Optical Networks are increasingly becoming a crucial component in supporting the data transfer needs of 5G infrastructure. As 5G networks require higher bandwidth and ultra-low latency to support the growing number of connected devices, the scalability and high-speed capabilities of PONs make them an ideal solution for 5G backhaul, facilitating seamless data transmission between cell towers and the core network. PON technology, particularly the advancements toward 10G and 25G PON, addresses the need for massive data transport in a cost-efficient manner. According to industry reports, PON is poised to play a pivotal role in the 5G ecosystem by supporting both mobile data traffic and fixed broadband access. The technology offers symmetric data transfer, providing reliable and high-capacity solutions that meet the bandwidth demands of diverse 5G applications, including enhanced mobile broadband, massive IoT connectivity, and ultra-reliable low-latency communication. The demand for such robust solutions is further amplified by the rapid development of smart cities, autonomous vehicles, and industrial automation, all of which rely on high-speed data transmission that Passive Optical Network can deliver. The need for 5G backhaul solutions is being propelled by various industries, from telecommunications to urban development, as they aim to enhance network efficiency and ensure future-proof infrastructure. In this context, Passive Optical Network technology's ability to deliver scalable and high-performance solutions aligns with the transition to 5G networks, solidifying its role as a critical enabler of next-generation connectivity.
Restraints
-
Regulatory and licensing hurdles, including complex permits and regional variations, are slowing the adoption of Passive Optical Network (PON) technology.
Telecommunications authorities and governments enforce these regulations to oversee infrastructure development, ensure network security, and maintain market competition. These regulatory barriers can slow down the deployment of PON networks, raising operational costs and hindering the ability of operators to scale their networks quickly. A key obstacle is the time-consuming and intricate permitting process required for PON network rollouts, which involve installing extensive fiber optic infrastructure, such as cables, optical network terminals, and central office equipment. In many regions, operators must deal with local zoning laws, negotiate with landowners, and obtain environmental clearances, all of which contribute to delays in project timelines. Additionally, regulations governing telecommunications infrastructure are often stringent, placing limits on network ownership and operation. These rules require telecom companies to secure licenses for frequency spectrum allocation and network management. The involvement of foreign investors in telecom ventures can further complicate the regulatory landscape, subjecting international players to additional scrutiny. Licensing requirements for foreign operators can differ from those for domestic entities, further complicating efforts to expand networks across borders. Moreover, regions with strict regulations impose technical standards that operators must meet, such as safety checks, environmental impact assessments, and compliance with regional connectivity rules.
Segment Analysis
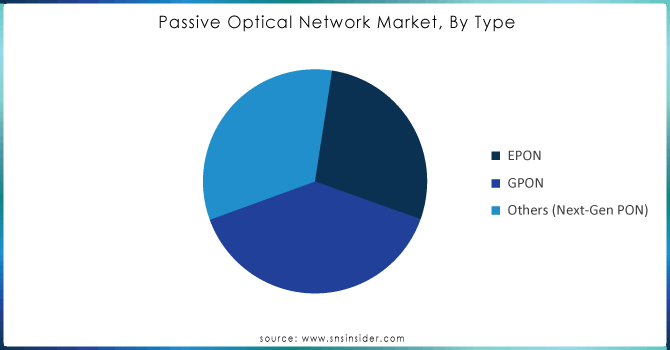
By Structure
In the Passive Optical Network market, the Gigabit Passive Optical Network (GPON) segment is the dominant player, capturing approximately 48% of the market share in 2023. GPON technology offers high-speed internet connectivity, making it a preferred choice for service providers aiming to meet growing bandwidth demands, particularly in fiber-to-the-home (FTTH) deployments. The popularity of GPON is driven by its ability to deliver gigabit speeds over long distances with minimal infrastructure costs, providing a cost-effective solution for broadband expansion. It supports multiple services, such as voice, video, and data, over a single fiber optic line, making it ideal for residential and commercial applications. As demand for faster and more reliable internet connections continues to rise, GPON is expected to maintain its leadership in the Passive Optical Network market.
The Ethernet Passive Optical Network (EPON) segment is expected to grow rapidly over the forecast period from 2024 to 2032, driven by its cost-efficiency and ability to support high-speed internet services. EPON is gaining traction in regions like Asia-Pacific, North America, and Europe, where expanding broadband infrastructure and increasing consumer demand for reliable and faster internet connections are contributing to its growth. The rise of smart cities, the adoption of fiber-to-the-home (FTTH) solutions, and the deployment of 5G networks are further fueling the demand for EPON technology. Additionally, the growing need for seamless connectivity in emerging technologies such as IoT, smart homes, and digital services is propelling EPON's adoption. As a result, the EPON market is witnessing substantial growth, positioning it as a key segment in the broader Passive Optical Network (PON) landscape.
By Application
The FTTx (Fiber to the x) segment dominates the Passive Optical Network market, accounting for approximately 69% of the market share in 2023. This dominance is largely driven by the widespread adoption of fiber-to-the-home (FTTH) and fiber-to-the-building (FTTB) solutions, which enable faster and more reliable broadband services to end-users. The growing demand for high-speed internet, particularly in urban and suburban areas, is a key factor driving the expansion of FTTx networks. As consumer preferences shift towards bandwidth-intensive applications such as video streaming, online gaming, and telecommuting, the need for faster and more dependable internet connections has become critical. Governments and telecom operators are investing heavily in FTTx infrastructure to meet these demands, further accelerating the adoption of PON solutions. In markets like North America, Europe, and Asia-Pacific, FTTx deployment is seen as a strategic move to enable future-proof networks capable of supporting emerging technologies such as 5G, IoT, and smart cities.
The Mobile Backhaul segment is expected to be the fastest-growing segment in the Passive Optical Network market from 2024 to 2032. This growth is primarily driven by the increasing demand for high-speed data transmission and the rapid rollout of 5G networks, which require efficient and robust backhaul solutions. PON technology provides an ideal solution for mobile backhaul due to its ability to deliver high bandwidth, low latency, and cost-effective connectivity over long distances. As mobile operators look to optimize their infrastructure to support the increasing volume of data traffic from 5G and future technologies, PON offers scalable solutions for high-speed connections, especially in urban and rural areas. The adoption of Passive Optical Network for mobile backhaul will be key in enabling the next generation of mobile communication systems, making it a crucial driver in the PON market's growth.
Need any customization research on Passive Optical Network (PON) Market - Enquiry Now
Regional Analysis
North America dominates the Passive Optical Network (PON) market, accounting for approximately 40% of the total revenue in 2023. This region's leadership is driven by the high demand for high-speed internet connectivity, the rapid adoption of fiber-to-the-home (FTTH) solutions, and substantial investments in broadband infrastructure by both private companies and government initiatives. The U.S. and Canada are at the forefront, with the U.S. leading the way in deploying next-generation PON technologies, such as GPON and 10G-EPON, to meet the increasing need for faster and more reliable internet services. Additionally, the rollout of 5G networks and smart city projects further accelerates the demand for Passive Optical Network solutions. The availability of skilled labor, advanced technological expertise, and substantial government-backed broadband expansion projects continue to support the region’s dominance in the Passive Optical Network market.
Asia-Pacific is the fastest-growing region in the Passive Optical Network market during the forecast period (2024-2032), driven by rapid infrastructure development and the increasing demand for high-speed internet connectivity. Countries like China, India, Japan, and South Korea are key players in the region's growth. China, in particular, is leading the charge, with massive investments in fiber optic networks and the rapid deployment of FTTH technologies. India is also experiencing significant growth, driven by government initiatives like BharatNet, which aims to provide broadband connectivity to rural and underserved areas. Japan and South Korea have long been pioneers in PON technology, with advanced deployments in smart cities and 5G backhaul infrastructure. The growing demand for high-bandwidth applications such as video streaming, online gaming, and IoT devices is further fueling the need for robust optical networks, making the Asia-Pacific region the fastest-growing market in the global Passive Optical Network landscape.

Key Players
Some of the major players in Passive Optical Network Market along with their Product and offering:
-
Adtran (GPON OLTs, GPON ONTs, Fiber access solutions)
-
Calix, Inc. (XGS-PON systems, Intelligent Access EDGE platform)
-
Huawei Technologies Co., Ltd. (SmartAX series OLTs, GPON ONTs, PON modules)
-
Mitsubishi Electric Corporation (Optical transceivers, WDM-PON modules, EPON modules)
-
ZTE Corporation (ZXMP series OLTs, GPON ONTs, Hybrid PON technologies)
-
Fujitsu (1FINITY platform, WDM-PON OLTs, ONTs)
-
NXP Semiconductors (GPON SoCs, EPON SoCs, PON chipsets)
-
TP-LINK Corporation PTE. LTD. (GPON ONTs, GPON routers, Wi-Fi extenders for fiber networks)
-
Luna Innovations Incorporated (Optical backscatter reflectometers, PON testing tools, Fiber performance monitoring systems)
-
Silixa Ltd. (iDAS (Intelligent Distributed Acoustic Sensing), hDAS (High-Frequency Distributed Acoustic Sensing))
-
Ciena Corporation (6500 Packet-Optical platform, WDM-PON OLTs, Fiber-optic networking systems)
-
Cisco Systems, Inc. (ASR 9000 series routers, GPON OLTs, Next-generation PON technologies)
-
Infinera Corporation (GX series WDM-PON platforms, Scalable optical transport solutions)
-
Nokia Corporation (Quillion chipset, ISAM OLTs, 25G PON solutions)
-
Telefonaktiebolaget LM Ericsson (GPON systems, XGS-PON solutions, Router-based transport for mobile backhaul)
List of Suppliers who provide raw material and component for the Passive Optical Network Market, along with potential customers for their products:
Suppliers of Raw Materials and Components
-
Broadcom Inc.
-
Lumentum Holdings Inc.
-
MACOM Technology Solutions Holdings, Inc.
-
II-VI Incorporated
-
Semtech Corporation
-
NeoPhotonics Corporation
-
Finisar (part of II-VI Incorporated)
-
Applied Optoelectronics, Inc.
-
Sumitomo Electric Industries, Ltd.
-
Oclaro Inc. (part of Lumentum)
Potential Customers
-
Huawei Technologies Co., Ltd.
-
Nokia Corporation
-
ZTE Corporation
-
Ciena Corporation
-
Adtran
-
Calix, Inc.
-
Fujitsu
-
Cisco Systems, Inc.
-
Infinera Corporation
-
TP-Link Corporation
Recent Development
-
December 12, 2024, Adtran and IdeaTek have partnered to deploy Kansas’s first 50G PON network, leveraging Adtran’s SDX 6400 Series OLT to deliver ultra-fast connectivity for rural and underserved communities, supporting applications like IoT, smart farming, and remote healthcare.
-
April 30, 2024 Huawei launched F5G-A products and solutions at the Global Optical Summit in Bangkok, aiming to drive industrial intelligence in Asia Pacific through advanced optical connectivity and sensing technologies.
-
March 20, 2024, Cisco unveiled its Routed PON solution, integrating OLT and routing functions into a compact pluggable form factor, enabling operators to consolidate networks, reduce costs, and enhance latency for PON and Ethernet services.
| Report Attributes | Details |
| Market Size in 2023 | USD 14.44 Billion |
| Market Size by 2032 | USD 49.03 Billion |
| CAGR | CAGR of 14.55% From 2024 to 2032 |
| Base Year | 2023 |
| Forecast Period | 2024-2032 |
| Historical Data | 2020-2022 |
| Report Scope & Coverage | Market Size, Segments Analysis, Competitive Landscape, Regional Analysis, DROC & SWOT Analysis, Forecast Outlook |
| Key Segments | • By Structure (Gigabyte Passive Optical Network (GPON), Ethernet Passive Optical Network (EPON), Wavelength Division Multiplexing Passive Optical Network (WDM-PON)) • By Component(Wavelength Division Multiplexer/De-Multiplexer, Optical Filters, Optical Power Splitters, Optical Cables, Optical Line Terminal (OLT), Optical Network Terminal (ONT)) • By Application(FTTx, Mobile Backhaul) |
| Regional Analysis/Coverage | North America (US, Canada, Mexico), Europe (Eastern Europe [Poland, Romania, Hungary, Turkey, Rest of Eastern Europe] Western Europe] Germany, France, UK, Italy, Spain, Netherlands, Switzerland, Austria, Rest of Western Europe]), Asia Pacific (China, India, Japan, South Korea, Vietnam, Singapore, Australia, Rest of Asia Pacific), Middle East & Africa (Middle East [UAE, Egypt, Saudi Arabia, Qatar, Rest of Middle East], Africa [Nigeria, South Africa, Rest of Africa], Latin America (Brazil, Argentina, Colombia, Rest of Latin America) |
| Company Profiles | Adtran, Calix Inc., Huawei Technologies Co., Ltd., Mitsubishi Electric Corporation, ZTE Corporation, Fujitsu, NXP Semiconductors, TP-LINK Corporation PTE. LTD., Luna Innovations Incorporated, Silixa Ltd., Ciena Corporation, Cisco Systems, Inc., Infinera Corporation, Nokia Corporation, and Telefonaktiebolaget LM Ericsson are key players in the Passive Optical Network (PON) market. |
| Key Drivers | • The global 5G network rollout is driving increased demand for high-speed backhaul solutions, fueling the need for Passive Optical Network technology. |
| Restraints | • Regulatory and licensing hurdles, including complex permits and regional variations, are slowing the adoption of Passive Optical Network (PON) technology. |
