image

Passive Authentication Market Size & Overview:
Passive Authentication Market,Revenue Analysis

Get more information on Passive Authentication Market - Request Sample Report

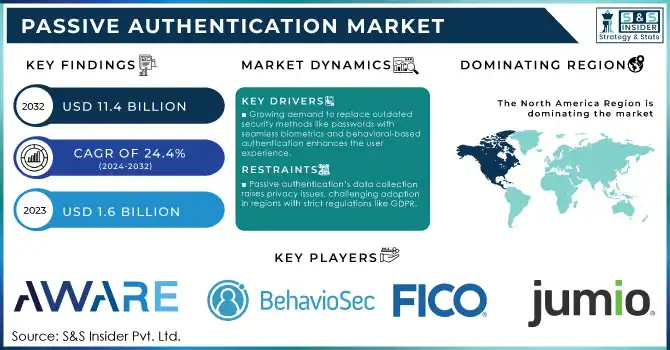
The Passive Authentication Market size was valued at USD 1.6 billion in 2023 and is expected to reach USD 11.4 billion by 2032, growing at a CAGR of 24.4% over the forecast period of 2024-2032.

Growth in the passive authentication market across the globe owing to the rise in cyber threats, identity theft, and fraud including the booming trend of online shopping and selling items. Governments are responding with stronger regulatory frameworks to ensure data security and user privacy, promoting the adoption of passive authentication solutions. With a 13% increase in identity fraud reported by U.S. authorities in 2023, passive authentication solutions have gained considerable traction across banking, healthcare, and government sectors. As both public and private sectors invest more and more heavily, market analysts expect the passive authentication market to keep on growing, driven in particular by pressure from governments for ever-greater data security.

Passive authentication eliminates the need for users to recall complex passwords, improving ease and user experience. These solutions are scalable, cost-effective, and easy to deploy because they are cloud-based, making them ideal for organizations of any size. Cyber threats have been increasing at an immense rate, and organizations now know that they need advanced security measures, so that passive authentication can protect access. Identity verification helps to comply with regulations such as GDPR and CCPA, which require strong user authentication. The use of biometric authentication, where a user is authenticated based on characteristics such as fingerprint, facial recognition, and iris scanning, is also advancing, leading to more reliable passive authentication and prompting its wider adoption. These are anticipated to lead to persistent growth opportunities within the passive authentication market, as technology advances and better solutions are made available.

Passive Authentication Market Dynamics

Drivers

  • Growing demand to replace outdated security methods like passwords with seamless biometrics and behavioral-based authentication enhances the user experience.

  • High-security industries adopt passive authentication to enhance security and meet user demands for smooth, unobtrusive verification.

  • AI-driven behaviour analysis strengthens passive authentication, providing adaptive and continuous security without user interruption.

One of the major drivers for the passive authentication market is the shift away from traditional security methods like passwords and security questions toward more advanced biometrics and behaviour-based systems. With the ever-evolving nature of cyber threats, organizations are quickly realizing that traditional authentication methods, which depend heavily on static passwords that can be easily hacked, have serious shortcomings. The recent report states that more than 80% of data breaches involve brute-force attacks or stolen passwords, which emphasizes the importance of harder-to-crack security options that are not solely dependent on passwords​.

Passive authentication is a highly seamless method of identifying users based on biometric data (facial recognition, fingerprints, and voice analysis) and behavioral analytics (typing speed and mouse movement patterns) without asking the users to do anything. Though not all implementations of AI have succeeded, several examples like HSBC have successfully adopted the technology after implementing voice biometrics in its customer service centers, HSBC secured the identification of customers with a 93% accuracy rate in 30 seconds, improving security and user experience​ ​. In 2023, HSBC replaced its traditional customer support with AI. MasterCard, too, has been implementing fingerprint scans and facial recognition to better authenticate online transactions. Moreover, with 57% of consumers preferring password-less biometric verification as opposed to password authentication, there is an evident user preference for biometric schemes when looking at newer schemes alternative to traditional passwords. This shift is a long time coming, in line with industry trends to provide non-disruptive user-centric security to increase the adoption of passive authentication systems.

Restraints

  • Passive authentication’s data collection raises privacy issues, challenging adoption in regions with strict regulations like GDPR.

  • Initial setup costs, especially for small businesses, can limit the adoption of passive authentication technology.

Privacy & Data Protection are the major restraints for the global passive authentication market to enable passive authentication systems to monitor and analyze user behaviour in real time, these systems must collect large volumes of personal data. This continuous data tracking can raise privacy issues, especially in regions with strict data protection regulations, such as GDPR in Europe. Such regulations mandate that organizations transparently handle and protect user data, often requiring them to obtain explicit consent from users. This also makes passive authentication more difficult to adopt because businesses need to navigate complicated legal requirements around privacy. Even worse, a leak of sensitive behavioural data which would occur in the event of a breach is also a risk that raises fears. To overcome these challenges, organizations should spend heavily on encrypting and anonymizing all the data they are working with so that no personal information itself is stored in its applications, which makes implementation much more complex and costly.

Passive Authentication Market Segment Analysis

By Component

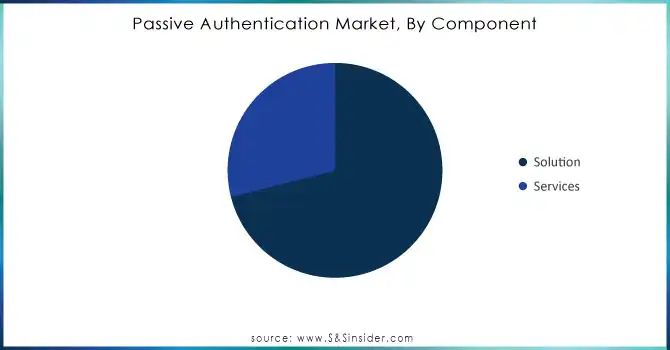
The solution segment held the largest share of 71% of revenue in the passive authentication market in 2023, owing to the ability to authenticate users without the need for active participation passive authentication solutions utilize sophisticated technologies such as biometrics and behavioural analysis to achieve seamless user authentication, making them ideal for highly secure but low user interaction environments. These solutions accommodate strict security protocols preferred by governments so organizations can stay compliant and still respect end-user privacy. In addition, improved AI and machine learning will continue to drive the development and, viability of passive authentication technologies.
Passive-Authentication-Market-By-Component

Need any customization research on Passive Authentication Market - Enquiry Now

By Deployment

The cloud deployment segment held the largest revenue share 60% in 2023 due to the increasing migrations of organizations to the cloud for supporting scalability and remote access. For instance, the U.S. government has promoted cloud migration via initiatives such as FedRAMP (the Federal Risk and Authorization Management Program) which certifies cloud security for federal use. Recent trends in low cost and ease of deployment where the locations are diversified are moving towards the passive authentication which further fuels the cloud segment.

By Function

The compliance management segment accounted for 31% of revenue share as organizations are keen on complying with government regulations to avoid penalties and protect consumer data. One of the key features of passive authentication is that it helps ensure compliance by automatically monitoring and authenticating identities, which is crucial in regulated sectors like finance or healthcare. With the launch of regulations such as GDPR and CCPA the need for passive authentication became critical for businesses to retain compliant operations, thereby fuelling the need for compliance management focused solutions.

Passive Authentication Market Regional Analysis

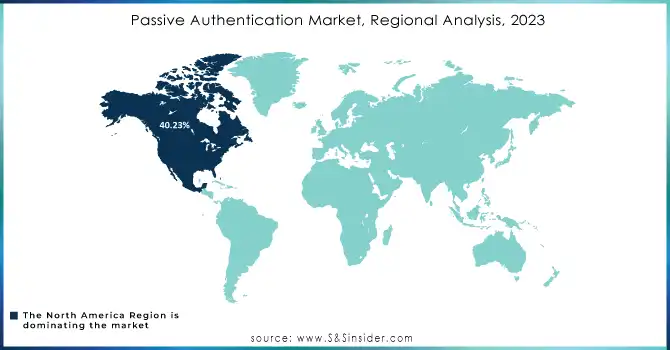
North America dominated the passive authentication market in terms of revenue in 2023, due to the strong government policies associated with cybersecurity and data privacy. This is primarily attributable to the dominance of the United States due to its strong base of technology and financial sectors, which typically focus on passive authentication solutions to protect against unauthorized access & identity theft. Policies like the U.S. Cybersecurity Framework and other federal initiatives aim to bolster digital security across critical industries, creating a fertile environment for the adoption of advanced authentication technologies.

The passive authentication market in the U.S. is projected to grow significantly over the coming years. U.S. consumers prioritize smooth and quick online interactions, especially for services like banking, shopping, and other digital platforms. With passive authentication, people no longer need to memorize complex passwords or have to use MFA every time, so access is instant and easy, improving the user experience considerably. Moreover, mobile wallet adoption is increasing in America and passive authentication works seamlessly with these mobile payment systems to easily and securely process transactions for users. This seamless integration of passive authentication with mobile payment options not only supports security but also meets the demand for a streamlined digital experience in daily financial activities.

Meanwhile, the Asia-Pacific region emerged as the fastest-growing market, driven by high growth rates in countries such as China and India. The increasing volume is driven by investments in digital infrastructure, together with government programs to drive digital adoption both in the public and the private sectors. For example, India’s Digital India initiative and China’s focus on Smart City development have accelerated the adoption of digital services, leading to a higher volume of online transactions and mobile banking. This digital explosion has also resulted in a greater demand for secure, seamless authentication solutions to counterbalance the rising risk of cyber threats and fraud.
Passive-Authentication-Market-Regional-Analysis-2023

Recent Developments in the Passive Authentication Market

  • NEC Corporation of America released NeoFace® Reveal Version 5, the next-generation forensic face recognition technology, in March 2024. It specifically targets government agencies and law enforcement as well as civil applications by organizations as it has introduced this advanced software that is expected to revolutionize criminal investigations and fraud prevention. The NeoFace® Reveal version 5 enhances identity verification accuracy and efficiency enabling authorities to detect fraud and reduce the burden of investigative processes.

Key Players

Service Providers / Manufacturers:

  • Aware Inc. (Biometrics Solutions for Financial Services)

  • BehavioSec (Behavioral Authentication for Financial Institutions)

  • Cisco Systems, Inc. (Network Security and Identity Verification)

  • FICO (Fraud Prevention Solutions for Banks and Retailers)

  • International Business Machines Corporation (IBM) (AI-powered Fraud Detection for Enterprises)

  • Jumio (Identity Verification for E-commerce and Financial Services)

  • NEC Corporation of America (Smart City Authentication Solutions)

  • OneSpan (Digital Identity and Authentication for Banks)

  • Source (Data Security for Digital Transactions)

  • Thales (Data Encryption and Identity Verification for Government and Defense)

Key Users of Passive Authentication Products/Services:

  • JPMorgan Chase

  • HSBC

  • PayPal

  • Uber

  • Walmart

  • Citibank

  • American Express

  • Amazon

  • Microsoft

  • Apple

Passive Authentication Market Report Scope:

Report Attributes Details
Market Size in 2023  USD 1.6 billion
Market Size by 2032  USD 11.4 billion
CAGR  CAGR 24.4% from 2024 to 2032
Base Year  2023
Forecast Period  2024-2032
Historical Data  2020-2022
Report Scope & Coverage Market Size, Segments Analysis, Competitive  Landscape, Regional Analysis, DROC & SWOT Analysis, Forecast Outlook
Key Segments • By Component (Solution, Services)
• By Organization Size (SMEs, Large Enterprises)
• By Function (Compliance Management, Marketing Management, Risk Management, Others)
• By Deployment (Cloud, On-premises)
• By Vertical (BFSI, Government, IT & Telecommunications, Retail and Consumer Goods, Healthcare, Media and Entertainment, Others)
Regional Analysis/Coverage North America (US, Canada, Mexico), Europe (Eastern Europe [Poland, Romania, Hungary, Turkey, Rest of Eastern Europe] Western Europe] Germany, France, UK, Italy, Spain, Netherlands, Switzerland, Austria, Rest of Western Europe]), Asia Pacific (China, India, Japan, South Korea, Vietnam, Singapore, Australia, Rest of Asia Pacific), Middle East & Africa (Middle East [UAE, Egypt, Saudi Arabia, Qatar, Rest of Middle East], Africa [Nigeria, South Africa, Rest of Africa], Latin America (Brazil, Argentina, Colombia, Rest of Latin America)
Company Profiles Aware Inc, BehavioSec, Cisco Systems, Inc., FICO Company, International Business Machines Corporation, Jumio, NEC Corporation of America, OneSpan, Source, Thales
Key Drivers • Growing demand to replace outdated security methods like passwords with seamless biometrics and behavioral-based authentication enhances the user experience.
• High-security industries adopt passive authentication to enhance security and meet user demands for smooth, unobtrusive verification.
• AI-driven behavior analysis strengthens passive authentication, providing adaptive and continuous security without user interruption.
Market Restraints • Passive authentication’s data collection raises privacy issues, challenging adoption in regions with strict regulations like GDPR.
• Initial setup costs, especially for small businesses, can limit the adoption of passive authentication technology.

Frequently Asked Questions

Ans: The Passive Authentication Market is projected to reach USD 11.40 billion by 2032. 
 

Ans: The Passive Authentication Market is expected to grow at a CAGR of 24.4% during the forecast period of 2024-2032.
 

Ans: Some of the major key players in the Passive Authentication Market are Aware Inc, BehavioSec, Cisco Systems, Inc., FICO Company, International Business Machines Corporation, Jumio, NEC Corporation of America, OneSpan, Source, Thales, among others.

Ans: The North American region dominated the Passive Authentication Market in 2023.
 

Ans: The cloud deployment segment dominated the Passive Authentication Market in 2023.
 

Table of Contents:

1. Introduction

1.1 Market Definition

1.2 Scope (Inclusion and Exclusions)

1.3 Research Assumptions

2. Executive Summary

2.1 Market Overview

2.2 Regional Synopsis

2.3 Competitive Summary

3. Research Methodology

3.1 Top-Down Approach

3.2 Bottom-up Approach

3.3. Data Validation

3.4 Primary Interviews

4. Market Dynamics Impact Analysis

4.1 Market Driving Factors Analysis

4.1.1 Drivers

4.1.2 Restraints

4.1.3 Opportunities

4.1.4 Challenges

4.2 PESTLE Analysis

4.3 Porter’s Five Forces Model

5. Statistical Insights and Trends Reporting

5.1 Adoption Rates of Emerging Technologies

5.2 Network Infrastructure Expansion, by Region

5.3 Cybersecurity Incidents, by Region (2020-2023)

5.4 Cloud Services Usage, by Region

6. Competitive Landscape

6.1 List of Major Companies, By Region

6.2 Market Share Analysis, By Region

6.3 Product Benchmarking

6.3.1 Product specifications and features

6.3.2 Pricing

6.4 Strategic Initiatives

6.4.1 Marketing and promotional activities

6.4.2 Distribution and supply chain strategies

6.4.3 Expansion plans and new product launches

6.4.4 Strategic partnerships and collaborations

6.5 Technological Advancements

6.6 Market Positioning and Branding

7. Passive Authentication Market Segmentation, By Component

7.1 Chapter Overview

7.2 Software

7.2.1 Software Market Trends Analysis (2020-2032)

7.2.2 Software Market Size Estimates And Forecasts To 2032 (USD Billion)

7.3 Services

7.3.1 Services Market Trends Analysis (2020-2032)

7.3.2 Services Deposition Market Size Estimates And Forecasts To 2032 (USD Billion)

7.3.3 Managed

7.3.3.1 Managed Market Trends Analysis (2020-2032)

7.3.3.2 Managed Deposition Market Size Estimates And Forecasts To 2032 (USD Billion)

7.3.4 Professional

7.3.4.1 Professional Market Trends Analysis (2020-2032)

7.3.4.2 Professional Deposition Market Size Estimates And Forecasts To 2032 (USD Billion)

8. Passive Authentication Market Segmentation, By Organization Size

8.1 Chapter Overview

8.2 SMEs

8.2.1 SMEs Market Trends Analysis (2020-2032)

8.2.2 SMEs Market Size Estimates And Forecasts To 2032 (USD Billion)

8.3 Large Enterprises

8.3.1 Large Enterprises Market Trends Analysis (2020-2032)

8.3.2 Large Enterprises Market Size Estimates And Forecasts To 2032 (USD Billion)

9. Passive Authentication Market Segmentation, By Deployment

9.1 Chapter Overview

9.2 Cloud

9.2.1 Cloud Market Trends Analysis (2020-2032)

9.2.2 Cloud Market Size Estimates And Forecasts To 2032 (USD Billion)

9.3 On-premises

9.3.1 On-premises Market Trends Analysis (2020-2032)

9.3.2 On-premises Market Size Estimates And Forecasts To 2032 (USD Billion)

10. Passive Authentication Market Segmentation, By Function

10.1 Chapter Overview

10.2 Compliance Management

10.2.1 Compliance Management Market Trends Analysis (2020-2032)

10.2.2 Compliance Management Market Size Estimates And Forecasts To 2032 (USD Billion)

10.3 Marketing Management

10.3.1 Marketing Management Market Trends Analysis (2020-2032)

10.3.2 Marketing Management Market Size Estimates And Forecasts To 2032 (USD Billion)

10.4 Risk Management

10.4.1 Risk Management Market Trends Analysis (2020-2032)

10.4.2 Risk Management Market Size Estimates And Forecasts To 2032 (USD Billion)

10.5 Others

10.5.1 Others Market Trends Analysis (2020-2032)

10.5.2 Others Market Size Estimates And Forecasts To 2032 (USD Billion)

11. Passive Authentication Market Segmentation, By Vertical

11.1 Chapter Overview

11.2 Banking, Financial Services and Insurance (BFSI)

11.2.1 Banking, Financial Services and Insurance (BFSI) Market Trends Analysis (2020-2032)

11.2.2 Banking, Financial Services and Insurance (BFSI) Market Size Estimates And Forecasts To 2032 (USD Billion)

11.3 Retail and consumer goods

11.3.1 Retail and consumer goods Market Trends Analysis (2020-2032)

11.3.2 Retail and consumer goods Market Size Estimates And Forecasts To 2032 (USD Billion)

11.4 IT and Telecommunications

11.4.1 IT and Telecommunications Market Trends Analysis (2020-2032)

11.4.2 IT and Telecommunications Market Size Estimates And Forecasts To 2032 (USD Billion)

11.5 Healthcare

11.5.1 Healthcare Market Trends Analysis (2020-2032)

11.5.2 Healthcare Market Size Estimates And Forecasts To 2032 (USD Billion)

11.6 Government

11.6.1 Government Market Trends Analysis (2020-2032)

11.6.2 Government Market Size Estimates And Forecasts To 2032 (USD Billion)

11.7 Media & Entertainment

11.7.1 Media & Entertainment Market Trends Analysis (2020-2032)

11.7.2 Media & Entertainment Market Size Estimates And Forecasts To 2032 (USD Billion)

11.8 Others

11.8.1 Others Market Trends Analysis (2020-2032)

11.8.2 Others Market Size Estimates And Forecasts To 2032 (USD Billion)

12. Regional Analysis

12.1 Chapter Overview

12.2 North America

12.2.1 Trends Analysis

12.2.2 North America Passive Authentication Market Estimates And Forecasts, By Country (2020-2032) (USD Billion)

12.2.3 North America Passive Authentication Market Estimates And Forecasts, By Component (2020-2032) (USD Billion)

12.2.4 North America Passive Authentication Market Estimates And Forecasts, By Organization Size (2020-2032) (USD Billion)

12.2.5 North America Passive Authentication Market Estimates And Forecasts, By Deployment (2020-2032) (USD Billion)

12.2.6 North America Passive Authentication Market Estimates And Forecasts, By Function (2020-2032) (USD Billion)

12.2.7 North America Passive Authentication Market Estimates And Forecasts, By Vertical (2020-2032) (USD Billion)

12.2.8 USA

12.2.8.1 USA Passive Authentication Market Estimates And Forecasts, By Component (2020-2032) (USD Billion)

12.2.8.2 USA Passive Authentication Market Estimates And Forecasts, By Organization Size (2020-2032) (USD Billion)

12.2.8.3 USA Passive Authentication Market Estimates And Forecasts, By Deployment (2020-2032) (USD Billion)

12.2.8.4 USA Passive Authentication Market Estimates And Forecasts, By Function (2020-2032) (USD Billion)

12.2.8.5 USA Passive Authentication Market Estimates And Forecasts, By Vertical (2020-2032) (USD Billion)

12.2.9 Canada

12.2.9.1 Canada Passive Authentication Market Estimates And Forecasts, By Component (2020-2032) (USD Billion)

12.2.9.2 Canada Passive Authentication Market Estimates And Forecasts, By Organization Size (2020-2032) (USD Billion)

12.2.9.3 Canada Passive Authentication Market Estimates And Forecasts, By Deployment (2020-2032) (USD Billion)

12.2.9.4 Canada Passive Authentication Market Estimates And Forecasts, By Function (2020-2032) (USD Billion)

12.2.9.5 Canada Passive Authentication Market Estimates And Forecasts, By Vertical (2020-2032) (USD Billion)

12.2.10 Mexico

12.2.10.1 Mexico Passive Authentication Market Estimates And Forecasts, By Component (2020-2032) (USD Billion)

12.2.10.2 Mexico Passive Authentication Market Estimates And Forecasts, By Organization Size (2020-2032) (USD Billion)

12.2.10.3 Mexico Passive Authentication Market Estimates And Forecasts, By Deployment (2020-2032) (USD Billion)

12.2.10.4 Mexico Passive Authentication Market Estimates And Forecasts, By Function (2020-2032) (USD Billion)

12.2.10.5 Mexico Passive Authentication Market Estimates And Forecasts, By Vertical (2020-2032) (USD Billion)

12.3 Europe

12.3.1 Eastern Europe

12.3.1.1 Trends Analysis

12.3.1.2 Eastern Europe Passive Authentication Market Estimates And Forecasts, By Country (2020-2032) (USD Billion)

12.3.1.3 Eastern Europe Passive Authentication Market Estimates And Forecasts, By Component (2020-2032) (USD Billion)

12.3.1.4 Eastern Europe Passive Authentication Market Estimates And Forecasts, By Organization Size (2020-2032) (USD Billion)

12.3.1.5 Eastern Europe Passive Authentication Market Estimates And Forecasts, By Deployment (2020-2032) (USD Billion)

12.3.1.6 Eastern Europe Passive Authentication Market Estimates And Forecasts, By Function (2020-2032) (USD Billion)

12.3.1.7 Eastern Europe Passive Authentication Market Estimates And Forecasts, By Vertical (2020-2032) (USD Billion)

12.3.1.8 Poland

12.3.1.8.1 Poland Passive Authentication Market Estimates And Forecasts, By Component (2020-2032) (USD Billion)

12.3.1.8.2 Poland Passive Authentication Market Estimates And Forecasts, By Organization Size (2020-2032) (USD Billion)

12.3.1.8.3 Poland Passive Authentication Market Estimates And Forecasts, By Deployment (2020-2032) (USD Billion)

12.3.1.8.4 Poland Passive Authentication Market Estimates And Forecasts, By Function (2020-2032) (USD Billion)

12.3.1.8.5 Poland Passive Authentication Market Estimates And Forecasts, By Vertical (2020-2032) (USD Billion)

12.3.1.9 Romania

12.3.1.9.1 Romania Passive Authentication Market Estimates And Forecasts, By Component (2020-2032) (USD Billion)

12.3.1.9.2 Romania Passive Authentication Market Estimates And Forecasts, By Organization Size (2020-2032) (USD Billion)

12.3.1.9.3 Romania Passive Authentication Market Estimates And Forecasts, By Deployment (2020-2032) (USD Billion)

12.3.1.9.4 Romania Passive Authentication Market Estimates And Forecasts, By Function (2020-2032) (USD Billion)

12.3.1.9.5 Romania Passive Authentication Market Estimates And Forecasts, By Vertical (2020-2032) (USD Billion)

12.3.1.10 Hungary

12.3.1.10.1 Hungary Passive Authentication Market Estimates And Forecasts, By Component (2020-2032) (USD Billion)

12.3.1.10.2 Hungary Passive Authentication Market Estimates And Forecasts, By Organization Size (2020-2032) (USD Billion)

12.3.1.10.3 Hungary Passive Authentication Market Estimates And Forecasts, By Deployment (2020-2032) (USD Billion)

12.3.1.10.4 Hungary Passive Authentication Market Estimates And Forecasts, By Function (2020-2032) (USD Billion)

12.3.1.10.5 Hungary Passive Authentication Market Estimates And Forecasts, By Vertical (2020-2032) (USD Billion)

12.3.1.11 Turkey

12.3.1.11.1 Turkey Passive Authentication Market Estimates And Forecasts, By Component (2020-2032) (USD Billion)

12.3.1.11.2 Turkey Passive Authentication Market Estimates And Forecasts, By Organization Size (2020-2032) (USD Billion)

12.3.1.11.3 Turkey Passive Authentication Market Estimates And Forecasts, By Deployment (2020-2032) (USD Billion)

12.3.1.11.4 Turkey Passive Authentication Market Estimates And Forecasts, By Function (2020-2032) (USD Billion)

12.3.1.11.5 Turkey Passive Authentication Market Estimates And Forecasts, By Vertical (2020-2032) (USD Billion)

12.3.1.12 Rest Of Eastern Europe

12.3.1.12.1 Rest Of Eastern Europe Passive Authentication Market Estimates And Forecasts, By Component (2020-2032) (USD Billion)

12.3.1.12.2 Rest Of Eastern Europe Passive Authentication Market Estimates And Forecasts, By Organization Size (2020-2032) (USD Billion)

12.3.1.12.3 Rest Of Eastern Europe Passive Authentication Market Estimates And Forecasts, By Deployment (2020-2032) (USD Billion)

12.3.1.12.4 Rest Of Eastern Europe Passive Authentication Market Estimates And Forecasts, By Function (2020-2032) (USD Billion)

12.3.1.12.5 Rest Of Eastern Europe Passive Authentication Market Estimates And Forecasts, By Vertical (2020-2032) (USD Billion)

12.3.2 Western Europe

12.3.2.1 Trends Analysis

12.3.2.2 Western Europe Passive Authentication Market Estimates And Forecasts, By Country (2020-2032) (USD Billion)

12.3.2.3 Western Europe Passive Authentication Market Estimates And Forecasts, By Component (2020-2032) (USD Billion)

12.3.2.4 Western Europe Passive Authentication Market Estimates And Forecasts, By Organization Size (2020-2032) (USD Billion)

12.3.2.5 Western Europe Passive Authentication Market Estimates And Forecasts, By Deployment (2020-2032) (USD Billion)

12.3.2.6 Western Europe Passive Authentication Market Estimates And Forecasts, By Function (2020-2032) (USD Billion)

12.3.2.7 Western Europe Passive Authentication Market Estimates And Forecasts, By Vertical (2020-2032) (USD Billion)

12.3.2.8 Germany

12.3.2.8.1 Germany Passive Authentication Market Estimates And Forecasts, By Component (2020-2032) (USD Billion)

12.3.2.8.2 Germany Passive Authentication Market Estimates And Forecasts, By Organization Size (2020-2032) (USD Billion)

12.3.2.8.3 Germany Passive Authentication Market Estimates And Forecasts, By Deployment (2020-2032) (USD Billion)

12.3.2.8.4 Germany Passive Authentication Market Estimates And Forecasts, By Function (2020-2032) (USD Billion)

12.3.2.8.5 Germany Passive Authentication Market Estimates And Forecasts, By Vertical (2020-2032) (USD Billion)


12.3.2.9 France

12.3.2.9.1 France Passive Authentication Market Estimates And Forecasts, By Component (2020-2032) (USD Billion)

12.3.2.9.2 France Passive Authentication Market Estimates And Forecasts, By Organization Size (2020-2032) (USD Billion)

12.3.2.9.3 France Passive Authentication Market Estimates And Forecasts, By Deployment (2020-2032) (USD Billion)

12.3.2.9.4 France Passive Authentication Market Estimates And Forecasts, By Function (2020-2032) (USD Billion)

12.3.2.9.5 France Passive Authentication Market Estimates And Forecasts, By Vertical (2020-2032) (USD Billion)

12.3.2.10 UK

12.3.2.10.1 UK Passive Authentication Market Estimates And Forecasts, By Component (2020-2032) (USD Billion)

12.3.2.10.2 UK Passive Authentication Market Estimates And Forecasts, By Organization Size (2020-2032) (USD Billion)

12.3.2.10.3 UK Passive Authentication Market Estimates And Forecasts, By Deployment (2020-2032) (USD Billion)

12.3.2.10.4 UK Passive Authentication Market Estimates And Forecasts, By Function (2020-2032) (USD Billion)

12.3.2.10.5 UK Passive Authentication Market Estimates And Forecasts, By Vertical (2020-2032) (USD Billion)

12.3.2.11 Italy

12.3.2.11.1 Italy Passive Authentication Market Estimates And Forecasts, By Component (2020-2032) (USD Billion)

12.3.2.11.2 Italy Passive Authentication Market Estimates And Forecasts, By Organization Size (2020-2032) (USD Billion)

12.3.2.11.3 Italy Passive Authentication Market Estimates And Forecasts, By Deployment (2020-2032) (USD Billion)

12.3.2.11.4 Italy Passive Authentication Market Estimates And Forecasts, By Function (2020-2032) (USD Billion)

12.3.2.11.5 Italy Passive Authentication Market Estimates And Forecasts, By Vertical (2020-2032) (USD Billion)

12.3.2.12 Spain

12.3.2.12.1 Spain Passive Authentication Market Estimates And Forecasts, By Component (2020-2032) (USD Billion)

12.3.2.12.2 Spain Passive Authentication Market Estimates And Forecasts, By Organization Size (2020-2032) (USD Billion)

12.3.2.12.3 Spain Passive Authentication Market Estimates And Forecasts, By Deployment (2020-2032) (USD Billion)

12.3.2.12.4 Spain Passive Authentication Market Estimates And Forecasts, By Function (2020-2032) (USD Billion)

12.3.2.12.5 Spain Passive Authentication Market Estimates And Forecasts, By Vertical (2020-2032) (USD Billion)

12.3.2.13 Netherlands

12.3.2.13.1 Netherlands Passive Authentication Market Estimates And Forecasts, By Component (2020-2032) (USD Billion)

12.3.2.13.2 Netherlands Passive Authentication Market Estimates And Forecasts, By Organization Size (2020-2032) (USD Billion)

12.3.2.13.3 Netherlands Passive Authentication Market Estimates And Forecasts, By Deployment (2020-2032) (USD Billion)

12.3.2.13.4 Netherlands Passive Authentication Market Estimates And Forecasts, By Function (2020-2032) (USD Billion)

12.3.2.13.5 Netherlands Passive Authentication Market Estimates And Forecasts, By Vertical (2020-2032) (USD Billion)

12.3.2.14 Switzerland

12.3.2.14.1 Switzerland Passive Authentication Market Estimates And Forecasts, By Component (2020-2032) (USD Billion)

12.3.2.14.2 Switzerland Passive Authentication Market Estimates And Forecasts, By Organization Size (2020-2032) (USD Billion)

12.3.2.14.3 Switzerland Passive Authentication Market Estimates And Forecasts, By Deployment (2020-2032) (USD Billion)

12.3.2.14.4 Switzerland Passive Authentication Market Estimates And Forecasts, By Function (2020-2032) (USD Billion)

12.3.2.12.5 Switzerland Passive Authentication Market Estimates And Forecasts, By Vertical (2020-2032) (USD Billion)

12.3.2.15 Austria

12.3.2.15.1 Austria Passive Authentication Market Estimates And Forecasts, By Component (2020-2032) (USD Billion)

12.3.2.15.2 Austria Passive Authentication Market Estimates And Forecasts, By Organization Size (2020-2032) (USD Billion)

12.3.2.15.3 Austria Passive Authentication Market Estimates And Forecasts, By Deployment (2020-2032) (USD Billion)

12.3.2.15.4 Austria Passive Authentication Market Estimates And Forecasts, By Function (2020-2032) (USD Billion)

12.3.2.15.5 Austria Passive Authentication Market Estimates And Forecasts, By Vertical (2020-2032) (USD Billion)

12.3.2.16 Rest Of Western Europe

12.3.2.16.1 Rest Of Western Europe Passive Authentication Market Estimates And Forecasts, By Component (2020-2032) (USD Billion)

12.3.2.16.2 Rest Of Western Europe Passive Authentication Market Estimates And Forecasts, By Organization Size (2020-2032) (USD Billion)

12.3.2.16.3 Rest Of Western Europe Passive Authentication Market Estimates And Forecasts, By Deployment (2020-2032) (USD Billion)

12.3.2.16.4 Rest Of Western Europe Passive Authentication Market Estimates And Forecasts, By Function (2020-2032) (USD Billion)

12.3.2.16.5 Rest Of Western Europe Passive Authentication Market Estimates And Forecasts, By Vertical (2020-2032) (USD Billion)

12.4 Asia Pacific

12.4.1 Trends Analysis

12.4.2 Asia Pacific Passive Authentication Market Estimates And Forecasts, By Country (2020-2032) (USD Billion)

12.4.3 Asia Pacific Passive Authentication Market Estimates And Forecasts, By Component (2020-2032) (USD Billion)

12.4.4 Asia Pacific Passive Authentication Market Estimates And Forecasts, By Organization Size (2020-2032) (USD Billion)

12.4.5 Asia Pacific Passive Authentication Market Estimates And Forecasts, By Deployment (2020-2032) (USD Billion)

12.4.6 Asia Pacific Passive Authentication Market Estimates And Forecasts, By Function (2020-2032) (USD Billion)

12.4.7 Asia Pacific Passive Authentication Market Estimates And Forecasts, By Vertical (2020-2032) (USD Billion)

12.4.8 China

12.4.8.1 China Passive Authentication Market Estimates And Forecasts, By Component (2020-2032) (USD Billion)

12.4.8.2 China Passive Authentication Market Estimates And Forecasts, By Organization Size (2020-2032) (USD Billion)

12.4.8.3 China Passive Authentication Market Estimates And Forecasts, By Deployment (2020-2032) (USD Billion)

12.4.8.4 China Passive Authentication Market Estimates And Forecasts, By Function (2020-2032) (USD Billion)

12.4.8.5 China Passive Authentication Market Estimates And Forecasts, By Vertical (2020-2032) (USD Billion)

12.4.9 India

12.4.9.1 India Passive Authentication Market Estimates And Forecasts, By Component (2020-2032) (USD Billion)

12.4.9.2 India Passive Authentication Market Estimates And Forecasts, By Organization Size (2020-2032) (USD Billion)

12.4.9.3 India Passive Authentication Market Estimates And Forecasts, By Deployment (2020-2032) (USD Billion)

12.4.9.4 India Passive Authentication Market Estimates And Forecasts, By Function (2020-2032) (USD Billion)

12.4.9.5 India Passive Authentication Market Estimates And Forecasts, By Vertical (2020-2032) (USD Billion)

12.4.10 Japan

12.4.10.1 Japan Passive Authentication Market Estimates And Forecasts, By Component (2020-2032) (USD Billion)

12.4.10.2 Japan Passive Authentication Market Estimates And Forecasts, By Organization Size (2020-2032) (USD Billion)

12.4.10.3 Japan Passive Authentication Market Estimates And Forecasts, By Deployment (2020-2032) (USD Billion)

12.4.10.4 Japan Passive Authentication Market Estimates And Forecasts, By Function (2020-2032) (USD Billion)

12.4.10.5 Japan Passive Authentication Market Estimates And Forecasts, By Vertical (2020-2032) (USD Billion)

12.4.11 South Korea

12.4.11.1 South Korea Passive Authentication Market Estimates And Forecasts, By Component (2020-2032) (USD Billion)

12.4.11.2 South Korea Passive Authentication Market Estimates And Forecasts, By Organization Size (2020-2032) (USD Billion)

12.4.11.3 South Korea Passive Authentication Market Estimates And Forecasts, By Deployment (2020-2032) (USD Billion)

12.4.11.4 South Korea Passive Authentication Market Estimates And Forecasts, By Function (2020-2032) (USD Billion)

12.4.11.5 South Korea Passive Authentication Market Estimates And Forecasts, By Vertical (2020-2032) (USD Billion)

12.4.12 Vietnam

12.4.12.1 Vietnam Passive Authentication Market Estimates And Forecasts, By Component (2020-2032) (USD Billion)

12.4.12.2 Vietnam Passive Authentication Market Estimates And Forecasts, By Organization Size (2020-2032) (USD Billion)

12.4.12.3 Vietnam Passive Authentication Market Estimates And Forecasts, By Deployment (2020-2032) (USD Billion)

12.4.12.4 Vietnam Passive Authentication Market Estimates And Forecasts, By Function (2020-2032) (USD Billion)

12.4.12.5 Vietnam Passive Authentication Market Estimates And Forecasts, By Vertical (2020-2032) (USD Billion)

12.4.13 Singapore

12.4.13.1 Singapore Passive Authentication Market Estimates And Forecasts, By Component (2020-2032) (USD Billion)

12.4.13.2 Singapore Passive Authentication Market Estimates And Forecasts, By Organization Size (2020-2032) (USD Billion)

12.4.13.3 Singapore Passive Authentication Market Estimates And Forecasts, By Deployment (2020-2032) (USD Billion)

12.4.13.4 Singapore Passive Authentication Market Estimates And Forecasts, By Function (2020-2032) (USD Billion)

12.4.13.5 Singapore Passive Authentication Market Estimates And Forecasts, By Vertical (2020-2032) (USD Billion)

12.4.14 Australia

12.4.14.1 Australia Passive Authentication Market Estimates And Forecasts, By Component (2020-2032) (USD Billion)

12.4.14.2 Australia Passive Authentication Market Estimates And Forecasts, By Organization Size (2020-2032) (USD Billion)

12.4.14.3 Australia Passive Authentication Market Estimates And Forecasts, By Deployment (2020-2032) (USD Billion)

12.4.14.4 Australia Passive Authentication Market Estimates And Forecasts, By Function (2020-2032) (USD Billion)

12.4.14.5 Australia Passive Authentication Market Estimates And Forecasts, By Vertical (2020-2032) (USD Billion)

12.4.15 Rest Of Asia Pacific

12.4.15.1 Rest Of Asia Pacific Passive Authentication Market Estimates And Forecasts, By Component (2020-2032) (USD Billion)

12.4.15.2 Rest Of Asia Pacific Passive Authentication Market Estimates And Forecasts, By Organization Size (2020-2032) (USD Billion)

12.4.15.3 Rest Of Asia Pacific Passive Authentication Market Estimates And Forecasts, By Deployment (2020-2032) (USD Billion)

12.4.15.4 Rest Of Asia Pacific Passive Authentication Market Estimates And Forecasts, By Function (2020-2032) (USD Billion)

12.4.15.5 Rest Of Asia Pacific Passive Authentication Market Estimates And Forecasts, By Vertical (2020-2032) (USD Billion)

12.5 Middle East And Africa

12.5.1 Middle East

12.5.1.1 Trends Analysis

12.5.1.2 Middle East Passive Authentication Market Estimates And Forecasts, By Country (2020-2032) (USD Billion)

12.5.1.3 Middle East Passive Authentication Market Estimates And Forecasts, By Component (2020-2032) (USD Billion)

12.5.1.4 Middle East Passive Authentication Market Estimates And Forecasts, By Organization Size (2020-2032) (USD Billion)

12.5.1.5 Middle East Passive Authentication Market Estimates And Forecasts, By Deployment (2020-2032) (USD Billion)

12.5.1.6 Middle East Passive Authentication Market Estimates And Forecasts, By Function (2020-2032) (USD Billion)

12.5.1.7 Middle East Passive Authentication Market Estimates And Forecasts, By Vertical (2020-2032) (USD Billion)

12.5.1.8 UAE

12.5.1.8.1 UAE Passive Authentication Market Estimates And Forecasts, By Component (2020-2032) (USD Billion)

12.5.1.8.2 UAE Passive Authentication Market Estimates And Forecasts, By Organization Size (2020-2032) (USD Billion)

12.5.1.8.3 UAE Passive Authentication Market Estimates And Forecasts, By Deployment (2020-2032) (USD Billion)

12.5.1.8.4 UAE Passive Authentication Market Estimates And Forecasts, By Function (2020-2032) (USD Billion)

12.5.1.8.5 UAE Passive Authentication Market Estimates And Forecasts, By Vertical (2020-2032) (USD Billion)

12.5.1.9 Egypt

12.5.1.9.1 Egypt Passive Authentication Market Estimates And Forecasts, By Component (2020-2032) (USD Billion)

12.5.1.9.2 Egypt Passive Authentication Market Estimates And Forecasts, By Organization Size (2020-2032) (USD Billion)

12.5.1.9.3 Egypt Passive Authentication Market Estimates And Forecasts, By Deployment (2020-2032) (USD Billion)

12.5.1.9.4 Egypt Passive Authentication Market Estimates And Forecasts, By Function (2020-2032) (USD Billion)

12.5.1.9.5 Egypt Passive Authentication Market Estimates And Forecasts, By Vertical (2020-2032) (USD Billion)

12.5.1.10 Saudi Arabia

12.5.1.10.1 Saudi Arabia Passive Authentication Market Estimates And Forecasts, By Component (2020-2032) (USD Billion)

12.5.1.10.2 Saudi Arabia Passive Authentication Market Estimates And Forecasts, By Organization Size (2020-2032) (USD Billion)

12.5.1.10.3 Saudi Arabia Passive Authentication Market Estimates And Forecasts, By Deployment (2020-2032) (USD Billion)

12.5.1.10.4 Saudi Arabia Passive Authentication Market Estimates And Forecasts, By Function (2020-2032) (USD Billion)

12.5.1.10.5 Saudi Arabia Passive Authentication Market Estimates And Forecasts, By Vertical (2020-2032) (USD Billion)

12.5.1.11 Qatar

12.5.1.11.1 Qatar Passive Authentication Market Estimates And Forecasts, By Component (2020-2032) (USD Billion)

12.5.1.11.2 Qatar Passive Authentication Market Estimates And Forecasts, By Organization Size (2020-2032) (USD Billion)

12.5.1.11.3 Qatar Passive Authentication Market Estimates And Forecasts, By Deployment (2020-2032) (USD Billion)

12.5.1.11.4 Qatar Passive Authentication Market Estimates And Forecasts, By Function (2020-2032) (USD Billion)

12.5.1.11.5 Qatar Passive Authentication Market Estimates And Forecasts, By Vertical (2020-2032) (USD Billion)

12.5.1.12 Rest Of Middle East

12.5.1.12.1 Rest Of Middle East Passive Authentication Market Estimates And Forecasts, By Component (2020-2032) (USD Billion)

12.5.1.12.2 Rest Of Middle East Passive Authentication Market Estimates And Forecasts, By Organization Size (2020-2032) (USD Billion)

12.5.1.12.3 Rest Of Middle East Passive Authentication Market Estimates And Forecasts, By Deployment (2020-2032) (USD Billion)

12.5.1.12.4 Rest Of Middle East Passive Authentication Market Estimates And Forecasts, By Function (2020-2032) (USD Billion)

12.5.1.12.5 Rest Of Middle East Passive Authentication Market Estimates And Forecasts, By Vertical (2020-2032) (USD Billion)

12.5.2 Africa

12.5.2.1 Trends Analysis

12.5.2.2 Africa Passive Authentication Market Estimates And Forecasts, By Country (2020-2032) (USD Billion)

12.5.2.3 Africa Passive Authentication Market Estimates And Forecasts, By Component (2020-2032) (USD Billion)

12.5.2.4 Africa Passive Authentication Market Estimates And Forecasts, By Organization Size (2020-2032) (USD Billion)

12.5.2.5 Africa Passive Authentication Market Estimates And Forecasts, By Deployment (2020-2032) (USD Billion)

12.5.2.6 Africa Passive Authentication Market Estimates And Forecasts, By Function (2020-2032) (USD Billion)

12.5.2.7 Africa Passive Authentication Market Estimates And Forecasts, By Vertical (2020-2032) (USD Billion)

12.5.2.8 South Africa

12.5.2.8.1 South Africa Passive Authentication Market Estimates And Forecasts, By Component (2020-2032) (USD Billion)

12.5.2.8.2 South Africa Passive Authentication Market Estimates And Forecasts, By Organization Size (2020-2032) (USD Billion)

12.5.2.8.3 South Africa Passive Authentication Market Estimates And Forecasts, By Deployment (2020-2032) (USD Billion)

12.5.2.8.4 South Africa Passive Authentication Market Estimates And Forecasts, By Function (2020-2032) (USD Billion)

12.5.2.8.5 South Africa Passive Authentication Market Estimates And Forecasts, By Vertical (2020-2032) (USD Billion)

12.5.2.9 Nigeria

12.5.2.9.1 Nigeria Passive Authentication Market Estimates And Forecasts, By Component (2020-2032) (USD Billion)

12.5.2.9.2 Nigeria Passive Authentication Market Estimates And Forecasts, By Organization Size (2020-2032) (USD Billion)

12.5.2.9.3 Nigeria Passive Authentication Market Estimates And Forecasts, By Deployment (2020-2032) (USD Billion)

12.5.2.9.4 Nigeria Passive Authentication Market Estimates And Forecasts, By Function (2020-2032) (USD Billion)

12.5.2.9.5 Nigeria Passive Authentication Market Estimates And Forecasts, By Vertical (2020-2032) (USD Billion)

12.5.2.10 Rest Of Africa

12.5.2.10.1 Rest Of Africa Passive Authentication Market Estimates And Forecasts, By Component (2020-2032) (USD Billion)

12.5.2.10.2 Rest Of Africa Passive Authentication Market Estimates And Forecasts, By Organization Size (2020-2032) (USD Billion)

12.5.2.10.3 Rest Of Africa Passive Authentication Market Estimates And Forecasts, By Deployment (2020-2032) (USD Billion)

12.5.2.10.4 Rest Of Africa Passive Authentication Market Estimates And Forecasts, By Function (2020-2032) (USD Billion)

12.5.2.10.5 Rest Of Africa Passive Authentication Market Estimates And Forecasts, By Vertical (2020-2032) (USD Billion)

12.6 Latin America

12.6.1 Trends Analysis

12.6.2 Latin America Passive Authentication Market Estimates And Forecasts, By Country (2020-2032) (USD Billion)

12.6.3 Latin America Passive Authentication Market Estimates And Forecasts, By Component (2020-2032) (USD Billion)

12.6.4 Latin America Passive Authentication Market Estimates And Forecasts, By Organization Size (2020-2032) (USD Billion)

12.6.5 Latin America Passive Authentication Market Estimates And Forecasts, By Deployment (2020-2032) (USD Billion)

12.6.6 Latin America Passive Authentication Market Estimates And Forecasts, By Function (2020-2032) (USD Billion)

12.6.7 Latin America Passive Authentication Market Estimates And Forecasts, By Vertical (2020-2032) (USD Billion)

12.6.8 Brazil

12.6.8.1 Brazil Passive Authentication Market Estimates And Forecasts, By Component (2020-2032) (USD Billion)

12.6.8.2 Brazil Passive Authentication Market Estimates And Forecasts, By Organization Size (2020-2032) (USD Billion)

12.6.8.3 Brazil Passive Authentication Market Estimates And Forecasts, By Deployment (2020-2032) (USD Billion)

12.6.8.4 Brazil Passive Authentication Market Estimates And Forecasts, By Function (2020-2032) (USD Billion)

12.6.8.5 Brazil Passive Authentication Market Estimates And Forecasts, By Vertical (2020-2032) (USD Billion)

12.6.9 Argentina

12.6.9.1 Argentina Passive Authentication Market Estimates And Forecasts, By Component (2020-2032) (USD Billion)

12.6.9.2 Argentina Passive Authentication Market Estimates And Forecasts, By Organization Size (2020-2032) (USD Billion)

12.6.9.3 Argentina Passive Authentication Market Estimates And Forecasts, By Deployment (2020-2032) (USD Billion)

12.6.9.4 Argentina Passive Authentication Market Estimates And Forecasts, By Function (2020-2032) (USD Billion)

12.6.9.5 Argentina Passive Authentication Market Estimates And Forecasts, By Vertical (2020-2032) (USD Billion)

12.6.10 Colombia

12.6.10.1 Colombia Passive Authentication Market Estimates And Forecasts, By Component (2020-2032) (USD Billion)

12.6.10.2 Colombia Passive Authentication Market Estimates And Forecasts, By Organization Size (2020-2032) (USD Billion)

12.6.10.3 Colombia Passive Authentication Market Estimates And Forecasts, By Deployment (2020-2032) (USD Billion)

12.6.10.4 Colombia Passive Authentication Market Estimates And Forecasts, By Function (2020-2032) (USD Billion)

12.6.10.5 Colombia Passive Authentication Market Estimates And Forecasts, By Vertical (2020-2032) (USD Billion)

12.6.11 Rest Of Latin America

12.6.11.1 Rest Of Latin America Passive Authentication Market Estimates And Forecasts, By Component (2020-2032) (USD Billion)

12.6.11.2 Rest Of Latin America Passive Authentication Market Estimates And Forecasts, By Organization Size (2020-2032) (USD Billion)

12.6.11.3 Rest Of Latin America Passive Authentication Market Estimates And Forecasts, By Deployment (2020-2032) (USD Billion)

12.6.11.4 Rest Of Latin America Passive Authentication Market Estimates And Forecasts, By Function (2020-2032) (USD Billion)

12.6.11.5 Rest Of Latin America Passive Authentication Market Estimates And Forecasts, By Vertical (2020-2032) (USD Billion)

13. Company Profiles

13.1 Aware Inc.

13.1.1 Company Overview

13.1.2 Financial

13.1.3 Products/ Services Offered

13.1.4 SWOT Analysis

13.2 BehavioSec

13.2.1 Company Overview

13.2.2 Financial

13.2.3 Products/ Services Offered

13.2.4 SWOT Analysis

13.3 Cisco Systems, Inc.

13.3.1 Company Overview

13.3.2 Financial

13.3.3 Products/ Services Offered

13.3.4 SWOT Analysis

13.4 FICO Company

13.4.1 Company Overview

13.4.2 Financial

13.4.3 Products/ Services Offered

13.4.4 SWOT Analysis

13.5 International Business Machines Corporation

13.5.1 Company Overview

13.5.2 Financial

13.5.3 Products/ Services Offered

13.5.4 SWOT Analysis

13.6  Jumio

13.6.1 Company Overview

13.6.2 Financial

13.6.3 Products/ Services Offered

13.6.4 SWOT Analysis

13.7 NEC Corporation of America

13.7.1 Company Overview

13.7.2 Financial

13.7.3 Products/ Services Offered

13.7.4 SWOT Analysis

13.8 OneSpan

13.8.1 Company Overview

13.8.2 Financial

13.8.3 Products/ Services Offered

13.8.4 SWOT Analysis

13.9 Source

13.9.1 Company Overview

13.9.2 Financial

13.9.3 Products/ Services Offered

13.9.4 SWOT Analysis

13.10 Thales

13.12.1 Company Overview

13.12.2 Financial

13.12.3 Products/ Services Offered

13.12.4 SWOT Analysis

14. Use Cases and Best Practices

15. Conclusion

An accurate research report requires proper strategizing as well as implementation. There are multiple factors involved in the completion of good and accurate research report and selecting the best methodology to compete the research is the toughest part. Since the research reports we provide play a crucial role in any company’s decision-making process, therefore we at SNS Insider always believe that we should choose the best method which gives us results closer to reality. This allows us to reach at a stage wherein we can provide our clients best and accurate investment to output ratio.

Each report that we prepare takes a timeframe of 350-400 business hours for production. Starting from the selection of titles through a couple of in-depth brain storming session to the final QC process before uploading our titles on our website we dedicate around 350 working hours. The titles are selected based on their current market cap and the foreseen CAGR and growth.


The 5 steps process:

Step 1: Secondary Research:

Secondary Research or Desk Research is as the name suggests is a research process wherein, we collect data through the readily available information. In this process we use various paid and unpaid databases which our team has access to and gather data through the same. This includes examining of listed companies’ annual reports, Journals, SEC filling etc. Apart from this our team has access to various associations across the globe across different industries. Lastly, we have exchange relationships with various university as well as individual libraries.

Secondary Research

Step 2: Primary Research

When we talk about primary research, it is a type of study in which the researchers collect relevant data samples directly, rather than relying on previously collected data.  This type of research is focused on gaining content specific facts that can be sued to solve specific problems. Since the collected data is fresh and first hand therefore it makes the study more accurate and genuine.

We at SNS Insider have divided Primary Research into 2 parts.

Part 1 wherein we interview the KOLs of major players as well as the upcoming ones across various geographic regions. This allows us to have their view over the market scenario and acts as an important tool to come closer to the accurate market numbers. As many as 45 paid and unpaid primary interviews are taken from both the demand and supply side of the industry to make sure we land at an accurate judgement and analysis of the market.

This step involves the triangulation of data wherein our team analyses the interview transcripts, online survey responses and observation of on filed participants. The below mentioned chart should give a better understanding of the part 1 of the primary interview.

Primary Research

Part 2: In this part of primary research the data collected via secondary research and the part 1 of the primary research is validated with the interviews from individual consultants and subject matter experts.

Consultants are those set of people who have at least 12 years of experience and expertise within the industry whereas Subject Matter Experts are those with at least 15 years of experience behind their back within the same space. The data with the help of two main processes i.e., FGDs (Focused Group Discussions) and IDs (Individual Discussions). This gives us a 3rd party nonbiased primary view of the market scenario making it a more dependable one while collation of the data pointers.

Step 3: Data Bank Validation

Once all the information is collected via primary and secondary sources, we run that information for data validation. At our intelligence centre our research heads track a lot of information related to the market which includes the quarterly reports, the daily stock prices, and other relevant information. Our data bank server gets updated every fortnight and that is how the information which we collected using our primary and secondary information is revalidated in real time.

Data Bank Validation

Step 4: QA/QC Process

After all the data collection and validation our team does a final level of quality check and quality assurance to get rid of any unwanted or undesired mistakes. This might include but not limited to getting rid of the any typos, duplication of numbers or missing of any important information. The people involved in this process include technical content writers, research heads and graphics people. Once this process is completed the title gets uploader on our platform for our clients to read it.

Step 5: Final QC/QA Process:

This is the last process and comes when the client has ordered the study. In this process a final QA/QC is done before the study is emailed to the client. Since we believe in giving our clients a good experience of our research studies, therefore, to make sure that we do not lack at our end in any way humanly possible we do a final round of quality check and then dispatch the study to the client.

Key Segments:

By Component

  • Solution
  • Services
    • Professional
    • Managed

By Organization Size

  • SMEs
  • Large Enterprises

By Function

  • Compliance Management
  • Marketing Management
  • Risk Management
  • Others

By Deployment

  • Cloud
  • On-premises

By Vertical

  • BFSI
  • Government
  • IT & Telecommunications
  • Retail and consumer goods
  • Healthcare
  • Media and Entertainment
  • Others

Request for Segment Customization as per your Business Requirement: Segment Customization Request

REGIONAL COVERAGE:

North America

  • US
  • Canada
  • Mexico

Europe

  • Eastern Europe
    • Poland
    • Romania
    • Hungary
    • Turkey
    • Rest of Eastern Europe
  • Western Europe
    • Germany
    • France
    • UK
    • Italy
    • Spain
    • Netherlands
    • Switzerland
    • Austria
    • Rest of Western Europe

Asia Pacific

  • China
  • India
  • Japan
  • South Korea
  • Vietnam
  • Singapore
  • Australia
  • Rest of Asia Pacific

Middle East & Africa

  • Middle East
    • UAE
    • Egypt
    • Saudi Arabia
    • Qatar
    • Rest of the Middle East
  • Africa
    • Nigeria
    • South Africa
    • Rest of Africa

Latin America

  • Brazil
  • Argentina
  • Colombia
  • Rest of Latin America

Request for Country Level Research Report: Country Level Customization Request

Available Customization

With the given market data, SNS Insider offers customization as per the company’s specific needs. The following customization options are available for the report:

  • Product Analysis
  • Criss-Cross segment analysis (e.g. Product X Application)
  • Product Matrix which gives a detailed comparison of product portfolio of each company
  • Geographic Analysis
  • Additional countries in any of the regions
  • Company Information
  • Detailed analysis and profiling of additional market players (Up to five)

  •            5000 (33% Discount)


  •            8950 (40% Discount)


  •            3050 (23% Discount)

Start a Conversation

Hi! Click one of our member below to chat on Phone