image

Passive and Interconnecting Electronic Components Market Report Scope & Overview:

Passive-and-Interconnecting-Electronic-Components-Market Revenue Analysis

Get More Information on Passive and Interconnecting Electronic Components Market - Request Sample Report

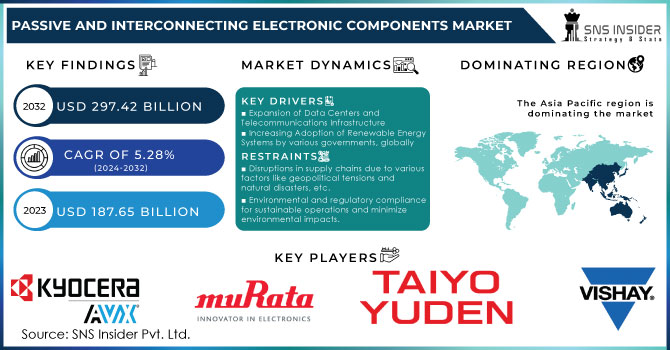
The Passive and Interconnecting Electronic Components Market Size was valued at USD 187.65 billion in 2023 and is expected to reach USD 297.42 billion by 2032 and grow at a CAGR of 5.28% over the forecast period 2024-2032.

The passive and interconnecting electronic components market growth is triggered by the rapid pace of technology evolutions, miniaturization of electronic equipment, and development & deployment of IoT and AI. The demand for smart homes and intelligent devices increases, implying that the components that ensure the work of the smart devices should be extremely reliable and durable. Smart homes reached around USD 140 billion in 2023, and the market's prevalence is largely due to the indispensable nature of these components in a wide array of electronic devices and systems. According to IBEF, the Indian appliance and consumer electronics market reached USD 10.93 billion in 2019. The appliances and consumer electronics industry is expected to double to reach USD 21.18 billion by 2025.

The automotive industry's shift towards electric vehicles (EVs) and advanced driver-assistance systems (ADAS) has created substantial opportunities. EVs require efficient power management systems, which in turn drive the need for passive components like capacitors and inductors. For instance, Vishay Intertechnology recently introduced a new series of high-voltage capacitors designed for automotive and industrial applications, enhancing its product portfolio in the Passive and Interconnecting Electronic Components Market. According to the Governor’s Highway Safety Association, to recover the initial investment, over 95% of all new models sold would have to feature at least one ADAS. Currently, over 90% of vehicles on sale in the U.S. offer at least one advanced system, and there is a commitment to making Automatic Emergency Braking standard by 2022.

Market Dynamics

Drivers

  • Expansion of Data Centers and Telecommunications Infrastructure

The global expansion of cloud computing, data storage, and high-speed internet services industries has led to the development of many data centers worldwide. These facilities require a wide range of electronic components to ensure fast and efficient operation in terms of data processing, storage, and transmission. Passive components in power supply units UPS are easily applicable in control cabinets for power supply. These components include supercapacitors, ceramic and aluminum electrolytic capacitors, transformers, chokes or inductors, resistors, and varistors.

Due to the nature and efficient high-speed operation, 5G technology requires high-frequency passive and interconnecting components and connectors with significantly higher data rates as well as reduced signal travel times. In addition, the growing use of edge computing and IoT technology ensures that overall operations and maintenance networking solutions are decentralized, which is likely to increase the need for passive and interconnecting components on the world market.

  • Increasing Adoption of Renewable Energy Systems by various governments, globally

Solar power, wind power, and other renewable energy sources require passive and interconnecting components for power conversion and energy storage. Capacitors, resistors, inductors, and connectors are among the necessary components used in renewable sources to facilitate power usage and energy authentication. In solar power, the components are used for the photovoltaic inverter, battery management, and power optimizers. For wind power, the components are used in various parts of a wind turbine, for instance, power generation and control; communication in the machine is facilitated by connectors, and various control systems also use the unique components.

Integration of renewable energy into the grid is also one factor that enhances the need for advanced passive and interconnecting components to help in achieving grid power flow, voltage control, and grid stability. Furthermore, renewable energy is the trend globally, with countries aiming to switch to sustainable energy and reduction of carbonizing energy. This has led to investment in the passive and interconnecting electronic components market as new opportunities are available from the number of new renewable energy projects raised by governments and private facilitates.

Restraints

  • Disruptions in supply chains due to various factors like geopolitical tensions and natural disasters, etc.

The global supply chain for electronic components is complex and consists of several stages that include raw material extraction, component manufacturing, assembling the end product, and distributing it to the final customers. Thus, any problem at any stage of the supply chain might affect the availability and the pricing of components. For example, the most recent COVID-19 pandemic revealed the weakness of global supply chains and caused issues with component availability and the delay of many end products. The outcome of these disruptions causes longer lead time for the components, higher prices, and lower availability for the whole industry.

  • Environmental and regulatory compliance for sustainable operations and minimize environmental impacts.

There are very serious environmental aspects to the production and disposal of electronic components, as a result, regulatory bodies are focusing more and more on complying with these standards. New regulations and governmental bodies are constantly emerging to reduce or eliminate the impact that electronic components leave on the environment, these can be quite complex and difficult to comply with. An example of such a regulation could be the restriction of hazardous substances as a result of this regulation being enforced in the European Union manufacturers would need to find alternatives to hazardous materials while also redesigning their manufacturing processes which can cost a lot of financial resources, in addition, some producers may find it difficult to comply with these standards, which can result in an interruption of the supply chain.

Market Segmentation

By Components

The interconnecting segment held the largest revenue share of 55.0% in 2023. The segment’s growth is credited to the need for a reliable and secure method of connecting different electronic components in an electronic circuit. Connectors allow manufacturers to easily assemble, repair, or upgrade various components of an electronic system. As such, their versatility is critical in the modern technologically advancing world where adaptability decreases costs and shortens the time to market for new products.

The passive segment captured the fastest CAGR during the forecast period 2024-2032. The growth of the segment is probably due to the growing advancements and invention of smaller passive electronic components that can fit in small electronic devices.
 

By Application

The consumer electronics segment occupied a market share of 35.0% in 2023. The dominance of the market rise is primarily attributed to the rising growth of consumer electronic devices, such as smartphones and home appliances. Moreover, the increase in the segment is driven by the advent of smart devices.

The automotive segment is expected to experience the fastest CAGR during the forecast period 2024-2032. The rise is owed to various factors, including vehicle electrification, rising sales of ADAS technologies, and increasing integration of connected car technologies in vehicles. For Example, Murata Manufacturing Co., Ltd., launched a new series of compact-type high-capacitance multilayer ceramic capacitors with enhanced reliability for the automotive industry.

Passive-and-Interconnecting-Electronic-Components-by-application

Need any customization research on Passive and Interconnecting Electronic Components Market - Enquiry Now

Regional Analysis

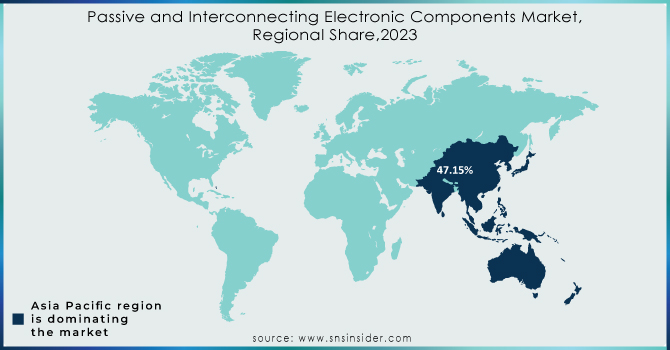
Asia Pacific, the dominating region, captured a market share revenue of 47.15% in 2023. The growth of the electronics manufacturing base and technical advancements of 5G technology boost the market in the region. There is a wide range of electronic products manufacturing and exporting companies in the region, which significantly raises the target market’s growth rate. China is a worldwide leader in the manufacturing of electronic components. Although a wide range of the industry’s companies document-producing large firms already exists, the market growth in the country is tremendously driven by the well-developed base of electronics manufacturing.

The North American market is expected to grow at a CAGR of 5.68% from 2024 to 2032. The growth of the market in the region is largely attributed to the rising demand for advanced technologies as well as increasing industrial automation. The U.S. and Canadian governments and businesses invest in such technological advancements as AI, IoT, etc. These technologies require a wide range of passive and interconnecting electronic components as well as increasing industrial automation, which significantly boosts the target market’s growth rate. The anticipated rise of the 5G network infrastructure significantly boosts the market demand for new installation of networks and telecom devices.

Passive-and-Interconnecting-Electronic-Components-Market by Region

Key Players

The key players in the Passive and Interconnecting Electronic Components market are Kyocera AVX Corporation, Vishay Intertechnology Inc., Murata Manufacturing Co., TDK Corporation, Taiyo Yuden Ltd, TE Connectivity, Samsung Electro-mechanics, Hosiden Corporation, Yageo Group, Nichicon Corporation, Fenghua Electronics Ltd., ROHM Co. Ltd., Molex, Samtec, Amphenol Corp, Panasonic Corporation, Fujitsu, Hon Hai Precision, Hirose Electric Co. Ltd, Mouser Electronics, & Other Players.

Recent Development

  • In February 2024, the TDK company released the MHQ1005075HA series of inductors for an automotive high-frequency circuit. An inductor is made with a fail-safe structure designated for a 1005 size format 1.0 x 0.5 x 0.7 mm and varies an inductor from 1.0 nH to 56 nH. The line of inductors was adapted to improve the systems of cars and their reliability.

  • In November 2023, the Finolex Cables company presented to its current line business LAN cable passives. The release reflected not in cables but in LAN passive components: patch cords, information outlets, patch cards, and faceplates were introduced. The line was produced for the data center, IT network, conference room, and branch office. The new line was introduced to increase connectivity.

Passive and Interconnecting Electronic Components Market Scope

Report Attributes

Details

Market Size in 2023

USD 187.65 billion

Market Size by 2032

USD 297.42 Billion

CAGR

CAGR of 5.28% From 2024 to 2032

Base Year

2023

Forecast Period

2024-2032

Historical Data

2020-2022

Report Scope & Coverage

Market Size, Segments Analysis, Competitive  Landscape, Regional Analysis, DROC & SWOT Analysis, Forecast Outlook

Key Segments

• By Components (Passive, Interconnecting)
• By Application (Consumer Electronics, IT & Telecommunication, Automotive, Industrial, Healthcare, Others)

Regional Analysis/Coverage

North America (US, Canada, Mexico), Europe (Eastern Europe [Poland, Romania, Hungary, Turkey, Rest of Eastern Europe] Western Europe] Germany, France, UK, Italy, Spain, Netherlands, Switzerland, Austria, Rest of Western Europe]), Asia Pacific (China, India, Japan, South Korea, Vietnam, Singapore, Australia, Rest of Asia Pacific), Middle East & Africa (Middle East [UAE, Egypt, Saudi Arabia, Qatar, Rest of Middle East], Africa [Nigeria, South Africa, Rest of Africa], Latin America (Brazil, Argentina, Colombia, Rest of Latin America)

Company Profiles

Kyocera AVX Corporation, Vishay Intertechnology Inc., Murata Manufacturing Co., TDK Corporation, Taiyo Yuden Ltd, TE Connectivity, Samsung Electro-mechanics, Hosiden Corporation, Yageo Group, Nichicon Corporation, Fenghua Electronics Ltd., ROHM Co. Ltd., Molex, Samtec, Amphenol Corp, Panasonic Corporation, Fujitsu, Hon Hai Precision, Hirose Electric Co. Ltd, Mouser Electronics

Key Drivers

• Expansion of Data Centers and Telecommunications Infrastructure
• Increasing Adoption of Renewable Energy Systems by various governments, globally

RESTRAINTS

• Disruptions in supply chains due to various factors like geopolitical tensions and natural disasters, etc.
• Environmental and regulatory compliance for sustainable operations and minimize environmental impacts.

Frequently Asked Questions

Ans:  The Passive and Interconnecting Electronic Components Market is expected to grow at a CAGR of 5.28%.

Ans: The Passive and Interconnecting Electronic Components Market size was USD 187.65 billion in 2023 and is expected to Reach USD 297.42 billion by 2032.

Ans: The rise in data centers and the telecommunication industry drives the Passive and Interconnecting Electronic Components Market.

Ans: The consumer electronics segment by application is dominating the Passive and Interconnecting Electronic Components Market.

Ans: Asia Pacific dominates the Passive and Interconnecting Electronic Components Market in 2023.

Table of Contents

1. Introduction

1.1 Market Definition

1.2 Scope

1.3 Research Assumptions

2. Industry Flowchart

3. Research Methodology

4. Market Dynamics

4.1 Drivers

4.2 Restraints

4.3 Opportunities

4.4 Challenges

5. Porter’s 5 Forces Model

6.  Pest Analysis

7. Passive and Interconnecting Electronic Components Market Segmentation, By Components

7.1 Introduction

7.2 Passive

7.3 Interconnecting

8. Passive and Interconnecting Electronic Components Market Segmentation, By Application

8.1 Introduction

8.2 Consumer Electronics

8.3 IT & Telecommunication

8.4 Automotive

8.5 Industrial

8.6 Healthcare

8.7 Others

9. Regional Analysis

9.1 Introduction

9.2 North America

9.2.1 Trend Analysis

9.2.2 North America Passive and Interconnecting Electronic Components Market by Country

9.2.3 North America Passive and Interconnecting Electronic Components Market By Components

9.2.4 North America Passive and Interconnecting Electronic Components Market By Application

9.2.5 USA

9.2.5.1 USA Passive and Interconnecting Electronic Components Market By Components

9.2.5.2 USA Passive and Interconnecting Electronic Components Market By Application

9.2.6 Canada

9.2.6.1 Canada Passive and Interconnecting Electronic Components Market By Components

9.2.6.2 Canada Passive and Interconnecting Electronic Components Market By Application

9.2.7 Mexico

9.2.7.1 Mexico Passive and Interconnecting Electronic Components Market By Components

9.2.7.2 Mexico Passive and Interconnecting Electronic Components Market By Application

9.3 Europe

9.3.1 Trend Analysis

9.3.2 Eastern Europe

9.3.2.1 Eastern Europe Passive and Interconnecting Electronic Components Market by Country

9.3.2.2 Eastern Europe Passive and Interconnecting Electronic Components Market By Components

9.3.2.3 Eastern Europe Passive and Interconnecting Electronic Components Market By Application

9.3.2.4 Poland

9.3.2.4.1 Poland Passive and Interconnecting Electronic Components Market By Components

9.3.2.4.2 Poland Passive and Interconnecting Electronic Components Market By Application

9.3.2.5 Romania

9.3.2.5.1 Romania Passive and Interconnecting Electronic Components Market By Components

9.3.2.5.2 Romania Passive and Interconnecting Electronic Components Market By Application

9.3.2.6 Hungary

9.3.2.6.1 Hungary Passive and Interconnecting Electronic Components Market By Components

9.3.2.6.2 Hungary Passive and Interconnecting Electronic Components Market By Application

9.3.2.7 Turkey

9.3.2.7.1 Turkey Passive and Interconnecting Electronic Components Market By Components

9.3.2.7.2 Turkey Passive and Interconnecting Electronic Components Market By Application

9.3.2.8 Rest of Eastern Europe

9.3.2.8.1 Rest of Eastern Europe Passive and Interconnecting Electronic Components Market By Components

9.3.2.8.2 Rest of Eastern Europe Passive and Interconnecting Electronic Components Market By Application

9.3.3 Western Europe

9.3.3.1 Western Europe Passive and Interconnecting Electronic Components Market by Country

9.3.3.2 Western Europe Passive and Interconnecting Electronic Components Market By Components

9.3.3.3 Western Europe Passive and Interconnecting Electronic Components Market By Application

9.3.3.4 Germany

9.3.3.4.1 Germany Passive and Interconnecting Electronic Components Market By Components

9.3.3.4.2 Germany Passive and Interconnecting Electronic Components Market By Application

9.3.3.5 France

9.3.3.5.1 France Passive and Interconnecting Electronic Components Market By Components

9.3.3.5.2 France Passive and Interconnecting Electronic Components Market By Application

9.3.3.6 UK

9.3.3.6.1 UK Passive and Interconnecting Electronic Components Market By Components

9.3.3.6.2 UK Passive and Interconnecting Electronic Components Market By Application

9.3.3.7 Italy

9.3.3.7.1 Italy Passive and Interconnecting Electronic Components Market By Components

9.3.3.7.2 Italy Passive and Interconnecting Electronic Components Market By Application

9.3.3.8 Spain

9.3.3.8.1 Spain Passive and Interconnecting Electronic Components Market By Components

9.3.3.8.2 Spain Passive and Interconnecting Electronic Components Market By Application

9.3.3.9 Netherlands

9.3.3.9.1 Netherlands Passive and Interconnecting Electronic Components Market By Components

9.3.3.9.2 Netherlands Passive and Interconnecting Electronic Components Market By Application

9.3.3.10 Switzerland

9.3.3.10.1 Switzerland Passive and Interconnecting Electronic Components Market By Components

9.3.3.10.2 Switzerland Passive and Interconnecting Electronic Components Market By Application

9.3.3.11 Austria

9.3.3.11.1 Austria Passive and Interconnecting Electronic Components Market By Components

9.3.3.11.2 Austria Passive and Interconnecting Electronic Components Market By Application

9.3.3.12 Rest of Western Europe

9.3.3.12.1 Rest of Western Europe Passive and Interconnecting Electronic Components Market By Components

9.3.2.12.2 Rest of Western Europe Passive and Interconnecting Electronic Components Market By Application

9.4 Asia-Pacific

9.4.1 Trend Analysis

9.4.2 Asia Pacific Passive and Interconnecting Electronic Components Market by Country

9.4.3 Asia Pacific Passive and Interconnecting Electronic Components Market By Components

9.4.4 Asia Pacific Passive and Interconnecting Electronic Components Market By Application

9.4.5 China

9.4.5.1 China Passive and Interconnecting Electronic Components Market By Components

9.4.5.2 China Passive and Interconnecting Electronic Components Market By Application

9.4.6 India

9.4.6.1 India Passive and Interconnecting Electronic Components Market By Components

9.4.6.2 India Passive and Interconnecting Electronic Components Market By Application

9.4.7 Japan

9.4.7.1 Japan Passive and Interconnecting Electronic Components Market By Components

9.4.7.2 Japan Passive and Interconnecting Electronic Components Market By Application

9.4.8 South Korea

9.4.8.1 South Korea Passive and Interconnecting Electronic Components Market By Components

9.4.8.2 South Korea Passive and Interconnecting Electronic Components Market By Application

9.4.9 Vietnam

9.4.9.1 Vietnam Passive and Interconnecting Electronic Components Market By Components

9.4.9.2 Vietnam Passive and Interconnecting Electronic Components Market By Application

9.4.10 Singapore

9.4.10.1 Singapore Passive and Interconnecting Electronic Components Market By Components

9.4.10.2 Singapore Passive and Interconnecting Electronic Components Market By Application

9.4.11 Australia

9.4.11.1 Australia Passive and Interconnecting Electronic Components Market By Components

9.4.11.2 Australia Passive and Interconnecting Electronic Components Market By Application

9.4.12 Rest of Asia-Pacific

9.4.12.1 Rest of Asia-Pacific Passive and Interconnecting Electronic Components Market By Components

9.4.12.2 Rest of Asia-Pacific Passive and Interconnecting Electronic Components Market By Application

9.5 Middle East & Africa

9.5.1 Trend Analysis

9.5.2 Middle East

9.5.2.1 Middle East Passive and Interconnecting Electronic Components Market by Country

9.5.2.2 Middle East Passive and Interconnecting Electronic Components Market By Components

9.5.2.3 Middle East Passive and Interconnecting Electronic Components Market By Application

9.5.2.4 UAE

9.5.2.4.1 UAE Passive and Interconnecting Electronic Components Market By Components

9.5.2.4.2 UAE Passive and Interconnecting Electronic Components Market By Application

9.5.2.5 Egypt

9.5.2.5.1 Egypt Passive and Interconnecting Electronic Components Market By Components

9.5.2.5.2 Egypt Passive and Interconnecting Electronic Components Market By Application

9.5.2.6 Saudi Arabia

9.5.2.6.1 Saudi Arabia Passive and Interconnecting Electronic Components Market By Components

9.5.2.6.2 Saudi Arabia Passive and Interconnecting Electronic Components Market By Application

9.5.2.7 Qatar

9.5.2.7.1 Qatar Passive and Interconnecting Electronic Components Market By Components

9.5.2.7.2 Qatar Passive and Interconnecting Electronic Components Market By Application

9.5.2.8 Rest of Middle East

9.5.2.8.1 Rest of Middle East Passive and Interconnecting Electronic Components Market By Components

9.5.2.8.2 Rest of Middle East Passive and Interconnecting Electronic Components Market By Application

9.5.3 Africa

9.5.3.1 Africa Passive and Interconnecting Electronic Components Market by Country

9.5.3.2 Africa Passive and Interconnecting Electronic Components Market By Components

9.5.3.3 Africa Passive and Interconnecting Electronic Components Market By Application

9.5.2.4 Nigeria

9.5.2.4.1 Nigeria Passive and Interconnecting Electronic Components Market By Components

9.5.2.4.2 Nigeria Passive and Interconnecting Electronic Components Market By Application

9.5.2.5 South Africa

9.5.2.5.1 South Africa Passive and Interconnecting Electronic Components Market By Components

9.5.2.5.2 South Africa Passive and Interconnecting Electronic Components Market By Application

9.5.2.6 Rest of Africa

9.5.2.6.1 Rest of Africa Passive and Interconnecting Electronic Components Market By Components

9.5.2.6.2 Rest of Africa Passive and Interconnecting Electronic Components Market By Application

9.6 Latin America

9.6.1 Trend Analysis

9.6.2 Latin America Passive and Interconnecting Electronic Components Market by Country

9.6.3 Latin America Passive and Interconnecting Electronic Components Market By Components

9.6.4 Latin America Passive and Interconnecting Electronic Components Market By Application

9.6.5 Brazil

9.6.5.1 Brazil Passive and Interconnecting Electronic Components Market By Components

9.6.5.2 Brazil Passive and Interconnecting Electronic Components Market By Application

9.6.6 Argentina

9.6.6.1 Argentina Passive and Interconnecting Electronic Components Market By Components

9.6.6.2 Argentina Passive and Interconnecting Electronic Components Market By Application

9.6.7 Colombia

9.6.7.1 Colombia Passive and Interconnecting Electronic Components Market By Components

9.6.7.2 Colombia Passive and Interconnecting Electronic Components Market By Application

9.6.8 Rest of Latin America

9.6.8.1 Rest of Latin America Passive and Interconnecting Electronic Components Market By Components

9.6.8.2 Rest of Latin America Passive and Interconnecting Electronic Components Market By Application

10. Company Profiles

10.1 Kyocera AVX Corporation

10.1.1 Company Overview

10.1.2 Financial

10.1.3 Products/ Services Offered

10.1.4 The SNS View

10.2 Vishay Intertechnology Inc.

10.2.1 Company Overview

10.2.2 Financial

10.2.3 Products/ Services Offered

10.2.4 The SNS View

10.3 Murata Manufacturing Co.

10.3.1 Company Overview

10.3.2 Financial

10.3.3 Products/ Services Offered

10.3.4 The SNS View

10.4 TDK Corporation

10.4.1 Company Overview

10.4.2 Financial

10.4.3 Products/ Services Offered

10.4.4 The SNS View

10.5 Taiyo Yuden Ltd

10.5.1 Company Overview

10.5.2 Financial

10.5.3 Products/ Services Offered

10.5.4 The SNS View

10.6 TE Connectivity

10.6.1 Company Overview

10.6.2 Financial

10.6.3 Products/ Services Offered

10.6.4 The SNS View

10.7 Samsung Electro-mechanics

10.7.1 Company Overview

10.7.2 Financial

10.7.3 Products/ Services Offered

10.7.4 The SNS View

10.8 Hosiden Corporation

10.8.1 Company Overview

10.8.2 Financial

10.8.3 Products/ Services Offered

10.8.4 The SNS View

10.9 Yageo Group, Nichicon Corporation

10.9.1 Company Overview

10.9.2 Financial

10.9.3 Products/ Services Offered

10.9.4 The SNS View

10.10 Nichicon Corporation

10.10.1 Company Overview

10.10.2 Financial

10.10.3 Products/ Services Offered

10.10.4 The SNS View

11. Competitive Landscape

11.1 Competitive Benchmarking

11.2 Market Share Analysis

11.3 Recent Developments

11.3.1 Industry News

11.3.2 Company News

11.3.3 Mergers & Acquisitions

12. USE Cases and Best Practices

13. Conclusion

An accurate research report requires proper strategizing as well as implementation. There are multiple factors involved in the completion of good and accurate research report and selecting the best methodology to compete the research is the toughest part. Since the research reports we provide play a crucial role in any company’s decision-making process, therefore we at SNS Insider always believe that we should choose the best method which gives us results closer to reality. This allows us to reach at a stage wherein we can provide our clients best and accurate investment to output ratio.

Each report that we prepare takes a timeframe of 350-400 business hours for production. Starting from the selection of titles through a couple of in-depth brain storming session to the final QC process before uploading our titles on our website we dedicate around 350 working hours. The titles are selected based on their current market cap and the foreseen CAGR and growth.


The 5 steps process:

Step 1: Secondary Research:

Secondary Research or Desk Research is as the name suggests is a research process wherein, we collect data through the readily available information. In this process we use various paid and unpaid databases which our team has access to and gather data through the same. This includes examining of listed companies’ annual reports, Journals, SEC filling etc. Apart from this our team has access to various associations across the globe across different industries. Lastly, we have exchange relationships with various university as well as individual libraries.

Secondary Research

Step 2: Primary Research

When we talk about primary research, it is a type of study in which the researchers collect relevant data samples directly, rather than relying on previously collected data.  This type of research is focused on gaining content specific facts that can be sued to solve specific problems. Since the collected data is fresh and first hand therefore it makes the study more accurate and genuine.

We at SNS Insider have divided Primary Research into 2 parts.

Part 1 wherein we interview the KOLs of major players as well as the upcoming ones across various geographic regions. This allows us to have their view over the market scenario and acts as an important tool to come closer to the accurate market numbers. As many as 45 paid and unpaid primary interviews are taken from both the demand and supply side of the industry to make sure we land at an accurate judgement and analysis of the market.

This step involves the triangulation of data wherein our team analyses the interview transcripts, online survey responses and observation of on filed participants. The below mentioned chart should give a better understanding of the part 1 of the primary interview.

Primary Research

Part 2: In this part of primary research the data collected via secondary research and the part 1 of the primary research is validated with the interviews from individual consultants and subject matter experts.

Consultants are those set of people who have at least 12 years of experience and expertise within the industry whereas Subject Matter Experts are those with at least 15 years of experience behind their back within the same space. The data with the help of two main processes i.e., FGDs (Focused Group Discussions) and IDs (Individual Discussions). This gives us a 3rd party nonbiased primary view of the market scenario making it a more dependable one while collation of the data pointers.

Step 3: Data Bank Validation

Once all the information is collected via primary and secondary sources, we run that information for data validation. At our intelligence centre our research heads track a lot of information related to the market which includes the quarterly reports, the daily stock prices, and other relevant information. Our data bank server gets updated every fortnight and that is how the information which we collected using our primary and secondary information is revalidated in real time.

Data Bank Validation

Step 4: QA/QC Process

After all the data collection and validation our team does a final level of quality check and quality assurance to get rid of any unwanted or undesired mistakes. This might include but not limited to getting rid of the any typos, duplication of numbers or missing of any important information. The people involved in this process include technical content writers, research heads and graphics people. Once this process is completed the title gets uploader on our platform for our clients to read it.

Step 5: Final QC/QA Process:

This is the last process and comes when the client has ordered the study. In this process a final QA/QC is done before the study is emailed to the client. Since we believe in giving our clients a good experience of our research studies, therefore, to make sure that we do not lack at our end in any way humanly possible we do a final round of quality check and then dispatch the study to the client.

Key Segments:

By Components

  • Passive

  • Interconnecting

By Application

  • Consumer Electronics

  • IT & Telecommunication

  • Automotive

  • Industrial

  • Healthcare

  • Others

Request for Segment Customization as per your Business Requirement: Segment Customization Request

REGIONAL COVERAGE:

North America

  • US

  • Canada

  • Mexico

Europe

  • Eastern Europe

    • Poland

    • Romania

    • Hungary

    • Turkey

    • Rest of Eastern Europe

  • Western Europe

    • Germany

    • France

    • UK

    • Italy

    • Spain

    • Netherlands

    • Switzerland

    • Austria

    • Rest of Western Europe

Asia Pacific

  • China

  • India

  • Japan

  • South Korea

  • Vietnam

  • Singapore

  • Australia

  • Rest of Asia Pacific

Middle East & Africa

  • Middle East

    • UAE

    • Egypt

    • Saudi Arabia

    • Qatar

    • Rest of the Middle East

  • Africa

    • Nigeria

    • South Africa

    • Rest of Africa

Latin America

  • Brazil

  • Argentina

  • Colombia

Request for Country Level Research Report: Country Level Customization Request

Available Customization

With the given market data, SNS Insider offers customization as per the company’s specific needs. The following customization options are available for the report:

  • Product Analysis

  • Criss-Cross segment analysis (e.g. Product X Application)

  • Product Matrix which gives a detailed comparison of product portfolio of each company

  • Geographic Analysis

  • Additional countries in any of the regions

  • Company Information

  • Detailed analysis and profiling of additional market players (Up to five)


  •            5000 (33% Discount)


  •            8950 (40% Discount)


  •            3050 (23% Discount)

Start a Conversation

Hi! Click one of our member below to chat on Phone