Partner Relationship Management Market Report Scope & Overview:
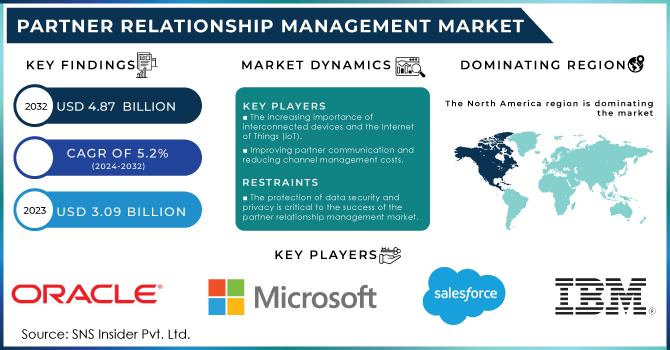
Partner Relationship Management Market was valued at USD 1.27 billion in 2023 and is expected to reach USD 4.14 billion by 2032, growing at a CAGR of 13.91% from 2024-2032. The report will examine the adoption rates of emerging technologies, user demographics, software integration capabilities, partner engagement, and satisfaction metrics, along with a feature analysis. It highlights how businesses leverage PRM solutions to enhance collaboration, improve partner satisfaction, and streamline operations. Market growth is driven by the increasing demand for efficient partner management and the rapid pace of technological advancements.
To Get More Information on Partner Relationship Management Market - Request Sample Report
Market Dynamics
Drivers
-
Strategic Partnerships Drive the Need for Effective Partner Relationship Management Solutions to Support Business Growth and Collaboration.
As companies expand their reach and capabilities, the need to form and manage strategic partnerships has become inevitable. Collaborations with external partners enable access to new markets, resource sharing, and innovation. However, managing relationships with such business entities has become more complex, demanding robust solutions that would streamline communication, monitor performances, and ensure alignment. This has further fueled the growth of sophisticated Partner Relationship Management systems to cater to the need for efficient partner onboarding and performance tracking. For example, PRM solutions offered by Impartner have resulted in 77% of companies having higher partner satisfaction, 40% of them achieving revenue growth and better performance through automation, which is another factor fueling market demand for PRM tools.
Restraints
-
High Implementation Costs Limit PRM System Adoption, Especially for Small and Medium-Sized Enterprises.
The adoption of Partner Relationship Management systems usually involves very massive initial investments in software, hardware, customization, and integration with existing business processes. Such investments are quite onerous for small and medium-sized enterprises. The businesses also need to allocate resources for the training of personnel and maintenance of the system within a longer period as these increase the cost generally. For instance, Salesforce's PRM solution ranges at USD 25 per user per month (billed annually), while the external apps cost USD 35 per user per month. Though PRM solutions can bring long-term benefits in managing the partner network and making collaborative processes efficient, the initial investment can be much of a burden for companies, especially in budget tight industries, to deploy such systems. The high cost limits the adoption of PRMs and slows down market growth.
Challenges
-
Integration with Existing Systems Creates Major Obstacles for Smooth Adoption and Effective Use of PRM Solutions.
Integration of the Partner Relationship Management solution with other enterprise software such as Customer Relationship Management and Enterprise Resource Planning is one of the biggest challenges to most businesses. Such systems involve complex data structures and workflows that are hard to achieve smooth interoperability between them. The process of integration may take a long time, thus requiring technical skills and resources to complete, raising the overall cost of implementation. Poorly executed integration might lead to potential system disruption and data inconsistencies that would place an additional burden on businesses. It would therefore dissuade the companies from acquiring PRM solutions or postpone its deployment as a company understands that such solutions have to be adapted to its present technology structure, which would mean considerable time delays in the widespread adoption of the PRM market across all types of industries
Opportunities
-
Cloud-Based PRM Solutions Offer Scalability, Cost-Effectiveness, and Accessibility, Driving Significant Growth Opportunities in the Market.
A strong and increasing demand for scalable, cost-effective, and accessible PRM solutions has changed the shape of the market. Cloud-based PRM systems provide businesses with flexibility in terms of managing partner networks efficiently, without the significant upfront investments made in traditional on-premise software. Such systems support remote teams and international collaboration with seamless access from anywhere. Cloud-based solutions also enable faster scaling for the business, meaning they can meet the changing demands of their ecosystems without the physical infrastructure hassle that comes with on-premises systems. A 2023 Oracle survey demonstrates the shift into hybrid and multi-cloud environments by 26 percent of companies toward a public cloud-first approach, while 24 percent use it to supplement existing infrastructures. For small to medium-sized organizations, cloud-based PRM presents a more budget-friendly option as well, ensuring greater penetration while further driving industry growth.
Segment Analysis
By Component
The Solutions segment dominated the Partner Relationship Management Market in 2023, accounting for approximately 62% of the revenue share because of high demand for scalable, efficient software that optimizes partner management and collaboration. Meanwhile, the Services segment will expand at a fastest CAGR of about 15.35% during 2024-2032, driven by growing need for customization, integration, as well as ongoing support to maximize the value of PRM solutions for businesses.
By Deployment Type
The On-premises segment led the Partner Relationship Management Market in 2023 with a 58% revenue share, due to businesses focusing on data security, privacy, and customization particularly in regulated sectors. However, the Cloud segment is expected to grow at a CAGR of 15.14% over the forecast period from 2024 to 2032 because companies are turning towards cost-effective, scalable, flexible, integration-friendly, and low maintenance applications that are ideally suited for their global expansion processes.
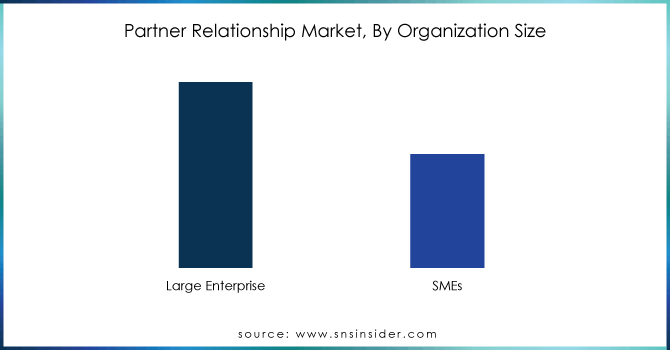
By Organization Size
The Large Enterprises segment dominated the Partner Relationship Management (PRM) Market in 2023 with a 68% revenue share, driven by the need for advanced, scalable solutions to manage complex partner networks and operations. However, the SMEs segment is expected to grow at the fastest CAGR of 15.51% from 2024 to 2032, fueled by increased digital adoption and the affordability of cloud-based PRM systems, enabling small and medium-sized businesses to enhance operational efficiency and expand their partner ecosystems.
By Vertical
The IT and Telecom segment led the Partner Relationship Management Market with a 29% revenue share in 2023, given the growing necessity of managing a large network of partners by both service providers and technology vendors. On the other hand, the BFSI segment is projected to witness the highest CAGR of 15.87% during 2024-2032. BFSI segment demand for secure and efficient PRM systems for optimal partner ecosystems with improved collaboration during digital transformation and regulatory complexity drives the growth in this sector.
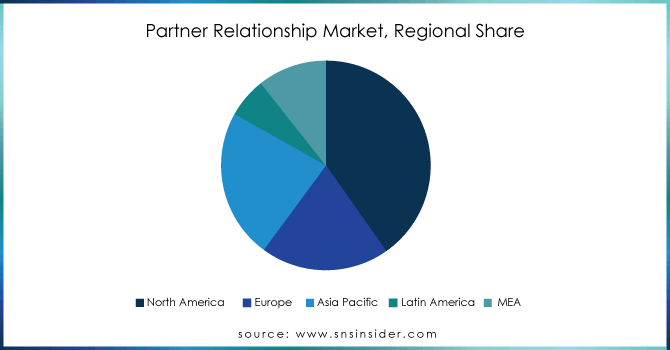
Regional Analysis
In 2023, North America held the largest revenue share of approximately 37% in the Partner Relationship Management Market. This is mainly because the region has advanced technological infrastructure and several large enterprises spread across different industries. In North America, most businesses rely on PRM solutions to facilitate easier partner management, enhance collaboration, and acquire competitive advantage. The high adoption of these systems relates to the demands for efficient solutions that are easily scalable to enable complex partner networks and operations.
Asia Pacific is expected to grow at the fastest CAGR of 16.71% from 2024 to 2032, driven by Rapid digital transformation in the region and increasing adoption of innovative technologies by small and medium-sized enterprises is fueling its growth. Increasing need to optimize operations and to take care of expansive partner ecosystems in emerging economies is pushing businesses in the region towards PRM solutions. Companies expanding around the globe are expected to increase demand for scalable, efficient partner management systems significantly in the coming years.
Do You Need any Customization Research on Partner Relationship Management Market - Enquire Now
Key Players
-
Allbound (Partner Portal, Partner Enablement)
-
Channeltivity (Partner Relationship Management, Channel Marketing Automation)
-
Oracle (Oracle Partner Management, Oracle Cloud)
-
Salesforce (Salesforce PRM, Salesforce Partner Community)
-
Impartner (Partner Portal, Partner Management Software)
-
LogicBay (Partner Relationship Management, Channel Learning)
-
Magentrix (Partner Portal, Channel Automation)
-
ZINFI Technologies (Partner Portal, Channel Marketing)
-
Zift Solutions (ZiftONE, Zift Marketing Hub)
-
Mindmatrix (Partner Relationship Management, Partner Enablement)
-
PartnerStack (Partner Portal, Affiliate Management)
-
ChannelXperts (Channel Management Platform, Partner Portal)
-
Creatio (Partner Relationship Management, No-Code Workflow Automation)
-
AppDirect (AppDirect Marketplace, Channel Management)
-
Webinfinity (Partner Portal, Digital Enablement)
-
PartnerPortal.io (Partner Portal, Channel Automation)
-
Kiflo (Partner Portal, Partner Management)
-
Crossbeam (Partner Ecosystem Platform, Data Sharing)
-
Everflow (Partner Tracking Software, Affiliate Marketing)
-
Affise (Affiliate Marketing, Partner Relationship Management)
-
WorkSpan (Partner Ecosystem, Co-Sell Platform)
-
LeadMethod (Lead Distribution, Partner Portal)
-
Sharework (Channel Marketing, Partner Collaboration)
-
Agentcis (CRM for Agents, Partner Portal)
-
CoSell (Partner Relationship Management, Collaboration Platform)
Recent Developments:
-
In 2025, Oracle's NetSuite CRM updates focus on enhancing Partner Relationship Management features, providing improved tools for managing partner interactions and sales processes. The new features aim to strengthen collaboration and drive business growth across the partner ecosystem.
-
In 2024, Oracle introduced new features in its Fusion Cloud Partner Relationship Management 24D release, aimed at enhancing partner collaboration, optimizing sales processes, and improving partner management capabilities.
-
In July 2024, Salesforce introduced Partner Connect, a new feature within its Partner Relationship Management solution, offering real-time visibility into partner sales and streamlining deal management. This tool aims to improve collaboration and boost productivity across partner channels.
| Report Attributes | Details |
|---|---|
| Market Size in 2023 | USD 1.27 Billion |
| Market Size by 2032 | USD 4.09 Billion |
| CAGR | CAGR of 13.91% From 2024 to 2032 |
| Base Year | 2023 |
| Forecast Period | 2024-2032 |
| Historical Data | 2020-2022 |
| Report Scope & Coverage | Market Size, Segments Analysis, Competitive Landscape, Regional Analysis, DROC & SWOT Analysis, Forecast Outlook |
| Key Segments | • By Component (Solutions, Services) • By Deployment Type (On-premises, Cloud) • By Organization Size (Large Enterprises, SMEs) • By Vertical (BFSI, Retail and Franchising, Healthcare and Life Sciences, Manufacturing, IT and Telecom, Others) |
| Regional Analysis/Coverage | North America (US, Canada, Mexico), Europe (Eastern Europe [Poland, Romania, Hungary, Turkey, Rest of Eastern Europe] Western Europe] Germany, France, UK, Italy, Spain, Netherlands, Switzerland, Austria, Rest of Western Europe]), Asia Pacific (China, India, Japan, South Korea, Vietnam, Singapore, Australia, Rest of Asia Pacific), Middle East & Africa (Middle East [UAE, Egypt, Saudi Arabia, Qatar, Rest of Middle East], Africa [Nigeria, South Africa, Rest of Africa], Latin America (Brazil, Argentina, Colombia, Rest of Latin America) |
| Company Profiles | Allbound, Channeltivity, Oracle, Salesforce, Impartner, LogicBay, Magentrix, ZINFI Technologies, Zift Solutions, Mindmatrix, PartnerStack, ChannelXperts, Creatio, AppDirect, Webinfinity, PartnerPortal.io, Kiflo, Crossbeam, Everflow, Affise, WorkSpan, LeadMethod, Sharework, Agentcis, CoSell. |
