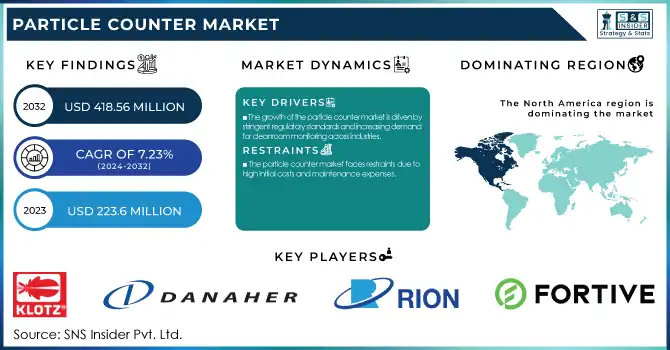
The Particle Counter Market Size was valued at USD 223.6 million in 2023 and is expected to reach USD 418.56 million by 2032 and grow at a CAGR of 7.23% over the forecast period 2024-2032. This report identifies the rising incidence and prevalence of air and water pollutants, fueling the need for sophisticated monitoring solutions. The research examines particle counter sales and adoption patterns by region, driven by increasing awareness of air quality, industrial safety legislation, and the growth of healthcare and cleanroom monitoring spending. Further, it explores emerging technologies and innovations in particle counters, such as developments in real-time monitoring and automation, with the changing regulatory and compliance scenario that influences market growth. The report also discusses investment and R&D trends, highlighting the role of ongoing technological advancements and industry-led research in boosting market potential.
Get more information on Particle Counter Market - Request Sample Report
Drivers
The growth of the particle counter market is driven by stringent regulatory standards and increasing demand for cleanroom monitoring across industries.
Regulatory authorities like the FDA (21 CFR Part 11), ISO 14644-1, and EU GMP Annex 1 require contamination control in pharmaceutical, biotechnology, and semiconductor applications, which have driven the usage of particle counters. The increased incidence of airborne and liquid contamination has also influenced the demand for real-time monitoring in healthcare, food, and beverage industries. Also, the growing awareness of air pollution and environmental monitoring has increased demand for airborne particle counters in air quality assessment industries. The expansion of the semiconductor industry, which is fueled by nanotechnology and microelectronics developments, has also fueled the demand for accurate contamination monitoring. Furthermore, technological developments like IoT-based particle counters that offer real-time data analysis and remote monitoring are driving adoption across industries. The COVID-19 pandemic hastened investments in hospital infection control, and also increased the need for air quality monitoring solutions. Other industries like aerospace and defense are also introducing particle counters for precise contamination measurement to ensure operational safety and compliance with regulations. The growing emphasis on quality assurance in manufacturing and research facilities continues to propel the market forward.
Restraints
The particle counter market faces restraints due to high initial costs and maintenance expenses.
High-end particle counters using laser-based detection and real-time monitoring are costly, and it is challenging for SMEs to adopt them. Calibration and maintenance needs also contribute to operational expenses, requiring industries to have substantial budgets for maintenance. Limited awareness and technical skills in developing regions further limit market penetration. In industry sectors like food & beverage and industrial manufacturing, companies tend to value cost over precision monitoring, curtailing mass uptake. In addition, diversity in regulatory requirements across regions adds complexity to manufacturers, who need to comply with a number of certification procedures prior to accessing new markets. The increased use of alternative contamination monitoring techniques like microbiological testing and gravimetric analysis also puts a cap on the use of particle counters in some applications. Further, industries with lesser risk of contamination, like general industrial production, also fail to invest in sophisticated particle monitoring equipment. The lag in uptake within developing economies, resulting from cost considerations and reduced regulation enforcement, is another market restraint that prevents the expansion. These together are acting as restrains and impeding the general use of sophisticated particle counter technology.
Opportunities
The growing emphasis on air and water quality monitoring presents significant opportunities for the particle counter market.
With an increasing level of global air pollution, governments worldwide are imposing increasingly stricter regulations that trigger demand for airborne particle counters. Efforts like the WHO Global Air Quality Guidelines and air monitoring programs run by governments within the U.S. (EPA's AirNow) and Europe (European Environment Agency) are raising expenditures in real-time monitoring of pollutants. Also, the fast development of the pharmaceutical and biotech industries is a good opportunity, as firms increase cleanroom space to comply with strict regulatory requirements. The semiconductor industry's need for ultra-clean environments is another opportunity, as contamination control is essential for nanotechnology and microelectronics manufacturing. The increasing use of automation and AI-based monitoring is making smart particle counters possible that are integrated with cloud platforms for remote access and predictive maintenance. The growing emphasis on aerospace industry contamination monitoring and space research is also broadening the scope of particle counters' applications. In addition, emerging markets like India and Southeast Asia, which have developing economies with burgeoning pharmaceutical and semiconductor industries, offer untapped market potential for growth. The convergence of IoT, AI, and smart sensors in particle counters will drive the next wave of industry development, enhancing efficiency and data-driven decision-making.
Challenges
One of the primary challenges in the particle counter market is data accuracy and reliability in dynamic environments.
Variables like humidity, temperature variations, and airflow changes can affect particle measurement readings, causing them to be inconsistent. This issue is particularly significant in high-precision sectors like pharmaceuticals, aerospace, and semiconductor production, where even slight variations can cause compliance failures. Another significant challenge is the potential for sensor contamination and instrument failure with long-term use, necessitating regular calibration and maintenance. Also, measurement method standardization across industries is still an obstacle, with different industries applying different threshold levels and contamination detection parameters, posing challenges to universal acceptance. Cybersecurity attacks in IoT-based particle counters are also becoming a challenge, as real-time monitoring systems are becoming more and more integrated with cloud-based data management platforms, exposing them to hacking and data breaches. A second challenge is slow uptake of next-generation monitoring technology in price-sensitive markets, with companies reluctant to move from low-cost or manual particle counters to high-end automatic particle counters. Finally, supply chain disruptions to the semiconductor and electronics industries disrupt the supply of critical components to produce particle counters, causing delay in product shipment and raising the cost.
By Product
Airborne particle counters captured the highest market share in 2023, representing 55% of the overall market. This was fueled by the increasing need for cleanroom monitoring in sectors like pharmaceuticals, semiconductors, and healthcare. Strict regulatory requirements, including ISO 14644-1 for cleanrooms and FDA regulations for pharmaceutical production, also spurred the use of airborne particle counters. Moreover, growing air pollution and indoor air quality monitoring concerns helped drive their extensive use.
Liquid particle counters were the segment that grew at the fastest rate during the forecast period, with considerable growth in the Particle Counter market. Increasing demand for accurate contamination monitoring in injectable drugs, water treatment, and semiconductor manufacture was the driver. Stringency in USP <788> regulation for injectable solutions was a key factor behind the growing use of liquid particle counters. Their capability to detect trace amounts of microscopic contaminants in high-purity liquids has made them a major growth driver in the industry.
By Application
Cleanroom monitoring was the most dominant application segment in 2023, accounting for almost 60% of the overall market share. The segment's dominance was due to the stringent regulatory environment in pharmaceutical production, biotechnology, and semiconductor manufacturing, where contamination control is paramount. The growth of cleanroom facilities in these industries, coupled with increasing investments in sophisticated air quality monitoring systems, played a key role in the segment's market dominance.
Liquid contamination monitoring was the most rapidly growing application in the forecast year, led by growing interest in water and fluid purity in key industries like pharmaceuticals, food & beverage, and microelectronics. Implementation of strict standards for quality control, especially in injectable medicines and beverage manufacturing, resulted in greater usage of liquid particle counters. Increased investment in water treatment facilities and ultrapure water monitoring also spurred growth in this segment.
By Modality
Portable particle counters dominated the market in 2023 with a 48% share, due to their convenience, simplicity, and widespread usage across cleanrooms, environmental monitoring, and industrial contamination surveys. Their capability to offer real-time data and adherence to regulatory standards made them the most sought-after solution for industries demanding on-site monitoring. Increased demand for handheld monitoring equipment in healthcare and pharmaceutical industries further entrenched their market share.
Remote particle counters were the highest-growing modality during the forecast period, with growth spurred by the growing demand for continuous and automated monitoring tools in controlled environments. Pharmaceutical, semiconductor manufacturing, and aerospace industries preferred these products because they can supply real-time information without any intervention. Integration of IoT and cloud-based monitoring solutions also fueled the demand for remote particle counters to ensure compliance with regulations and optimal operations.
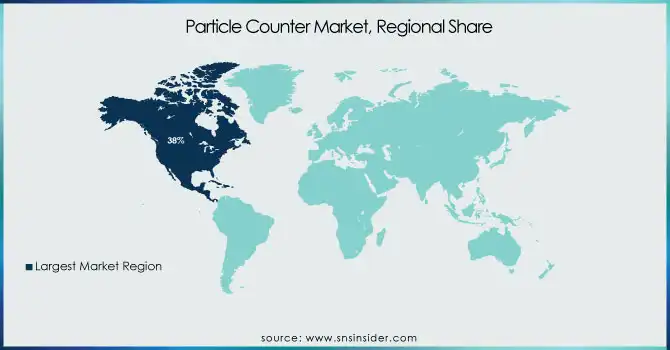
North America led the market for particle counters in 2023, accounting for nearly 38% of the overall market share. The region's dominance was fueled by strict regulatory needs in pharmaceuticals, biotechnology, and semiconductor sectors, especially in the U.S., where institutions like the FDA and EPA require precise contamination monitoring. The presence of prominent industry players, growing cleanroom technology adoption, and growing investment in air quality monitoring also helped contribute to the dominance of North America.
Europe was the second-largest market, which was fueled by regulatory compliance for environmental and industrial pollution control, especially in Germany, France, and the U.K. The pharmaceutical industry's compliance with EU GMP standards also played a key role in driving the demand for particle counters. Asia-Pacific was the fastest-growing region, with a projected growth rate of over the forecast period, driven by aggressive industrialization, increasing adoption of cleanrooms in semiconductor and healthcare industries, and strict pollution control laws. These nations, including China, Japan, and South Korea, saw a rapid demand growth, especially for liquid particle counters, which were the global fastest-growing product category as they gained wider applications in pharmaceutical water purity monitoring and ultrapure water usage in semiconductor manufacturing.
Get Customized Report as per Your Business Requirement - Enquiry Now
List of Key Players and Their Particle Counter Products
Markus Klotz GmbH – KO-15, KO-200, Klotz KO-4
Danaher (Beckman Coulter, Inc.) – HIAC 9703+, HIAC PODS, MET ONE 3400+
RION Co., Ltd. – KC-52, KC-31, KR-12A
Fortive Corporation (Fluke Corporation and Setra Systems) – Fluke 985, Setra Systems 8000 Series
Lighthouse Worldwide Solutions – Apex Z3, Apex P3, Handheld 3016
Spectris Plc – Airy Technology P311, Particles Plus 8306
TSI Inc. – AeroTrak 9306, AeroTrak 9110, Chemtrak 8200
PAMAS Partikelmess – PAMAS S40, PAMAS SBSS, PAMAS 4132
Met One Instruments, Inc. – GT-526S, 804 Handheld, BT-637
PCE Deutschland GmbH – PCE-PCO 2, PCE-PCO 1, PCE-MPC 10
Ventureduyne Ltd. – Lighthouse Apex, Airnet II
Particle Plus, Inc. – Particles Plus 8301, 8506, 9501
Kanomax USA, Inc. – Model 3889, Model 3905, Model 3910
Veralto Corporation – HIAC 9703+, MET ONE 3400
Horiba Ltd. – LA-350, LA-960V2
Greywolf Sensing Solutions – GreyWolf PC-4000, PC-5000
Recent Developments
In Feb 2025, Trescal acquired FMS, strengthening its contamination control capabilities in the UK and Ireland. This follows previous acquisitions, including Cleanroom Management International (2021) and five firms in 2023, further expanding Trescal’s expertise in environmental monitoring and cleanroom solutions.
| Report Attributes | Details |
| Market Size in 2023 | USD 223.6 million |
| Market Size by 2032 | USD 418.56 million |
| CAGR | CAGR of 7.23% From 2024 to 2032 |
| Base Year | 2023 |
| Forecast Period | 2024-2032 |
| Historical Data | 2020-2022 |
| Report Scope & Coverage | Market Size, Segments Analysis, Competitive Landscape, Regional Analysis, DROC & SWOT Analysis, Forecast Outlook |
| Key Segments | • By Product [Airborne Particle Counters, Liquid Particle Counters, Others] • By Application [Cleanroom Monitoring, Contamination Monitoring of Liquids, Aerosol Monitoring and Research] • By Modality [Benchtop, Portable, Remote] |
| Regional Analysis/Coverage | North America (US, Canada, Mexico), Europe (Eastern Europe [Poland, Romania, Hungary, Turkey, Rest of Eastern Europe] Western Europe] Germany, France, UK, Italy, Spain, Netherlands, Switzerland, Austria, Rest of Western Europe]), Asia Pacific (China, India, Japan, South Korea, Vietnam, Singapore, Australia, Rest of Asia Pacific), Middle East & Africa (Middle East [UAE, Egypt, Saudi Arabia, Qatar, Rest of Middle East], Africa [Nigeria, South Africa, Rest of Africa], Latin America (Brazil, Argentina, Colombia, Rest of Latin America) |
| Company Profiles | Markus Klotz GmbH, Danaher (Beckman Coulter, Inc.), RION Co., Ltd., Fortive Corporation (Fluke Corporation and Setra Systems), Lighthouse Worldwide Solutions, Spectris Plc, TSI Inc., PAMAS Partikelmess, Met One Instruments, Inc., PCE Deutschland GmbH, Ventureduyne Ltd., Particle Plus, Inc., Kanomax USA, Inc., Veralto Corporation, Horiba Ltd., Greywolf Sensing Solutions. |
Ans: The Particle Counter Market is to grow at a CAGR of 7.23% over the forecast period 2024-2032.
The by technology Type is divided into three sub segments :
The challenges faced by Particle Counter market is Particle counters have some technical constraints.
Top-down, bottom-up, Quantitative, Qualitative Research, Descriptive, Analytical, Applied, Fundamental Research.
Ans: The Particle Counter Market is expected to reach US$ 418.56 Mn by 2032.
Table of contents:
1. Introduction
1.1 Market Definition
1.2 Scope (Inclusion and Exclusions)
1.3 Research & Academic Institutes Assumptions
2. Executive Summary
2.1 Market Overview
2.2 Regional Synopsis
2.3 Competitive Summary
3. Research & Academic Institutes Methodology
3.1 Top-Down Approach
3.2 Bottom-up Approach
3.3. Data Validation
3.4 Primary Interviews
4. Market Dynamics Impact Analysis
4.1 Market Driving Factors Analysis
4.1.1 Drivers
4.1.2 Restraints
4.1.3 Opportunities
4.1.4 Challenges
4.2 PESTLE Analysis
4.3 Porter’s Five Forces Model
5. Statistical Insights and Trends Reporting
5.1 Incidence and Prevalence of Air and Water Contaminants (2023)
5.2 Particle Counter Sales and Adoption Trends (2023), by Region
5.3 Healthcare and Cleanroom Monitoring Expenditure, by Region (2023)
5.4 Emerging Technologies and Innovations in Particle Counters
5.5 Regulatory and Compliance Trends Impacting Market Growth
5.6 Investment and R&D Trends in the Particle Counter Market
6. Competitive Landscape
6.1 List of Major Companies, By Region
6.2 Market Share Analysis, By Region
6.3 Product Benchmarking
6.3.1 Product specifications and features
6.3.2 Pricing
6.4 Strategic Initiatives
6.4.1 Marketing and Promotional Activities
6.4.2 Distribution and Supply Chain Strategies
6.4.3 Expansion plans and new Product launches
6.4.4 Strategic partnerships and collaborations
6.5 Technological Advancements
6.6 Market Positioning and Branding
7. Particle Counter Market Segmentation, by Product
7.1 Chapter Overview
7.2 Airborne Particle Counters
7.2.1 Airborne Particle Counters Market Trends Analysis (2020-2032)
7.2.2 Airborne Particle Counters Market Size Estimates and Forecasts to 2032 (USD Million)
7.3 Liquid Particle Counters
7.3.1 Liquid Particle Counters Market Trends Analysis (2020-2032)
7.3.2 Liquid Particle Counters Market Size Estimates and Forecasts to 2032 (USD Million)
7.4 Others
7.4.1 Others Market Trends Analysis (2020-2032)
7.4.2 Others Market Size Estimates and Forecasts to 2032 (USD Million)
8. Particle Counter Market Segmentation, by Application
8.1 Chapter Overview
8.2 Cleanroom Monitoring
8.2.1 Cleanroom Monitoring Market Trends Analysis (2020-2032)
8.2.2 Cleanroom Monitoring Market Size Estimates and Forecasts to 2032 (USD Million)
8.3 Contamination Monitoring of Liquids
8.3.1 Contamination Monitoring of Liquids Market Trends Analysis (2020-2032)
8.3.2 Contamination Monitoring of Liquids Market Size Estimates and Forecasts to 2032 (USD Million)
8.4 Aerosol Monitoring and Research
8.4.1 Aerosol Monitoring and Research Market Trends Analysis (2020-2032)
8.4.2 Aerosol Monitoring and Research Market Size Estimates and Forecasts to 2032 (USD Million)
9. Particle Counter Market Segmentation, by Modality
9.1 Chapter Overview
9.2 Benchtop
9.2.1 Benchtop Market Trends Analysis (2020-2032)
9.2.2 Benchtop Market Size Estimates and Forecasts to 2032 (USD Million)
9.3 Portable
9.3.1 Portable Market Trends Analysis (2020-2032)
9.3.2 Portable Market Size Estimates and Forecasts to 2032 (USD Million)
9.4 Remote
9.4.1 Remote Market Trends Analysis (2020-2032)
9.4.2 Remote Market Size Estimates and Forecasts to 2032 (USD Million)
10. Regional Analysis
10.1 Chapter Overview
10.2 North America
10.2.1 Trends Analysis
10.2.2 North America Particle Counter Market Estimates and Forecasts, by Country (2020-2032) (USD Million)
10.2.3 North America Particle Counter Market Estimates and Forecasts, by Product (2020-2032) (USD Million)
10.2.4 North America Particle Counter Market Estimates and Forecasts, by Application (2020-2032) (USD Million)
10.2.5 North America Particle Counter Market Estimates and Forecasts, by Modality (2020-2032) (USD Million)
10.2.6 USA
10.2.6.1 USA Particle Counter Market Estimates and Forecasts, by Product (2020-2032) (USD Million)
10.2.6.2 USA Particle Counter Market Estimates and Forecasts, by Application (2020-2032) (USD Million)
10.2.6.3 USA Particle Counter Market Estimates and Forecasts, by Modality (2020-2032) (USD Million)
10.2.7 Canada
10.2.7.1 Canada Particle Counter Market Estimates and Forecasts, by Product (2020-2032) (USD Million)
10.2.7.2 Canada Particle Counter Market Estimates and Forecasts, by Application (2020-2032) (USD Million)
10.2.7.3 Canada Particle Counter Market Estimates and Forecasts, by Modality (2020-2032) (USD Million)
10.2.8 Mexico
10.2.8.1 Mexico Particle Counter Market Estimates and Forecasts, by Product (2020-2032) (USD Million)
10.2.8.2 Mexico Particle Counter Market Estimates and Forecasts, by Application (2020-2032) (USD Million)
10.2.8.3 Mexico Particle Counter Market Estimates and Forecasts, by Modality (2020-2032) (USD Million)
10.3 Europe
10.3.1 Eastern Europe
10.3.1.1 Trends Analysis
10.3.1.2 Eastern Europe Particle Counter Market Estimates and Forecasts, by Country (2020-2032) (USD Million)
10.3.1.3 Eastern Europe Particle Counter Market Estimates and Forecasts, by Product (2020-2032) (USD Million)
10.3.1.4 Eastern Europe Particle Counter Market Estimates and Forecasts, by Application (2020-2032) (USD Million)
10.3.1.5 Eastern Europe Particle Counter Market Estimates and Forecasts, by Modality (2020-2032) (USD Million)
10.3.1.6 Poland
10.3.1.6.1 Poland Particle Counter Market Estimates and Forecasts, by Product (2020-2032) (USD Million)
10.3.1.6.2 Poland Particle Counter Market Estimates and Forecasts, by Application (2020-2032) (USD Million)
10.3.1.6.3 Poland Particle Counter Market Estimates and Forecasts, by Modality (2020-2032) (USD Million)
10.3.1.7 Romania
10.3.1.7.1 Romania Particle Counter Market Estimates and Forecasts, by Product (2020-2032) (USD Million)
10.3.1.7.2 Romania Particle Counter Market Estimates and Forecasts, by Application (2020-2032) (USD Million)
10.3.1.7.3 Romania Particle Counter Market Estimates and Forecasts, by Modality (2020-2032) (USD Million)
10.3.1.8 Hungary
10.3.1.8.1 Hungary Particle Counter Market Estimates and Forecasts, by Product (2020-2032) (USD Million)
10.3.1.8.2 Hungary Particle Counter Market Estimates and Forecasts, by Application (2020-2032) (USD Million)
10.3.1.8.3 Hungary Particle Counter Market Estimates and Forecasts, by Modality (2020-2032) (USD Million)
10.3.1.9 turkey
10.3.1.9.1 Turkey Particle Counter Market Estimates and Forecasts, by Product (2020-2032) (USD Million)
10.3.1.9.2 Turkey Particle Counter Market Estimates and Forecasts, by Application (2020-2032) (USD Million)
10.3.1.9.3 Turkey Particle Counter Market Estimates and Forecasts, by Modality (2020-2032) (USD Million)
10.3.1.10 Rest of Eastern Europe
10.3.1.10.1 Rest of Eastern Europe Particle Counter Market Estimates and Forecasts, by Product (2020-2032) (USD Million)
10.3.1.10.2 Rest of Eastern Europe Particle Counter Market Estimates and Forecasts, by Application (2020-2032) (USD Million)
10.3.1.10.3 Rest of Eastern Europe Particle Counter Market Estimates and Forecasts, by Modality (2020-2032) (USD Million)
10.3.2 Western Europe
10.3.2.1 Trends Analysis
10.3.2.2 Western Europe Particle Counter Market Estimates and Forecasts, by Country (2020-2032) (USD Million)
10.3.2.3 Western Europe Particle Counter Market Estimates and Forecasts, by Product (2020-2032) (USD Million)
10.3.2.4 Western Europe Particle Counter Market Estimates and Forecasts, by Application (2020-2032) (USD Million)
10.3.2.5 Western Europe Particle Counter Market Estimates and Forecasts, by Modality (2020-2032) (USD Million)
10.3.2.6 Germany
10.3.2.6.1 Germany Particle Counter Market Estimates and Forecasts, by Product (2020-2032) (USD Million)
10.3.2.6.2 Germany Particle Counter Market Estimates and Forecasts, by Application (2020-2032) (USD Million)
10.3.2.6.3 Germany Particle Counter Market Estimates and Forecasts, by Modality (2020-2032) (USD Million)
10.3.2.7 France
10.3.2.7.1 France Particle Counter Market Estimates and Forecasts, by Product (2020-2032) (USD Million)
10.3.2.7.2 France Particle Counter Market Estimates and Forecasts, by Application (2020-2032) (USD Million)
10.3.2.7.3 France Particle Counter Market Estimates and Forecasts, by Modality (2020-2032) (USD Million)
10.3.2.8 UK
10.3.2.8.1 UK Particle Counter Market Estimates and Forecasts, by Product (2020-2032) (USD Million)
10.3.2.8.2 UK Particle Counter Market Estimates and Forecasts, by Application (2020-2032) (USD Million)
10.3.2.8.3 UK Particle Counter Market Estimates and Forecasts, by Modality (2020-2032) (USD Million)
10.3.2.9 Italy
10.3.2.9.1 Italy Particle Counter Market Estimates and Forecasts, by Product (2020-2032) (USD Million)
10.3.2.9.2 Italy Particle Counter Market Estimates and Forecasts, by Application (2020-2032) (USD Million)
10.3.2.9.3 Italy Particle Counter Market Estimates and Forecasts, by Modality (2020-2032) (USD Million)
10.3.2.10 Spain
10.3.2.10.1 Spain Particle Counter Market Estimates and Forecasts, by Product (2020-2032) (USD Million)
10.3.2.10.2 Spain Particle Counter Market Estimates and Forecasts, by Application (2020-2032) (USD Million)
10.3.2.10.3 Spain Particle Counter Market Estimates and Forecasts, by Modality (2020-2032) (USD Million)
10.3.2.11 Netherlands
10.3.2.11.1 Netherlands Particle Counter Market Estimates and Forecasts, by Product (2020-2032) (USD Million)
10.3.2.11.2 Netherlands Particle Counter Market Estimates and Forecasts, by Application (2020-2032) (USD Million)
10.3.2.11.3 Netherlands Particle Counter Market Estimates and Forecasts, by Modality (2020-2032) (USD Million)
10.3.2.12 Switzerland
10.3.2.12.1 Switzerland Particle Counter Market Estimates and Forecasts, by Product (2020-2032) (USD Million)
10.3.2.12.2 Switzerland Particle Counter Market Estimates and Forecasts, by Application (2020-2032) (USD Million)
10.3.2.12.3 Switzerland Particle Counter Market Estimates and Forecasts, by Modality (2020-2032) (USD Million)
10.3.2.13 Austria
10.3.2.13.1 Austria Particle Counter Market Estimates and Forecasts, by Product (2020-2032) (USD Million)
10.3.2.13.2 Austria Particle Counter Market Estimates and Forecasts, by Application (2020-2032) (USD Million)
10.3.2.13.3 Austria Particle Counter Market Estimates and Forecasts, by Modality (2020-2032) (USD Million)
10.3.2.14 Rest of Western Europe
10.3.2.14.1 Rest of Western Europe Particle Counter Market Estimates and Forecasts, by Product (2020-2032) (USD Million)
10.3.2.14.2 Rest of Western Europe Particle Counter Market Estimates and Forecasts, by Application (2020-2032) (USD Million)
10.3.2.14.3 Rest of Western Europe Particle Counter Market Estimates and Forecasts, by Modality (2020-2032) (USD Million)
10.4 Asia Pacific
10.4.1 Trends Analysis
10.4.2 Asia Pacific Particle Counter Market Estimates and Forecasts, by Country (2020-2032) (USD Million)
10.4.3 Asia Pacific Particle Counter Market Estimates and Forecasts, by Product (2020-2032) (USD Million)
10.4.4 Asia Pacific Particle Counter Market Estimates and Forecasts, by Application (2020-2032) (USD Million)
10.4.5 Asia Pacific Particle Counter Market Estimates and Forecasts, by Modality (2020-2032) (USD Million)
10.4.6 China
10.4.6.1 China Particle Counter Market Estimates and Forecasts, by Product (2020-2032) (USD Million)
10.4.6.2 China Particle Counter Market Estimates and Forecasts, by Application (2020-2032) (USD Million)
10.4.6.3 China Particle Counter Market Estimates and Forecasts, by Modality (2020-2032) (USD Million)
10.4.7 India
10.4.7.1 India Particle Counter Market Estimates and Forecasts, by Product (2020-2032) (USD Million)
10.4.7.2 India Particle Counter Market Estimates and Forecasts, by Application (2020-2032) (USD Million)
10.4.7.3 India Particle Counter Market Estimates and Forecasts, by Modality (2020-2032) (USD Million)
10.4.8 Japan
10.4.8.1 Japan Particle Counter Market Estimates and Forecasts, by Product (2020-2032) (USD Million)
10.4.8.2 Japan Particle Counter Market Estimates and Forecasts, by Application (2020-2032) (USD Million)
10.4.8.3 Japan Particle Counter Market Estimates and Forecasts, by Modality (2020-2032) (USD Million)
10.4.9 South Korea
10.4.9.1 South Korea Particle Counter Market Estimates and Forecasts, by Product (2020-2032) (USD Million)
10.4.9.2 South Korea Particle Counter Market Estimates and Forecasts, by Application (2020-2032) (USD Million)
10.4.9.3 South Korea Particle Counter Market Estimates and Forecasts, by Modality (2020-2032) (USD Million)
10.4.10 Vietnam
10.4.10.1 Vietnam Particle Counter Market Estimates and Forecasts, by Product (2020-2032) (USD Million)
10.4.10.2 Vietnam Particle Counter Market Estimates and Forecasts, by Application (2020-2032) (USD Million)
10.4.10.3 Vietnam Particle Counter Market Estimates and Forecasts, by Modality (2020-2032) (USD Million)
10.4.11 Singapore
10.4.11.1 Singapore Particle Counter Market Estimates and Forecasts, by Product (2020-2032) (USD Million)
10.4.11.2 Singapore Particle Counter Market Estimates and Forecasts, by Application (2020-2032) (USD Million)
10.4.11.3 Singapore Particle Counter Market Estimates and Forecasts, by Modality (2020-2032) (USD Million)
10.4.12 Australia
10.4.12.1 Australia Particle Counter Market Estimates and Forecasts, by Product (2020-2032) (USD Million)
10.4.12.2 Australia Particle Counter Market Estimates and Forecasts, by Application (2020-2032) (USD Million)
10.4.12.3 Australia Particle Counter Market Estimates and Forecasts, by Modality (2020-2032) (USD Million)
10.4.13 Rest of Asia Pacific
10.4.13.1 Rest of Asia Pacific Particle Counter Market Estimates and Forecasts, by Product (2020-2032) (USD Million)
10.4.13.2 Rest of Asia Pacific Particle Counter Market Estimates and Forecasts, by Application (2020-2032) (USD Million)
10.4.13.3 Rest of Asia Pacific Particle Counter Market Estimates and Forecasts, by Modality (2020-2032) (USD Million)
10.5 Middle East and Africa
10.5.1 Middle East
10.5.1.1 Trends Analysis
10.5.1.2 Middle East Particle Counter Market Estimates and Forecasts, by Country (2020-2032) (USD Million)
10.5.1.3 Middle East Particle Counter Market Estimates and Forecasts, by Product (2020-2032) (USD Million)
10.5.1.4 Middle East Particle Counter Market Estimates and Forecasts, by Application (2020-2032) (USD Million)
10.5.1.5 Middle East Particle Counter Market Estimates and Forecasts, by Modality (2020-2032) (USD Million)
10.5.1.6 UAE
10.5.1.6.1 UAE Particle Counter Market Estimates and Forecasts, by Product (2020-2032) (USD Million)
10.5.1.6.2 UAE Particle Counter Market Estimates and Forecasts, by Application (2020-2032) (USD Million)
10.5.1.6.3 UAE Particle Counter Market Estimates and Forecasts, by Modality (2020-2032) (USD Million)
10.5.1.7 Egypt
10.5.1.7.1 Egypt Particle Counter Market Estimates and Forecasts, by Product (2020-2032) (USD Million)
10.5.1.7.2 Egypt Particle Counter Market Estimates and Forecasts, by Application (2020-2032) (USD Million)
10.5.1.7.3 Egypt Particle Counter Market Estimates and Forecasts, by Modality (2020-2032) (USD Million)
10.5.1.8 Saudi Arabia
10.5.1.8.1 Saudi Arabia Particle Counter Market Estimates and Forecasts, by Product (2020-2032) (USD Million)
10.5.1.8.2 Saudi Arabia Particle Counter Market Estimates and Forecasts, by Application (2020-2032) (USD Million)
10.5.1.8.3 Saudi Arabia Particle Counter Market Estimates and Forecasts, by Modality (2020-2032) (USD Million)
10.5.1.9 Qatar
10.5.1.9.1 Qatar Particle Counter Market Estimates and Forecasts, by Product (2020-2032) (USD Million)
10.5.1.9.2 Qatar Particle Counter Market Estimates and Forecasts, by Application (2020-2032) (USD Million)
10.5.1.9.3 Qatar Particle Counter Market Estimates and Forecasts, by Modality (2020-2032) (USD Million)
10.5.1.10 Rest of Middle East
10.5.1.10.1 Rest of Middle East Particle Counter Market Estimates and Forecasts, by Product (2020-2032) (USD Million)
10.5.1.10.2 Rest of Middle East Particle Counter Market Estimates and Forecasts, by Application (2020-2032) (USD Million)
10.5.1.10.3 Rest of Middle East Particle Counter Market Estimates and Forecasts, by Modality (2020-2032) (USD Million)
10.5.2 Africa
10.5.2.1 Trends Analysis
10.5.2.2 Africa Particle Counter Market Estimates and Forecasts, by Country (2020-2032) (USD Million)
10.5.2.3 Africa Particle Counter Market Estimates and Forecasts, by Product (2020-2032) (USD Million)
10.5.2.4 Africa Particle Counter Market Estimates and Forecasts, by Application (2020-2032) (USD Million)
10.5.2.5 Africa Particle Counter Market Estimates and Forecasts, by Modality (2020-2032) (USD Million)
10.5.2.6 South Africa
10.5.2.6.1 South Africa Particle Counter Market Estimates and Forecasts, by Product (2020-2032) (USD Million)
10.5.2.6.2 South Africa Particle Counter Market Estimates and Forecasts, by Application (2020-2032) (USD Million)
10.5.2.6.3 South Africa Particle Counter Market Estimates and Forecasts, by Modality (2020-2032) (USD Million)
10.5.2.7 Nigeria
10.5.2.7.1 Nigeria Particle Counter Market Estimates and Forecasts, by Product (2020-2032) (USD Million)
10.5.2.7.2 Nigeria Particle Counter Market Estimates and Forecasts, by Application (2020-2032) (USD Million)
10.5.2.7.3 Nigeria Particle Counter Market Estimates and Forecasts, by Modality (2020-2032) (USD Million)
10.5.2.8 Rest of Africa
10.5.2.8.1 Rest of Africa Particle Counter Market Estimates and Forecasts, by Product (2020-2032) (USD Million)
10.5.2.8.2 Rest of Africa Particle Counter Market Estimates and Forecasts, by Application (2020-2032) (USD Million)
10.5.2.8.3 Rest of Africa Particle Counter Market Estimates and Forecasts, by Modality (2020-2032) (USD Million)
10.6 Latin America
10.6.1 Trends Analysis
10.6.2 Latin America Particle Counter Market Estimates and Forecasts, by Country (2020-2032) (USD Million)
10.6.3 Latin America Particle Counter Market Estimates and Forecasts, by Product (2020-2032) (USD Million)
10.6.4 Latin America Particle Counter Market Estimates and Forecasts, by Application (2020-2032) (USD Million)
10.6.5 Latin America Particle Counter Market Estimates and Forecasts, by Modality (2020-2032) (USD Million)
10.6.6 Brazil
10.6.6.1 Brazil Particle Counter Market Estimates and Forecasts, by Product (2020-2032) (USD Million)
10.6.6.2 Brazil Particle Counter Market Estimates and Forecasts, by Application (2020-2032) (USD Million)
10.6.6.3 Brazil Particle Counter Market Estimates and Forecasts, by Modality (2020-2032) (USD Million)
10.6.7 Argentina
10.6.7.1 Argentina Particle Counter Market Estimates and Forecasts, by Product (2020-2032) (USD Million)
10.6.7.2 Argentina Particle Counter Market Estimates and Forecasts, by Application (2020-2032) (USD Million)
10.6.7.3 Argentina Particle Counter Market Estimates and Forecasts, by Modality (2020-2032) (USD Million)
10.6.8 Colombia
10.6.8.1 Colombia Particle Counter Market Estimates and Forecasts, by Product (2020-2032) (USD Million)
10.6.8.2 Colombia Particle Counter Market Estimates and Forecasts, by Application (2020-2032) (USD Million)
10.6.8.3 Colombia Particle Counter Market Estimates and Forecasts, by Modality (2020-2032) (USD Million)
10.6.9 Rest of Latin America
10.6.9.1 Rest of Latin America Particle Counter Market Estimates and Forecasts, by Product (2020-2032) (USD Million)
10.6.9.2 Rest of Latin America Particle Counter Market Estimates and Forecasts, by Application (2020-2032) (USD Million)
10.6.9.3 Rest of Latin America Particle Counter Market Estimates and Forecasts, by Modality (2020-2032) (USD Million)
11. Company Profiles
11.1 Markus Klotz GmbH
11.1.1 Company Overview
11.1.2 Financial
11.1.3 Product / Services Offered
11.1.4 SWOT Analysis
11.2 Danaher (Beckman Coulter, Inc.)
11.2.1 Company Overview
11.2.2 Financial
11.2.3 Product / Services Offered
11.2.4 SWOT Analysis
11.3 RION Co., Ltd.
11.3.1 Company Overview
11.3.2 Financial
11.3.3 Product / Services Offered
11.3.4 SWOT Analysis
11.4 Fortive Corporation (Fluke Corporation and Setra Systems)
11.4.1 Company Overview
11.4.2 Financial
11.4.3 Product / Services Offered
11.4.4 SWOT Analysis
11.5 Lighthouse Worldwide Solutions
11.5.1 Company Overview
11.5.2 Financial
11.5.3 Product / Services Offered
11.5.4 SWOT Analysis
11.6 Spectris Plc
11.6.1 Company Overview
11.6.2 Financial
11.6.3 Product / Services Offered
11.6.4 SWOT Analysis
11.7 TSI Inc.
11.7.1 Company Overview
11.7.2 Financial
11.7.3 Product / Services Offered
11.7.4 SWOT Analysis
11.8 PAMAS Partikelmess
11.8.1 Company Overview
11.8.2 Financial
11.8.3 Product / Services Offered
11.8.4 SWOT Analysis
11.9 PCE Deutschland GmbH
11.9.1 Company Overview
11.9.2 Financial
11.9.3 Product / Services Offered
11.9.4 SWOT Analysis
11.10 Horiba Ltd.
11.10.1 Company Overview
11.10.2 Financial
11.10.3 Product / Services Offered
11.10.4 SWOT Analysis
12. Use Cases and Best Practices
13. Conclusion
An accurate research report requires proper strategizing as well as implementation. There are multiple factors involved in the completion of good and accurate research report and selecting the best methodology to compete the research is the toughest part. Since the research reports we provide play a crucial role in any company’s decision-making process, therefore we at SNS Insider always believe that we should choose the best method which gives us results closer to reality. This allows us to reach at a stage wherein we can provide our clients best and accurate investment to output ratio.
Each report that we prepare takes a timeframe of 350-400 business hours for production. Starting from the selection of titles through a couple of in-depth brain storming session to the final QC process before uploading our titles on our website we dedicate around 350 working hours. The titles are selected based on their current market cap and the foreseen CAGR and growth.
The 5 steps process:
Step 1: Secondary Research:
Secondary Research or Desk Research is as the name suggests is a research process wherein, we collect data through the readily available information. In this process we use various paid and unpaid databases which our team has access to and gather data through the same. This includes examining of listed companies’ annual reports, Journals, SEC filling etc. Apart from this our team has access to various associations across the globe across different industries. Lastly, we have exchange relationships with various university as well as individual libraries.

Step 2: Primary Research
When we talk about primary research, it is a type of study in which the researchers collect relevant data samples directly, rather than relying on previously collected data. This type of research is focused on gaining content specific facts that can be sued to solve specific problems. Since the collected data is fresh and first hand therefore it makes the study more accurate and genuine.
We at SNS Insider have divided Primary Research into 2 parts.
Part 1 wherein we interview the KOLs of major players as well as the upcoming ones across various geographic regions. This allows us to have their view over the market scenario and acts as an important tool to come closer to the accurate market numbers. As many as 45 paid and unpaid primary interviews are taken from both the demand and supply side of the industry to make sure we land at an accurate judgement and analysis of the market.
This step involves the triangulation of data wherein our team analyses the interview transcripts, online survey responses and observation of on filed participants. The below mentioned chart should give a better understanding of the part 1 of the primary interview.

Part 2: In this part of primary research the data collected via secondary research and the part 1 of the primary research is validated with the interviews from individual consultants and subject matter experts.
Consultants are those set of people who have at least 12 years of experience and expertise within the industry whereas Subject Matter Experts are those with at least 15 years of experience behind their back within the same space. The data with the help of two main processes i.e., FGDs (Focused Group Discussions) and IDs (Individual Discussions). This gives us a 3rd party nonbiased primary view of the market scenario making it a more dependable one while collation of the data pointers.
Step 3: Data Bank Validation
Once all the information is collected via primary and secondary sources, we run that information for data validation. At our intelligence centre our research heads track a lot of information related to the market which includes the quarterly reports, the daily stock prices, and other relevant information. Our data bank server gets updated every fortnight and that is how the information which we collected using our primary and secondary information is revalidated in real time.

Step 4: QA/QC Process
After all the data collection and validation our team does a final level of quality check and quality assurance to get rid of any unwanted or undesired mistakes. This might include but not limited to getting rid of the any typos, duplication of numbers or missing of any important information. The people involved in this process include technical content writers, research heads and graphics people. Once this process is completed the title gets uploader on our platform for our clients to read it.
Step 5: Final QC/QA Process:
This is the last process and comes when the client has ordered the study. In this process a final QA/QC is done before the study is emailed to the client. Since we believe in giving our clients a good experience of our research studies, therefore, to make sure that we do not lack at our end in any way humanly possible we do a final round of quality check and then dispatch the study to the client.
By Product
Airborne Particle Counters
Liquid Particle Counters
Others
By Application
Cleanroom Monitoring
Contamination Monitoring of Liquids
Aerosol Monitoring and Research
By Modality
Benchtop
Portable
Remote
Request for Segment Customization as per your Business Requirement: Segment Customization Request
Regional Coverage:
North America
US
Canada
Mexico
Europe
Eastern Europe
Poland
Romania
Hungary
Turkey
Rest of Eastern Europe
Western Europe
Germany
France
UK
Italy
Spain
Netherlands
Switzerland
Austria
Rest of Western Europe
Asia Pacific
China
India
Japan
South Korea
Vietnam
Singapore
Australia
Rest of Asia Pacific
Middle East & Africa
Middle East
UAE
Egypt
Saudi Arabia
Qatar
Rest of Middle East
Africa
Nigeria
South Africa
Rest of Africa
Latin America
Brazil
Argentina
Colombia
Rest of Latin America
Request for Country Level Research Report: Country Level Customization Request
Available Customization
With the given market data, SNS Insider offers customization as per the company’s specific needs. The following customization options are available for the report:
Detailed Volume Analysis
Criss-Cross segment analysis (e.g. Product X Application)
Competitive Product Benchmarking
Geographic Analysis
Additional countries in any of the regions
Customized Data Representation
Detailed analysis and profiling of additional market players
The Functional Service Providers (FSP) Market Size was valued at USD 14.68 billion in 2023, and is expected to reach USD 30.70 billion by 2032, and grow at a CAGR of 8.56% over the forecast period 2024-2032.
The Immunomodulators Market size was USD 224.17 Billion in 2023 and is expected to Reach USD 391.78 Billion by 2032 and grow at a CAGR of 6.4% over the forecast period of 2024-2032.
Therapeutic Bed Market Size was valued at USD 4.65 Billion in 2023 and is expected to reach USD 7.19 Billion by 2032, growing at a CAGR of 4.98% over the forecast period 2024-2032.
The Patient Registry Software Market Size was valued at USD 1.75 Billion in 2023 and is expected to reach USD 5.23 Billion by 2032, growing at a CAGR of 12.93% over the forecast period of 2024-2032.
The global palliative care market size was USD 10.7 billion in 2023 and is anticipated to grow at a CAGR of 9.06% to reach USD 23.34 Billion by 2032.
The Tissue Engineering Market was valued at USD 16.8 Billion in 2023 and will reach USD 56.2 Billion by 2032, with a CAGR of 14.3% from 2024-2032.

Hi! Click one of our member below to chat on Phone
© 2025 All Rights Reserved by SNS Insider Pvt Ltd


