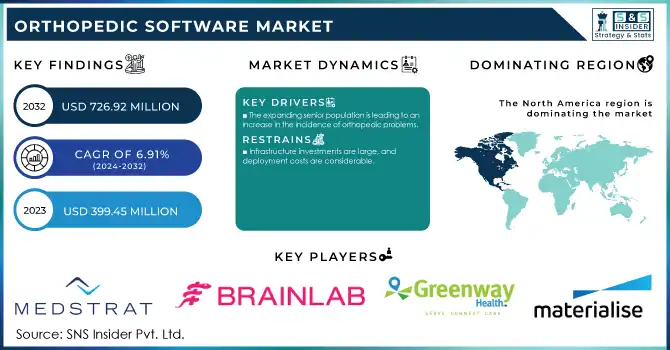
Orthopedic Software Market Size was valued at USD 384.2 million in 2023 and is expected to reach USD 710.2 million by 2032, growing at a CAGR of 7.1% over the forecast period 2024-2032.
The orthopedic software market report provides the key statistical insights and trends shaping the industry. It covers adoption rates across hospitals, clinics, and independent practitioners, along with user demographics by provider type. This report focuses on the orthopedic software overview and its integration with imaging systems (PACS, EHRs, 3D imaging) for improving diagnostic and surgical planning. It further compares the trends in regulatory compliance, and status with regard to compliance with standards (FDA, HIPAA and MDR (EU)). The rising impact of AI and automation is also analyzed, highlighting AI-driven diagnostics, automated treatment planning, and predictive analytics adoption. These insights provide a comprehensive understanding of the orthopedic software market, helping stakeholders navigate technological advancements and regulatory landscapes.
Get more information on Orthopedic Software Market - Request Sample Report
Drivers
An increasing number of individuals are affected by orthopedic disorders, such as osteoarthritis
and osteoporosis, leading to a higher demand for effective software solutions to manage these conditions.
The growing incidence of orthopedic diseases is the key factor driving the growth of the orthopedic software market. Low back pain, osteoarthritis, and rheumatoid arthritis are among the globally leading causes of disability affecting more than 1.71 billion people living with musculoskeletal disorders. Low back pain, in particular, is the most prevalent condition, with approximately 570 million suffering worldwide, and the top cause of disability. Musculoskeletal diseases impose a major burden in India. Rheumatoid arthritis is a chronic disorder that affects approximately 0.5–1% of the adult population, more commonly women. However, osteoarthritis, especially of the knee, is even more common and affects 22% – 39% of those over the age of 50 years.
The demand for joint replacement surgeries is also rising. The average age of hip and knee replacement patients in the United States is dropping, and growing numbers of patients in their 40s are now having these procedures done. This trend is believed to be driven by the growing life expectancy and demand for staying active in middle age. Moreover, the incidence of sports-related orthopedic injuries among older adults is expected to increase considerably. These injuries are expected to rise by 123% from 2021 to 2040, showing a clear need for effective management and treatment. These figures highlight the growing need for high-level orthopedic care. Due to the growing burden of musculoskeletal disorders, orthopedic software solutions are invaluable in organizing patient information, treatment planning, and improving overall outcomes.
Restraints
The substantial expenses associated with deploying orthopedic software systems can deter
healthcare providers from adoption.
The high costs associated with orthopedic software systems are hindering their adoption among healthcare providers. Such expenses include licensing fees, hardware upgrades, and extensive staff training. For instance, the Centers for Medicare & Medicaid Services (CMS) estimates that the average cost for a small hospital to implement an Electronic Health Record (EHR) system is around USD 15 million. These large financial needs can be a barrier for smaller healthcare organizations with tight budgets. Moreover, the maintenance and updates of these systems remain ever costly, making the return on investment hard to justify for many institutions. Such systems are an additional expense, which only heightens the already present anxiety over the return on investment since the advantages of these kinds of solutions are not always apparent at once. As a result, while orthopedic software solutions could facilitate better patient care and operational efficiency, the high initial and recurring expenses prevent many healthcare providers from adopting them.
Opportunities
Incorporating AI and ML into orthopedic software enhances diagnostic accuracy and enables
personalized treatment planning, presenting significant growth prospects.
Artificial Intelligence (AI) and Machine Learning (ML) are increasingly integrated into orthopedic software, enabling accurate reviews of large pools of patient cases to improve care through better diagnostic accuracy and customized treatment plans. The recent progress emphasizes the disruptive nature of these technologies. On the other hand, NHS Scotland launched an AI virtual physiotherapist called “Kirsty” to help patients suffering from back pain. This service allows nearly one million residents in the Lothians to book same-day appointments, bypassing traditional waiting times. The AI, which was developed by Flok Health, runs therapy sessions over a phone app and suggests personalized therapeutic exercises. Initial feedback indicates significant improvements in patient conditions compared to conventional physiotherapy methods.
In Germany, hospitals are leveraging AI to enhance diagnostic precision. For example, radiologists in Minden are using an AI system from Siemens Healthineers to probe X-ray images, discovering cancerous tumors that had been missed by human review. Such AI applications are not only enhancing diagnostic precision but are also speeding up detection which paves the way to timely interventions. Additionally, AI has also been used by researchers at the University of Illinois Urbana-Champaign to create materials that mimic biology for bone regeneration. Inspired by the porous structures of termite mounds, these 3D-printed microstructures adapt to the mechanical demands of bone, potentially revolutionizing prosthetics and orthopedic restoration by closely mimicking natural bone properties. These serve as examples of the growing application of AI and ML in orthopaedics and how it can represent the future by enabling accurate diagnoses, personalised interventions, and novel solutions for complex medical challenges.
Challenges
Some healthcare professionals are hesitant to transition from traditional methods to digital solutions due
to concerns about workflow disruptions and data security.
Various hurdles associated with the orthopedic software market are restricting the market from adapting to orthopedic software services on a larger scale. One of the biggest challenges is that orthopedic professionals are hesitant to adopt digital solutions largely due to fears around data privacy and security. Adding to this apprehension is the existing expense attached to deploying these software systems, which is not limited to just the infrastructure and training but the service as well. These financial challenges disproportionately weigh on smaller practices and clinics, making it difficult to adapt technologies. Moreover, skilled and trained professionals trained to use orthopedic software are rare, which drives another hindrance to its adoption in clinical workflows. These hurdles contribute to delayed adoption of orthopedic software solutions while their benefits of improved patient care and operational efficiency are evident.
By Product
The orthopedic EHR accounted for the largest revenue share of 26% in 2023. Reasons for this supremacy include the rise in the number of digital health solution adoptions and the federal government's requirement towards EHR implementing. According to the Centers for Medicare & Medicaid Services (CMS), as of 2023, more than 95% of all eligible and critical access hospitals have implemented certified health IT. Orthopedic EHRs provide many advantages like, better patient care coordination, advancing clinical decision support, and enabling workflow management. They allow orthopedic practices to easily maintain patient profiles, monitor progress, and access the information that other healthcare providers have made regarding the patient. The integration of advanced features like artificial intelligence and machine learning in orthopedic EHRs further enhances their capabilities, contributing to their market dominance. Moreover, the increasing emphasis on value-based care models and the need for holistic patient data management in orthopedic practices have further boosted the adoption of orthopedic EHR solutions. Another key factor that is driving the adoption of orthopedic EHRs is an increase in the emphasis on interoperability and data exchange in healthcare. The growing push for interoperability spearheaded by government initiatives, including the ONC Interoperability Standards Advisory, has created a framework for interoperability that has spurred adoption of EHRs in orthopedic practices.
By Mode Of Delivery
In 2023, Web/cloud-based software had the largest revenue share of 85%. There are a few primary reasons as to why they have that significant of a market share. The cloud-based solutions offer both scalability and flexibility, making them an appealing choice for organizations adopting them. More than 75% of hospitals across the United States have adopted cloud-based health IT infrastructure, as of the data from 2023 as per the Office of the National Coordinator for Health Information Technology (ONC). The orthopedic software oversees the solutions of cloud technology which helps you to access patient data from various locations that assists the healthcare professionals to collaborate with patients as well as each other leading to an increase in the overall patient care. Additionally, these solutions often require lower upfront costs and reduced IT maintenance, making them more cost-effective for healthcare organizations.
By Application
Orthopedic surgery segment held the highest revenue generating segment in the market with a revenue share of 55% in 2023. The reason that orthopedic growth is dominating is due to the rising cases of orthopedic injuries or diseases and also the need for better surgical planning and execution tools. More than 7 million orthopedic surgeries are performed in the United States each year, American Academy of Orthopaedic Surgeons (AAOS) Orthopedic surgery software is essential for pre-operative planning, intraoperative guidance, and postoperative follow-up, and directly related to better surgical outcomes and patient satisfaction. The orthopedic-specific software and they both provide 3D modeling, virtual surgical planning, and real-time navigation capabilities, improving precision and efficiency in the operating room.
The increased need for minimally invasive surgeries (MIS) has also been a major factor driving the growth of the global orthopedic surgery software market. According to the U.S. Food and Drug Administration (FDA), the last decade has witnessed a dramatic rise in the clearance of robotic-assisted surgical devices for orthopedic uses, suggesting advancement in surgical technologies. Orthopedic surgery software that works in conjunction with these robotic systems enables to offering of enhanced vistas and control to surgeons during the procedure, which translates to enhanced clinical outcomes and quicker recovery from the surgery. Additionally, the aging population and the subsequent increase in age-related orthopedic conditions have contributed to the growth of this segment.
By End-user
In 2023, the hospitals segment accounted for the largest revenue share 55% in the market. The dominance can be driven by due to their extensive adoption of advanced technologies to improve patient care. Hospitals benefit from integrated systems that manage patient records, surgical planning, and postoperative follow-ups efficiently. In the U.S., hospital spending on health IT solutions increased significantly following federal incentives under programs like the Medicare EHR Incentive Program. Moreover, hospitals often serve as centers for innovation and training, further driving their dominance in adopting orthopedic software solutions.
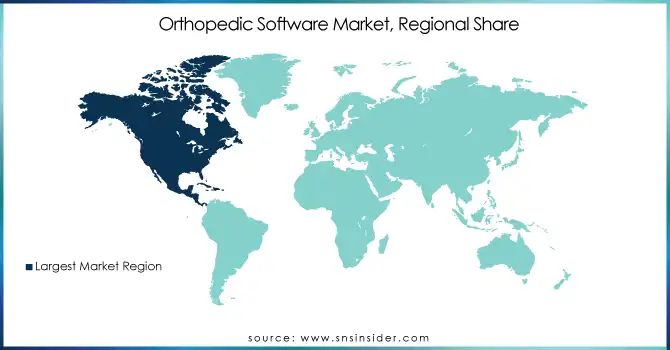
In 2023, North America held the largest orthopedic software market share of 42%. This dominance of North America can be justified by the well-established healthcare infrastructure, early adoption of digital health technology, and high healthcare expenditure in the region. In 2023, U.S. healthcare expenditures total USD 4.3 trillion or 18.3% of the U.S. gross domestic product (GDP), according to the Centers for Medicare & Medicaid Services (CMS). The region's leadership in medical research and innovation also contributes to its market dominance, with numerous orthopedic software companies based in North America.
The orthopedic software market is projected to grow at a fastest compound annual growth rate (CAGR) from 2024 to 2032. The region is witnessing this growth due to factors such as increased healthcare spending with growing awareness of digital health solutions and government steps to modernize their healthcare systems. The aforementioned factor is expected to increase the penetration of orthopedic software in India owing to the development of a comprehensive digital health ecosystem under National Digital Health Mission, launched by the Indian Government. Additionally, the significant population base in countries such as China and India, combined with the increasing incidence of orthopedic disorders associated with aging populations and changing lifestyles, adds to the growth potential within the region. The World Health Organization (WHO) estimates that by 2050, 1 in 4 people in Asia-Pacific will be over 60 years old, indicating a growing need for orthopedic care and associated software solutions.
Need any customization research on Orthopedic Software Market - Enquiry Now
Key Service Providers/Manufacturers
Koninklijke DSM N.V.
DuPont
BASF SE
Corbion N.V.
Cargill, Inc.
Novozymes A/S
Ginkgo Bioworks
Biocon Limited
Amyris, Inc.
Evonik Industries AG
Key Users
Unilever
Procter & Gamble
Nestlé
L'Oréal
Pfizer Inc.
GlaxoSmithKline plc
AstraZeneca plc
Johnson & Johnson
The Coca-Cola Company
PepsiCo, Inc.
In March 2023, Stryker targeted an advanced robotic-assisted surgery system, the Mako Total Knee 2.0, which optimizes orthopedic surgical procedures with the current trend of less invasive surgeries.
| Report Attributes | Details |
|---|---|
|
Market Size in 2023 |
USD 384.2 Million |
|
Market Size by 2032 |
USD 710.2 Million |
|
CAGR |
CAGR of 7.1% From 2024 to 2032 |
|
Base Year |
2023 |
|
Forecast Period |
2024-2032 |
|
Historical Data |
2020-2022 |
|
Report Scope & Coverage |
Market Size, Segments Analysis, Competitive Landscape, Regional Analysis, DROC & SWOT Analysis, Forecast Outlook |
|
Key Segments |
• By Product (Digital Templating/Preoperative Planning Software, Orthopedic HER, Orthopedic RCM, Orthopedic Practice Management, Orthopedic PACS, Others) |
|
Regional Analysis/Coverage |
North America (US, Canada, Mexico), Europe (Eastern Europe [Poland, Romania, Hungary, Turkey, Rest of Eastern Europe] Western Europe] Germany, France, UK, Italy, Spain, Netherlands, Switzerland, Austria, Rest of Western Europe]), Asia Pacific (China, India, Japan, South Korea, Vietnam, Singapore, Australia, Rest of Asia Pacific), Middle East & Africa (Middle East [UAE, Egypt, Saudi Arabia, Qatar, Rest of Middle East], Africa [Nigeria, South Africa, Rest of Africa], Latin America (Brazil, Argentina, Colombia, Rest of Latin America) |
|
Company Profiles |
Koninklijke DSM N.V., DuPont, BASF SE, Corbion N.V., Cargill, Inc., Novozymes A/S, Ginkgo Bioworks, Biocon Limited, Amyris, Inc., Evonik Industries AG |
Ans. The projected market size for the Orthopedic Software Market is USD 710.2 million by 2032.
Ans: The North American region dominated the Orthopedic Software Market in 2023.
Ans. The CAGR of the Orthopedic Software Market is 7.1% During the forecast period of 2024-2032.
Ans: The key trends and statistical insights we providing are,
Ans: The Web/Cloud Based Mode Of Delivery segment dominated the Orthopedic Software Market
1. Introduction
1.1 Market Definition
1.2 Scope (Inclusion and Exclusions)
1.3 Research Assumptions
2. Executive Summary
2.1 Market Overview
2.2 Regional Synopsis
2.3 Competitive Summary
3. Research Methodology
3.1 Top-Down Approach
3.2 Bottom-up Approach
3.3. Data Validation
3.4 Primary Interviews
4. Market Dynamics Impact Analysis
4.1 Market Driving Factors Analysis
4.1.1 Drivers
4.1.2 Restraints
4.1.3 Opportunities
4.1.4 Challenges
4.2 PESTLE Analysis
4.3 Porter’s Five Forces Model
5. Statistical Insights and Trends Reporting
5.1 User Demographics, By Healthcare Provider Type (2023)
5.2 Integration with Medical Devices & Imaging Systems (2023-2025)
5.3 Regulatory Compliance Trends (2023-2025)
5.4 AI & Automation in Orthopedic Software (2023-2026)
6. Competitive Landscape
6.1 List of Major Companies, By Region
6.2 Market Share Analysis, By Region
6.3 Product Benchmarking
6.3.1 Product specifications and features
6.3.2 Pricing
6.4 Strategic Initiatives
6.4.1 Marketing and promotional activities
6.4.2 Distribution and Supply Chain Strategies
6.4.3 Expansion plans and new product launches
6.4.4 Strategic partnerships and collaborations
6.5 Technological Advancements
6.6 Market Positioning and Branding
7. Orthopedic Software Market Segmentation, By Product
7.1 Chapter Overview
7.2 Digital Templating/Preoperative Planning Software
7.2.1 Digital Templating/Preoperative Planning Software Market Trends Analysis (2020-2032)
7.2.2 Digital Templating/Preoperative Planning Software Market Size Estimates and Forecasts to 2032 (USD Million)
7.3 Orthopedic EHR
7.3.1 Orthopedic EHR Market Trends Analysis (2020-2032)
7.3.2 Orthopedic EHR Market Size Estimates and Forecasts to 2032 (USD Million)
7.4 Orthopedic RCM
7.4.1 Orthopedic RCM Market Trends Analysis (2020-2032)
7.4.2 Orthopedic RCM Market Size Estimates and Forecasts to 2032 (USD Million)
7.5 Orthopedic Practice Management
7.5.1 Orthopedic Practice Management Market Trends Analysis (2020-2032)
7.5.2 Orthopedic Practice Management Market Size Estimates and Forecasts to 2032 (USD Million)
7.6 Orthopedic PACS
7.6.1 Orthopedic PACS Market Trends Analysis (2020-2032)
7.6.2 Orthopedic PACS Market Size Estimates and Forecasts to 2032 (USD Million)
7.7 Others
7.7.1 Others Market Trends Analysis (2020-2032)
7.7.2 Others Market Size Estimates and Forecasts to 2032 (USD Million)
8. Orthopedic Software Market Segmentation, By Application
8.1 Chapter Overview
8.2 Orthopedic Surgeries
8.2.1 Orthopedic Surgeries Market Trends Analysis (2020-2032)
8.2.2 Orthopedic Surgeries Market Size Estimates and Forecasts to 2032 (USD Million)
8.3 Fracture Management
8.3.1 Fracture Management Market Trends Analysis (2020-2032)
8.3.2 Fracture Management Market Size Estimates and Forecasts to 2032 (USD Million)
8.2 Others
8.2.1 Others Market Trends Analysis (2020-2032)
8.2.2 Others Market Size Estimates and Forecasts to 2032 (USD Million)
9. Orthopedic Software Market Segmentation, By Mode of Delivery
9.1 Chapter Overview
9.2 Web/Cloud Based
9.2.1 Web/Cloud Based Market Trends Analysis (2020-2032)
9.2.2 Web/Cloud Based Market Size Estimates and Forecasts to 2032 (USD Million)
9.3 On-Premise
9.3.1 On-Premise Market Trends Analysis (2020-2032)
9.3.2 On-Premise Market Size Estimates and Forecasts to 2032 (USD Million)
10. Orthopedic Software Market Segmentation, By End Users
10.1 Chapter Overview
10.2 Hospitals
10.2.1 Hospitals Market Trends Analysis (2020-2032)
10.2.2 Hospitals Market Size Estimates and Forecasts to 2032 (USD Million)
10.3 Ambulatory Care centers
10.3.1 Ambulatory Care centers Market Trends Analysis (2020-2032)
10.3.2 Ambulatory Care centers Market Size Estimates and Forecasts to 2032 (USD Million)
10.4 Others
10.4.1 Others Market Trends Analysis (2020-2032)
10.4.2 Others Market Size Estimates and Forecasts to 2032 (USD Million)
11. Regional Analysis
11.1 Chapter Overview
11.2 North America
11.2.1 Trends Analysis
11.2.2 North America Orthopedic Software Market Estimates and Forecasts, by Country (2020-2032) (USD Million)
11.2.3 North America Orthopedic Software Market Estimates and Forecasts, By Product (2020-2032) (USD Million)
11.2.4 North America Orthopedic Software Market Estimates and Forecasts, By Application (2020-2032) (USD Million)
11.2.5 North America Orthopedic Software Market Estimates and Forecasts, By Mode of Delivery (2020-2032) (USD Million)
11.2.6 North America Orthopedic Software Market Estimates and Forecasts, By End Users (2020-2032) (USD Million)
11.2.7 USA
11.2.7.1 USA Orthopedic Software Market Estimates and Forecasts, By Product (2020-2032) (USD Million)
11.2.7.2 USA Orthopedic Software Market Estimates and Forecasts, By Application (2020-2032) (USD Million)
11.2.7.3 USA Orthopedic Software Market Estimates and Forecasts, By Mode of Delivery (2020-2032) (USD Million)
11.2.7.4 USA Orthopedic Software Market Estimates and Forecasts, By End Users (2020-2032) (USD Million)
11.2.7 Canada
11.2.7.1 Canada Orthopedic Software Market Estimates and Forecasts, By Product (2020-2032) (USD Million)
11.2.7.2 Canada Orthopedic Software Market Estimates and Forecasts, By Application (2020-2032) (USD Million)
11.2.7.3 Canada Orthopedic Software Market Estimates and Forecasts, By Mode of Delivery (2020-2032) (USD Million)
11.2.7.3 Canada Orthopedic Software Market Estimates and Forecasts, By End Users (2020-2032) (USD Million)
11.2.8 Mexico
11.2.8.1 Mexico Orthopedic Software Market Estimates and Forecasts, By Product (2020-2032) (USD Million)
11.2.8.2 Mexico Orthopedic Software Market Estimates and Forecasts, By Application (2020-2032) (USD Million)
11.2.8.3 Mexico Orthopedic Software Market Estimates and Forecasts, By Mode of Delivery (2020-2032) (USD Million)
11.2.8.3 Mexico Orthopedic Software Market Estimates and Forecasts, By End Users (2020-2032) (USD Million)
11.3 Europe
11.3.1 Eastern Europe
11.3.1.1 Trends Analysis
11.3.1.2 Eastern Europe Orthopedic Software Market Estimates and Forecasts, by Country (2020-2032) (USD Million)
11.3.1.3 Eastern Europe Orthopedic Software Market Estimates and Forecasts, By Product (2020-2032) (USD Million)
11.3.1.4 Eastern Europe Orthopedic Software Market Estimates and Forecasts, By Application (2020-2032) (USD Million)
11.3.1.5 Eastern Europe Orthopedic Software Market Estimates and Forecasts, By Mode of Delivery (2020-2032) (USD Million)
11.3.1.5 Eastern Europe Orthopedic Software Market Estimates and Forecasts, By End Users (2020-2032) (USD Million)
11.3.1.6 Poland
11.3.1.6.1 Poland Orthopedic Software Market Estimates and Forecasts, By Product (2020-2032) (USD Million)
11.3.1.6.2 Poland Orthopedic Software Market Estimates and Forecasts, By Application (2020-2032) (USD Million)
11.3.1.6.3 Poland Orthopedic Software Market Estimates and Forecasts, By Mode of Delivery (2020-2032) (USD Million)
11.3.1.6.3 Poland Orthopedic Software Market Estimates and Forecasts, By End Users (2020-2032) (USD Million)
11.3.1.7 Romania
11.3.1.7.1 Romania Orthopedic Software Market Estimates and Forecasts, By Product (2020-2032) (USD Million)
11.3.1.7.2 Romania Orthopedic Software Market Estimates and Forecasts, By Application (2020-2032) (USD Million)
11.3.1.7.3 Romania Orthopedic Software Market Estimates and Forecasts, By Mode of Delivery (2020-2032) (USD Million)
11.3.1.7.3 Romania Orthopedic Software Market Estimates and Forecasts, By End Users (2020-2032) (USD Million)
11.3.1.8 Hungary
11.3.1.8.1 Hungary Orthopedic Software Market Estimates and Forecasts, By Product (2020-2032) (USD Million)
11.3.1.8.2 Hungary Orthopedic Software Market Estimates and Forecasts, By Application (2020-2032) (USD Million)
11.3.1.8.3 Hungary Orthopedic Software Market Estimates and Forecasts, By Mode of Delivery (2020-2032) (USD Million)
11.3.1.8.3 Hungary Orthopedic Software Market Estimates and Forecasts, By End Users (2020-2032) (USD Million)
11.3.1.9 Turkey
11.3.1.9.1 Turkey Orthopedic Software Market Estimates and Forecasts, By Product (2020-2032) (USD Million)
11.3.1.9.2 Turkey Orthopedic Software Market Estimates and Forecasts, By Application (2020-2032) (USD Million)
11.3.1.9.3 Turkey Orthopedic Software Market Estimates and Forecasts, By Mode of Delivery (2020-2032) (USD Million)
11.3.1.9.3 Turkey Orthopedic Software Market Estimates and Forecasts, By End Users (2020-2032) (USD Million)
11.3.1.11 Rest of Eastern Europe
11.3.1.11.1 Rest of Eastern Europe Orthopedic Software Market Estimates and Forecasts, By Product (2020-2032) (USD Million)
11.3.1.11.2 Rest of Eastern Europe Orthopedic Software Market Estimates and Forecasts, By Application (2020-2032) (USD Million)
11.3.1.11.3 Rest of Eastern Europe Orthopedic Software Market Estimates and Forecasts, By Mode of Delivery (2020-2032) (USD Million)
11.3.1.11.3 Rest of Eastern Europe Orthopedic Software Market Estimates and Forecasts, By End Users (2020-2032) (USD Million)
11.3.2 Western Europe
11.3.2.1 Trends Analysis
11.3.2.2 Western Europe Orthopedic Software Market Estimates and Forecasts, by Country (2020-2032) (USD Million)
11.3.2.3 Western Europe Orthopedic Software Market Estimates and Forecasts, By Product (2020-2032) (USD Million)
11.3.2.4 Western Europe Orthopedic Software Market Estimates and Forecasts, By Application (2020-2032) (USD Million)
11.3.2.5 Western Europe Orthopedic Software Market Estimates and Forecasts, By Mode of Delivery (2020-2032) (USD Million)
11.3.2.5 Western Europe Orthopedic Software Market Estimates and Forecasts, By End Users (2020-2032) (USD Million)
11.3.2.6 Germany
11.3.2.6.1 Germany Orthopedic Software Market Estimates and Forecasts, By Product (2020-2032) (USD Million)
11.3.2.6.2 Germany Orthopedic Software Market Estimates and Forecasts, By Application (2020-2032) (USD Million)
11.3.2.6.3 Germany Orthopedic Software Market Estimates and Forecasts, By Mode of Delivery (2020-2032) (USD Million)
11.3.2.6.3 Germany Orthopedic Software Market Estimates and Forecasts, By End Users (2020-2032) (USD Million)
11.3.2.7 France
11.3.2.7.1 France Orthopedic Software Market Estimates and Forecasts, By Product (2020-2032) (USD Million)
11.3.2.7.2 France Orthopedic Software Market Estimates and Forecasts, By Application (2020-2032) (USD Million)
11.3.2.7.3 France Orthopedic Software Market Estimates and Forecasts, By Mode of Delivery (2020-2032) (USD Million)
11.3.2.7.3 France Orthopedic Software Market Estimates and Forecasts, By End Users (2020-2032) (USD Million)
11.3.2.8 UK
11.3.2.8.1 UK Orthopedic Software Market Estimates and Forecasts, By Product (2020-2032) (USD Million)
11.3.2.8.2 UK Orthopedic Software Market Estimates and Forecasts, By Application (2020-2032) (USD Million)
11.3.2.8.3 UK Orthopedic Software Market Estimates and Forecasts, By Mode of Delivery (2020-2032) (USD Million)
11.3.2.8.3 UK Orthopedic Software Market Estimates and Forecasts, By End Users (2020-2032) (USD Million)
11.3.2.9 Italy
11.3.2.9.1 Italy Orthopedic Software Market Estimates and Forecasts, By Product (2020-2032) (USD Million)
11.3.2.9.2 Italy Orthopedic Software Market Estimates and Forecasts, By Application (2020-2032) (USD Million)
11.3.2.9.3 Italy Orthopedic Software Market Estimates and Forecasts, By Mode of Delivery (2020-2032) (USD Million)
11.3.2.9.3 Italy Orthopedic Software Market Estimates and Forecasts, By End Users (2020-2032) (USD Million)
11.3.2.11 Spain
11.3.2.11.1 Spain Orthopedic Software Market Estimates and Forecasts, By Product (2020-2032) (USD Million)
11.3.2.11.2 Spain Orthopedic Software Market Estimates and Forecasts, By Application (2020-2032) (USD Million)
11.3.2.11.3 Spain Orthopedic Software Market Estimates and Forecasts, By Mode of Delivery (2020-2032) (USD Million)
11.3.2.11.3 Spain Orthopedic Software Market Estimates and Forecasts, By End Users (2020-2032) (USD Million)
11.3.2.11 Netherlands
11.3.2.11.1 Netherlands Orthopedic Software Market Estimates and Forecasts, By Product (2020-2032) (USD Million)
11.3.2.11.2 Netherlands Orthopedic Software Market Estimates and Forecasts, By Application (2020-2032) (USD Million)
11.3.2.11.3 Netherlands Orthopedic Software Market Estimates and Forecasts, By Mode of Delivery (2020-2032) (USD Million)
11.3.2.11.3 Netherlands Orthopedic Software Market Estimates and Forecasts, By End Users (2020-2032) (USD Million)
11.3.2.12 Switzerland
11.3.2.12.1 Switzerland Orthopedic Software Market Estimates and Forecasts, By Product (2020-2032) (USD Million)
11.3.2.12.2 Switzerland Orthopedic Software Market Estimates and Forecasts, By Application (2020-2032) (USD Million)
11.3.2.12.3 Switzerland Orthopedic Software Market Estimates and Forecasts, By Mode of Delivery (2020-2032) (USD Million)
11.3.2.12.3 Switzerland Orthopedic Software Market Estimates and Forecasts, By End Users (2020-2032) (USD Million)
11.3.2.13 Austria
11.3.2.13.1 Austria Orthopedic Software Market Estimates and Forecasts, By Product (2020-2032) (USD Million)
11.3.2.13.2 Austria Orthopedic Software Market Estimates and Forecasts, By Application (2020-2032) (USD Million)
11.3.2.13.3 Austria Orthopedic Software Market Estimates and Forecasts, By Mode of Delivery (2020-2032) (USD Million)
11.3.2.13.3 Austria Orthopedic Software Market Estimates and Forecasts, By End Users (2020-2032) (USD Million)
11.3.2.14 Rest of Western Europe
11.3.2.14.1 Rest of Western Europe Orthopedic Software Market Estimates and Forecasts, By Product (2020-2032) (USD Million)
11.3.2.14.2 Rest of Western Europe Orthopedic Software Market Estimates and Forecasts, By Application (2020-2032) (USD Million)
11.3.2.14.3 Rest of Western Europe Orthopedic Software Market Estimates and Forecasts, By Mode of Delivery (2020-2032) (USD Million)
11.3.2.14.3 Rest of Western Europe Orthopedic Software Market Estimates and Forecasts, By End Users (2020-2032) (USD Million)
11.4 Asia Pacific
11.4.1 Trends Analysis
11.4.2 Asia Pacific Orthopedic Software Market Estimates and Forecasts, by Country (2020-2032) (USD Million)
11.4.3 Asia Pacific Orthopedic Software Market Estimates and Forecasts, By Product (2020-2032) (USD Million)
11.4.4 Asia Pacific Orthopedic Software Market Estimates and Forecasts, By Application (2020-2032) (USD Million)
11.4.5 Asia Pacific Orthopedic Software Market Estimates and Forecasts, By Mode of Delivery (2020-2032) (USD Million)
11.4.5 Asia Pacific Orthopedic Software Market Estimates and Forecasts, By End Users (2020-2032) (USD Million)
11.4.6 China
11.4.6.1 China Orthopedic Software Market Estimates and Forecasts, By Product (2020-2032) (USD Million)
11.4.6.2 China Orthopedic Software Market Estimates and Forecasts, By Application (2020-2032) (USD Million)
11.4.6.3 China Orthopedic Software Market Estimates and Forecasts, By Mode of Delivery (2020-2032) (USD Million)
11.4.6.3 China Orthopedic Software Market Estimates and Forecasts, By End Users (2020-2032) (USD Million)
11.4.7 India
11.4.7.1 India Orthopedic Software Market Estimates and Forecasts, By Product (2020-2032) (USD Million)
11.4.7.2 India Orthopedic Software Market Estimates and Forecasts, By Application (2020-2032) (USD Million)
11.4.7.3 India Orthopedic Software Market Estimates and Forecasts, By Mode of Delivery (2020-2032) (USD Million)
11.4.7.3 India Orthopedic Software Market Estimates and Forecasts, By End Users (2020-2032) (USD Million)
11.4.8 Japan
11.4.8.1 Japan Orthopedic Software Market Estimates and Forecasts, By Product (2020-2032) (USD Million)
11.4.8.2 Japan Orthopedic Software Market Estimates and Forecasts, By Application (2020-2032) (USD Million)
11.4.8.3 Japan Orthopedic Software Market Estimates and Forecasts, By Mode of Delivery (2020-2032) (USD Million)
11.4.8.3 Japan Orthopedic Software Market Estimates and Forecasts, By End Users (2020-2032) (USD Million)
11.4.9 South Korea
11.4.9.1 South Korea Orthopedic Software Market Estimates and Forecasts, By Product (2020-2032) (USD Million)
11.4.9.2 South Korea Orthopedic Software Market Estimates and Forecasts, By Application (2020-2032) (USD Million)
11.4.9.3 South Korea Orthopedic Software Market Estimates and Forecasts, By Mode of Delivery (2020-2032) (USD Million)
11.4.9.3 South Korea Orthopedic Software Market Estimates and Forecasts, By End Users (2020-2032) (USD Million)
11.4.11 Vietnam
11.4.11.1 Vietnam Orthopedic Software Market Estimates and Forecasts, By Product (2020-2032) (USD Million)
11.4.11.2 Vietnam Orthopedic Software Market Estimates and Forecasts, By Application (2020-2032) (USD Million)
11.4.11.3 Vietnam Orthopedic Software Market Estimates and Forecasts, By Mode of Delivery (2020-2032) (USD Million)
11.4.11.3 Vietnam Orthopedic Software Market Estimates and Forecasts, By End Users (2020-2032) (USD Million)
11.4.11 Singapore
11.4.11.1 Singapore Orthopedic Software Market Estimates and Forecasts, By Product (2020-2032) (USD Million)
11.4.11.2 Singapore Orthopedic Software Market Estimates and Forecasts, By Application (2020-2032) (USD Million)
11.4.11.3 Singapore Orthopedic Software Market Estimates and Forecasts, By Mode of Delivery (2020-2032) (USD Million)
11.4.11.3 Singapore Orthopedic Software Market Estimates and Forecasts, By End Users (2020-2032) (USD Million)
11.4.12 Australia
11.4.12.1 Australia Orthopedic Software Market Estimates and Forecasts, By Product (2020-2032) (USD Million)
11.4.12.2 Australia Orthopedic Software Market Estimates and Forecasts, By Application (2020-2032) (USD Million)
11.4.12.3 Australia Orthopedic Software Market Estimates and Forecasts, By Mode of Delivery (2020-2032) (USD Million)
11.4.12.3 Australia Orthopedic Software Market Estimates and Forecasts, By End Users (2020-2032) (USD Million)
11.4.13 Rest of Asia Pacific
11.4.13.1 Rest of Asia Pacific Orthopedic Software Market Estimates and Forecasts, By Product (2020-2032) (USD Million)
11.4.13.2 Rest of Asia Pacific Orthopedic Software Market Estimates and Forecasts, By Application (2020-2032) (USD Million)
11.4.13.3 Rest of Asia Pacific Orthopedic Software Market Estimates and Forecasts, By Mode of Delivery (2020-2032) (USD Million)
11.4.13.3 Rest of Asia Pacific Orthopedic Software Market Estimates and Forecasts, By End Users (2020-2032) (USD Million)
11.5 Middle East and Africa
11.5.1 Middle East
11.5.1.1 Trends Analysis
11.5.1.2 Middle East Orthopedic Software Market Estimates and Forecasts, by Country (2020-2032) (USD Million)
11.5.1.3 Middle East Orthopedic Software Market Estimates and Forecasts, By Product (2020-2032) (USD Million)
11.5.1.4 Middle East Orthopedic Software Market Estimates and Forecasts, By Application (2020-2032) (USD Million)
11.5.1.5 Middle East Orthopedic Software Market Estimates and Forecasts, By Mode of Delivery (2020-2032) (USD Million)
11.5.1.5 Middle East Orthopedic Software Market Estimates and Forecasts, By End Users (2020-2032) (USD Million)
11.5.1.6 UAE
11.5.1.6.1 UAE Orthopedic Software Market Estimates and Forecasts, By Product (2020-2032) (USD Million)
11.5.1.6.2 UAE Orthopedic Software Market Estimates and Forecasts, By Application (2020-2032) (USD Million)
11.5.1.6.3 UAE Orthopedic Software Market Estimates and Forecasts, By Mode of Delivery (2020-2032) (USD Million)
11.5.1.6.3 UAE Orthopedic Software Market Estimates and Forecasts, By End Users (2020-2032) (USD Million)
11.5.1.7 Egypt
11.5.1.7.1 Egypt Orthopedic Software Market Estimates and Forecasts, By Product (2020-2032) (USD Million)
11.5.1.7.2 Egypt Orthopedic Software Market Estimates and Forecasts, By Application (2020-2032) (USD Million)
11.5.1.7.3 Egypt Orthopedic Software Market Estimates and Forecasts, By Mode of Delivery (2020-2032) (USD Million)
11.5.1.7.3 Egypt Orthopedic Software Market Estimates and Forecasts, By End Users (2020-2032) (USD Million)
11.5.1.8 Saudi Arabia
11.5.1.8.1 Saudi Arabia Orthopedic Software Market Estimates and Forecasts, By Product (2020-2032) (USD Million)
11.5.1.8.2 Saudi Arabia Orthopedic Software Market Estimates and Forecasts, By Application (2020-2032) (USD Million)
11.5.1.8.3 Saudi Arabia Orthopedic Software Market Estimates and Forecasts, By Mode of Delivery (2020-2032) (USD Million)
11.5.1.8.3 Saudi Arabia Orthopedic Software Market Estimates and Forecasts, By End Users (2020-2032) (USD Million)
11.5.1.9 Qatar
11.5.1.9.1 Qatar Orthopedic Software Market Estimates and Forecasts, By Product (2020-2032) (USD Million)
11.5.1.9.2 Qatar Orthopedic Software Market Estimates and Forecasts, By Application (2020-2032) (USD Million)
11.5.1.9.3 Qatar Orthopedic Software Market Estimates and Forecasts, By Mode of Delivery (2020-2032) (USD Million)
11.5.1.9.3 Qatar Orthopedic Software Market Estimates and Forecasts, By End Users (2020-2032) (USD Million)
11.5.1.11 Rest of Middle East
11.5.1.11.1 Rest of Middle East Orthopedic Software Market Estimates and Forecasts, By Product (2020-2032) (USD Million)
11.5.1.11.2 Rest of Middle East Orthopedic Software Market Estimates and Forecasts, By Application (2020-2032) (USD Million)
11.5.1.11.3 Rest of Middle East Orthopedic Software Market Estimates and Forecasts, By Mode of Delivery (2020-2032) (USD Million)
11.5.1.11.3 Rest of Middle East Orthopedic Software Market Estimates and Forecasts, By End Users (2020-2032) (USD Million)
11.5.2 Africa
11.5.2.1 Trends Analysis
11.5.2.2 Africa Orthopedic Software Market Estimates and Forecasts, by Country (2020-2032) (USD Million)
11.5.2.3 Africa Orthopedic Software Market Estimates and Forecasts, By Product (2020-2032) (USD Million)
11.5.2.4 Africa Orthopedic Software Market Estimates and Forecasts, By Application (2020-2032) (USD Million)
11.5.2.5 Africa Orthopedic Software Market Estimates and Forecasts, By Mode of Delivery (2020-2032) (USD Million)
11.5.2.8.3 Africa Orthopedic Software Market Estimates and Forecasts, By End Users (2020-2032) (USD Million)
11.5.2.6 South Africa
11.5.2.6.1 South Africa Orthopedic Software Market Estimates and Forecasts, By Product (2020-2032) (USD Million)
11.5.2.6.2 South Africa Orthopedic Software Market Estimates and Forecasts, By Application (2020-2032) (USD Million)
11.5.2.6.3 South Africa Orthopedic Software Market Estimates and Forecasts, By Mode of Delivery (2020-2032) (USD Million)
11.5.2.8.3 South Africa Orthopedic Software Market Estimates and Forecasts, By End Users (2020-2032) (USD Million)
11.5.2.7 Nigeria
11.5.2.7.1 Nigeria Orthopedic Software Market Estimates and Forecasts, By Product (2020-2032) (USD Million)
11.5.2.7.2 Nigeria Orthopedic Software Market Estimates and Forecasts, By Application (2020-2032) (USD Million)
11.5.2.7.3 Nigeria Orthopedic Software Market Estimates and Forecasts, By Mode of Delivery (2020-2032) (USD Million)
11.5.2.8.3 Nigeria Orthopedic Software Market Estimates and Forecasts, By End Users (2020-2032) (USD Million)
11.5.2.8 Rest of Africa
11.5.2.8.1 Rest of Africa Orthopedic Software Market Estimates and Forecasts, By Product (2020-2032) (USD Million)
11.5.2.8.2 Rest of Africa Orthopedic Software Market Estimates and Forecasts, By Application (2020-2032) (USD Million)
11.5.2.8.3 Rest of Africa Orthopedic Software Market Estimates and Forecasts, By Mode of Delivery (2020-2032) (USD Million)
11.5.2.8.3 Rest of Africa Orthopedic Software Market Estimates and Forecasts, By End Users (2020-2032) (USD Million)
11.6 Latin America
11.6.1 Trends Analysis
11.6.2 Latin America Orthopedic Software Market Estimates and Forecasts, by Country (2020-2032) (USD Million)
11.6.3 Latin America Orthopedic Software Market Estimates and Forecasts, By Product (2020-2032) (USD Million)
11.6.4 Latin America Orthopedic Software Market Estimates and Forecasts, By Application (2020-2032) (USD Million)
11.6.5 Latin America Orthopedic Software Market Estimates and Forecasts, By Mode of Delivery (2020-2032) (USD Million)
11.6.5 Latin America Orthopedic Software Market Estimates and Forecasts, By End Users (2020-2032) (USD Million)
11.6.6 Brazil
11.6.6.1 Brazil Orthopedic Software Market Estimates and Forecasts, By Product (2020-2032) (USD Million)
11.6.6.2 Brazil Orthopedic Software Market Estimates and Forecasts, By Application (2020-2032) (USD Million)
11.6.6.3 Brazil Orthopedic Software Market Estimates and Forecasts, By Mode of Delivery (2020-2032) (USD Million)
11.6.6.3 Brazil Orthopedic Software Market Estimates and Forecasts, By End Users (2020-2032) (USD Million)
11.6.7 Argentina
11.6.7.1 Argentina Orthopedic Software Market Estimates and Forecasts, By Product (2020-2032) (USD Million)
11.6.7.2 Argentina Orthopedic Software Market Estimates and Forecasts, By Application (2020-2032) (USD Million)
11.6.7.3 Argentina Orthopedic Software Market Estimates and Forecasts, By Mode of Delivery (2020-2032) (USD Million)
11.6.7.3 Argentina Orthopedic Software Market Estimates and Forecasts, By End Users (2020-2032) (USD Million)
11.6.8 Colombia
11.6.8.1 Colombia Orthopedic Software Market Estimates and Forecasts, By Product (2020-2032) (USD Million)
11.6.8.2 Colombia Orthopedic Software Market Estimates and Forecasts, By Application (2020-2032) (USD Million)
11.6.8.3 Colombia Orthopedic Software Market Estimates and Forecasts, By Mode of Delivery (2020-2032) (USD Million)
11.6.8.3 Colombia Orthopedic Software Market Estimates and Forecasts, By End Users (2020-2032) (USD Million)
11.6.9 Rest of Latin America
11.6.9.1 Rest of Latin America Orthopedic Software Market Estimates and Forecasts, By Product (2020-2032) (USD Million)
11.6.9.2 Rest of Latin America Orthopedic Software Market Estimates and Forecasts, By Application (2020-2032) (USD Million)
11.6.9.3 Rest of Latin America Orthopedic Software Market Estimates and Forecasts, By Mode of Delivery (2020-2032) (USD Million)
11.6.9.3 Rest of Latin America Orthopedic Software Market Estimates and Forecasts, By End Users (2020-2032) (USD Million)
12. Company Profiles
12.1 Koninklijke DSM N.V.
12.1.1 Company Overview
12.1.2 Financial
12.1.3 Products/ Services Offered
12.1.4 SWOT Analysis
12.2 DuPont
12.2.1 Company Overview
12.2.2 Financial
12.2.3 Products/ Services Offered
12.2.4 SWOT Analysis
12.3 BASF SE
12.3.1 Company Overview
12.3.2 Financial
12.3.3 Products/ Services Offered
12.3.4 SWOT Analysis
12.4 Corbion N.V.
12.4.1 Company Overview
12.4.2 Financial
12.4.3 Products/ Services Offered
12.4.4 SWOT Analysis
12.5 Cargill, Inc.
12.5.1 Company Overview
12.5.2 Financial
12.5.3 Products/ Services Offered
12.5.4 SWOT Analysis
12.6 Novozymes A/S
12.6.1 Company Overview
12.6.2 Financial
12.6.3 Products/ Services Offered
12.6.4 SWOT Analysis
12.7 Ginkgo Bioworks
12.7.1 Company Overview
12.7.2 Financial
12.7.3 Products/ Services Offered
12.7.4 SWOT Analysis
12.8 Biocon Limited
12.8.1 Company Overview
12.8.2 Financial
12.8.3 Products/ Services Offered
12.8.4 SWOT Analysis
12.9 Amyris, Inc.
12.9.1 Company Overview
12.9.2 Financial
12.9.3 Products/ Services Offered
12.9.4 SWOT Analysis
12.10 Evonik Industries AG.
12.10.1 Company Overview
12.10.2 Financial
12.10.3 Products/ Services Offered
12.10.4 SWOT Analysis
13. Use Cases and Best Practices
14. Conclusion
An accurate research report requires proper strategizing as well as implementation. There are multiple factors involved in the completion of good and accurate research report and selecting the best methodology to compete the research is the toughest part. Since the research reports we provide play a crucial role in any company’s decision-making process, therefore we at SNS Insider always believe that we should choose the best method which gives us results closer to reality. This allows us to reach at a stage wherein we can provide our clients best and accurate investment to output ratio.
Each report that we prepare takes a timeframe of 350-400 business hours for production. Starting from the selection of titles through a couple of in-depth brain storming session to the final QC process before uploading our titles on our website we dedicate around 350 working hours. The titles are selected based on their current market cap and the foreseen CAGR and growth.
The 5 steps process:
Step 1: Secondary Research:
Secondary Research or Desk Research is as the name suggests is a research process wherein, we collect data through the readily available information. In this process we use various paid and unpaid databases which our team has access to and gather data through the same. This includes examining of listed companies’ annual reports, Journals, SEC filling etc. Apart from this our team has access to various associations across the globe across different industries. Lastly, we have exchange relationships with various university as well as individual libraries.

Step 2: Primary Research
When we talk about primary research, it is a type of study in which the researchers collect relevant data samples directly, rather than relying on previously collected data. This type of research is focused on gaining content specific facts that can be sued to solve specific problems. Since the collected data is fresh and first hand therefore it makes the study more accurate and genuine.
We at SNS Insider have divided Primary Research into 2 parts.
Part 1 wherein we interview the KOLs of major players as well as the upcoming ones across various geographic regions. This allows us to have their view over the market scenario and acts as an important tool to come closer to the accurate market numbers. As many as 45 paid and unpaid primary interviews are taken from both the demand and supply side of the industry to make sure we land at an accurate judgement and analysis of the market.
This step involves the triangulation of data wherein our team analyses the interview transcripts, online survey responses and observation of on filed participants. The below mentioned chart should give a better understanding of the part 1 of the primary interview.

Part 2: In this part of primary research the data collected via secondary research and the part 1 of the primary research is validated with the interviews from individual consultants and subject matter experts.
Consultants are those set of people who have at least 12 years of experience and expertise within the industry whereas Subject Matter Experts are those with at least 15 years of experience behind their back within the same space. The data with the help of two main processes i.e., FGDs (Focused Group Discussions) and IDs (Individual Discussions). This gives us a 3rd party nonbiased primary view of the market scenario making it a more dependable one while collation of the data pointers.
Step 3: Data Bank Validation
Once all the information is collected via primary and secondary sources, we run that information for data validation. At our intelligence centre our research heads track a lot of information related to the market which includes the quarterly reports, the daily stock prices, and other relevant information. Our data bank server gets updated every fortnight and that is how the information which we collected using our primary and secondary information is revalidated in real time.

Step 4: QA/QC Process
After all the data collection and validation our team does a final level of quality check and quality assurance to get rid of any unwanted or undesired mistakes. This might include but not limited to getting rid of the any typos, duplication of numbers or missing of any important information. The people involved in this process include technical content writers, research heads and graphics people. Once this process is completed the title gets uploader on our platform for our clients to read it.
Step 5: Final QC/QA Process:
This is the last process and comes when the client has ordered the study. In this process a final QA/QC is done before the study is emailed to the client. Since we believe in giving our clients a good experience of our research studies, therefore, to make sure that we do not lack at our end in any way humanly possible we do a final round of quality check and then dispatch the study to the client.
The Healthcare Interoperability Solutions Market Size was valued at USD 3.4 billion in 2023 and is expected to reach USD 10.9 billion by 2032 and grow at a CAGR of 13.8% over the forecast period 2024-2032.
The Population Health Management Market size is projected to grow from USD 32.30 billion in 2023 to USD 119.16 billion by 2032, at a CAGR of 15.58%
The ECG Equipment and Management Systems Market size at USD 6.9 billion in 2023, with a projected CAGR of 6.2% to reach USD 11.32 billion by 2031.
The Prostate Health Market Size was valued at USD 37.73 billion in 2023, and is expected to reach USD 82.62 billion by 2032 and grow at a CAGR of 9.1% over the forecast period 2024-2032.
Livestock Insurance Market Size was valued at USD 4.3 Billion in 2023 and is expected to reach USD 8.44 billion by 2032, growing at a CAGR of 7.8% over the forecast period 2024-2032.
The Ophthalmic Perimeters Market size is projected to reach USD 436.56 million by 2032 and was valued at USD 281.05 million in 2023 and growing at a CAGR of 4.55% over the forecast period of 2024-2032.

Hi! Click one of our member below to chat on Phone
© 2025 All Rights Reserved by SNS Insider Pvt Ltd


