image

Organic Peroxide Market Scope & Overview:

Organic Peroxide Market Revenue Analysis

Get More Information on Organic Peroxide Market - Request Sample Report

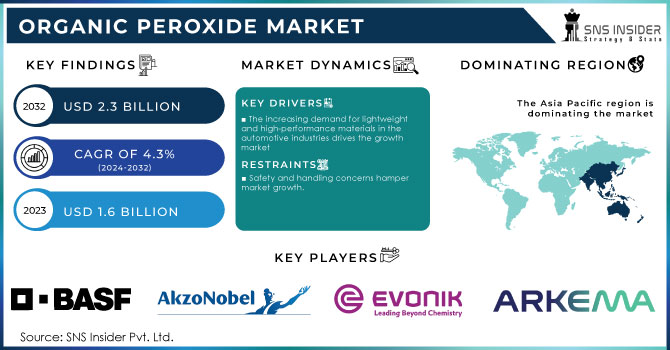
The Organic Peroxide Market size was valued at USD 1.6 Billion in 2023. It is expected to grow to USD 2.3 Billion by 2032 and grow at a CAGR of 4.3% over the forecast period of 2024-2032.

The organic peroxide market is significantly driven by an increasing demand in various industries, including plastics, rubber, and coatings. Organic peroxides work as initiators, curing agents, or crosslinking agents, facilitating the essential chemical reactions within these applications. As per the American Chemistry Council, the U.S. plastics industry has generated USD 410 billion worth of shipments in 2022. It contributes significantly to the national economy and is among the driving forces behind an elevating demand for additives that allow for polymer production improvement, such as organic peroxides. This industrial segment heavily relies on organic peroxides to manufacture high-quality tires and parts.

The demand for protective or decorative coatings is consistently increasing in a variety of areas, including automotive, industrial, and architectural applications. Finally, many advanced industrial nations concentrate on the Asia-Pacific region, as, for instance, China and India have been actively industrializing. The nations are rich in production capacities due to the resource surplus, and, accordingly, the consumption rate of organic peroxides is going to rise. Overall, these aspects combined mean that there is a multilayered increase in the demand for organic peroxides in the above-mentioned industries due to their inherent beneficial properties aiding better performance and higher sustainability aspect.

The organic peroxide market is likely to experience several growth-inducing trends to drive it in the coming years, such as the spread of the polymer industry. Organic peroxides are vital to a variety of polymerization processes, including curing and crosslinking. The automotive industry’s need for light, high-performance materials continue to rise as manufacturers strive to reduce fuel consumption and emissions.

For instance, in 2023, Arkema’s Kynar 2 product is a Polyvinylidene Fluoride resin that utilized organic peroxide to significantly improve the thermal balance and mechanical strength of the polymers that are used in making automotive parts.

Drivers

  • The increasing demand for lightweight and high-performance materials in the automotive industries drives the growth market

The organic peroxide market demand is rising in the automotive industry due to its lightweight and high performance.  Lightweight materials have become vital as they can contribute to improved fuel consumption and reduced emissions, according to the U.S. Department of Energy, which implies that a 10% reduction in vehicle weight results in a 6% improvement in fuel efficiency. This push for lightweight has stimulated the adoption of advanced composites and polymers among automakers, where organic peroxides play an important role in curing and crosslinking. For example, they are used in the manufacture of high-performance thermoset resins, wherein the latter are increasingly used in structural elements and vehicle interiors.

The focus on these lightweight materials is further enhanced as companies are striving to meet strict environmental standards such as the Corporate Average Fuel Economy standards. In order to come closer, and align with the requirement while not losing on performance and safety, organic peroxides are further adopted in manufacturing these materials, such as reinforcing their application in the specific industry. In such a way, the application of organic peroxides in the lightweight production of materials assembled for automotive purposes is both an important driver and is well positioned with the overall industry shift towards more sustainable and innovative solutions.

Restraint

  • Safety and handling concerns hamper market growth.

One critical factor that hinders market growth is safety and handling concerns. Organic peroxides are considered hazardous materials that are capable of causing fire, skin irritation, or respiratory issues. As a consequence, safety considerations are crucial, which is manifested in the necessity to store the substance at the appropriate temperature, wear personal protective equipment, and complete all required safety exams and audits. Under such circumstances, manufacturers face increased operational costs, which results in a lower tendency to adopt organic peroxides. More specifically, the issue restricts the growth among smaller firms with limited available funds.

Market Segmentation Analysis
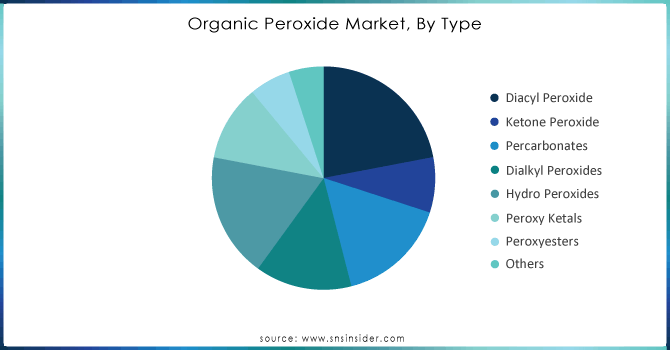
By Type

Diacyl Peroxide held the largest market share around 22% in 2023. These chemicals are extensively used in the manufacture of thermoplastics, thermosets, and elastomers, being indispensable in such sectors as automotive, packaging, and construction. Owing to their ability to decompose at relatively low temperatures, curing and crosslinking the materials can be achieved more cost-efficiently, improving mechanical properties and thermal stability. For example, diacyl peroxides, including benzoyl peroxide, are extensively employed in the production of acrylics and polyesters, which are vital for coatings and adhesives. Furthermore, the demand in the automotive sector, where lightweight and high-performance materials are required, also contributes to the use of diacyl peroxides, as they allow for enhanced fuel efficiency and reduced emissions. Thus, the fact that these products have already been firmly established on the market, alongside ongoing innovations and new formulations, suggests that diacyl peroxides will continue to be the leading chemicals, with their consumption growing in a variety of contexts.

Organic-Peroxide-Market-By-Type

Need Any Customization Research On Organic Peroxide Market - Inquiry Now

By Application

The largest share of the organic peroxide market is held by the chemicals and plastics segment around 24% in 2023. This fact is explained by the substantial contribution of these compounds to the technological advancement used for constituting and ensuring the operation of a wide scope of polymeric materials. Organic peroxides are critical for the initiation of numerous processes of polymerization, which helps create diverse high-performance plastics and resins. They are necessary for the packaging industry, for manufacturing various automotive crew, constructing materials, and others. These materials are increasingly demanded as lightweight and, at the same time, solid and resilient, which allows different industries to increase their energy efficiency and sustainability levels.
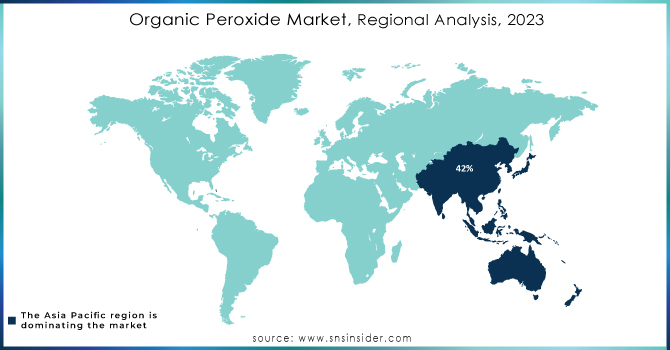
Regional Analysis

Asia Pacific held the highest market share around 42% in 2023. The Asia Pacific region is the leading in the organic peroxide market. The reason is that Asia Pacific is rapidly industrializing, increasing the number of manufacturing industries, and demand in different end-use industries. Based on the Asian Development Bank, the region’s manufacturing output will cover more than 50% of the global manufacturing output by 2025. In this respect, different sectors including the automotive, packaging, and construction will require organic peroxides, consequently increasing the demand for organic peroxides. China and India are also key players in the market as China owns the largest production of polymers and plastics globally, which correlates with the growing use of organic peroxides in manufacturing, especially polymers and plastics as a vital curing agent and initiator. For example, the production of plastics in China by the end of 2021 was scale about 77 million metric tons according to the statistics of China statistics and forecast.

Organic-Peroxide-Market-Regional-Analysis-2023

Key Players

  • BASF SE (Peroxide 50)

  • Arkema Group (Luperox)

  • AkzoNobel N.V. (Dibenzoyl Peroxide)

  • PeroxyChem LLC (Luperox)

  • Evonik Industries AG (Vulcup)

  • Huntsman Corporation (Diketone Peroxide)

  • NOF Corporation (NOF-210)

  • DOW Chemical Company (DOW Peroxide 50)

  • Solvay S.A. (Peroxide 25)

  • Mitsubishi Gas Chemical Company, Inc. (Peroxyacetic Acid)

  • Chang Chun Plastics Co., Ltd. (Cyanuric Peroxide)

  • Ferro Corporation (Vulcan)

  • Eastman Chemical Company (Vazo)

  • Wacker Chemie AG (Wacker Peroxide)

  • Kraton Corporation (Kraton G)

  • Shivam Peroxide Pvt. Ltd. (Shivam Peroxide 40)

  • Fujifilm Wako Pure Chemical Corporation (Peroxide A)

  • Nouryon (formerly AkzoNobel Specialty Chemicals) (Benzoyl Peroxide)

  • Oltchim SA (Oltchim Peroxide)

  • United Initiators (U.P. 70)

Recent Developments:

  • In 2023, BASF launched a new line of sustainable organic peroxides, focusing on reducing environmental impact during production and application, particularly in the automotive and construction sectors.

  • In 2023, NOF Corporation unveiled a new formulation of NOF-210, enhancing its effectiveness as a polymerization initiator for high-performance plastics.

  • In 2022, Arkema expanded its production capacity for Luperox organic peroxides at its facility in Brazil, enhancing its supply chain and meeting the growing demand in the South American market.

Organic Peroxide Market Report Scope:

Report Attributes Details
Market Size in 2023 US$ 1.6 Billion
Market Size by 2032 US$ 2.3 Billion
CAGR CAGR of4.3% From 2024 to 2032
Base Year 2023
Forecast Period 2024-2032
Historical Data 2020-2022
Report Scope & Coverage Market Size, Segments Analysis, Competitive  Landscape, Regional Analysis, DROC & SWOT Analysis, Forecast Outlook
Key Segments  
• By Type (Diacyl Peroxide, Ketone Peroxide, Percarbonates, Dialkyl Peroxides, Hydro Peroxides, Peroxy Ketals, Peroxyesters, Others)
•By Application (Chemicals & Plastics, Coatings & Adhesives, Elastomers, Paper & Textiles, Detergents, Personal Care, Other)
Regional Analysis/Coverage North America (US, Canada, Mexico), Europe (Eastern Europe [Poland, Romania, Hungary, Turkey, Rest of Eastern Europe] Western Europe] Germany, France, UK, Italy, Spain, Netherlands, Switzerland, Austria, Rest of Western Europe]), Asia Pacific (China, India, Japan, South Korea, Vietnam, Singapore, Australia, Rest of Asia Pacific), Middle East & Africa (Middle East [UAE, Egypt, Saudi Arabia, Qatar, Rest of Middle East], Africa [Nigeria, South Africa, Rest of Africa], Latin America (Brazil, Argentina, Colombia, Rest of Latin America)
Company Profiles BASF SE, Arkema Group, AkzoNobel N.V., PeroxyChem LLC, Evonik Industries AG, Huntsman Corporation, NOF Corporation, DOW Chemical Company, Solvay S.A., Mitsubishi Gas Chemical Company, Inc., Chang Chun Plastics Co., Ltd., Ferro Corporation, Eastman Chemical Company, Wacker Chemie AG, Kraton Corporation, Shivam Peroxide Pvt. Ltd., Fujifilm Wako Pure Chemical Corporation, Nouryon, Oltchim SA, United Initiators.
Key Drivers •The increasing demand for lightweight and high-performance materials in the automotive industries drives the growth market. 
RESTRAINTS •Safety and handling concerns hampers market growth. 

Frequently Asked Questions

Ans: The Organic Peroxide Market was valued at USD 1.6 Billion in 2023.

Ans: The expected CAGR of the global Organic Peroxide Market during the forecast period is 4.3%.

Ans: The Diacyl Peroxide grow rapidly in the Organic Peroxide Market from 2024-2032.

Ans: The increasing demand for lightweight and high-performance materials in the automotive industries drives the growth market

Ans: The U.S. led the Organic Peroxide Market in North America region with the highest revenue share in 2023.

Table of Contents

1. Introduction

1.1 Market Definition

1.2 Scope (Inclusion and Exclusions)

1.3 Research Assumptions

2. Executive Summary

2.1 Market Overview

2.2 Regional Synopsis

2.3 Competitive Summary

3. Research Methodology

3.1 Top-Down Approach

3.2 Bottom-up Approach

3.3. Data Validation

3.4 Primary Interviews

4. Market Dynamics Impact Analysis

3.1 Market Driving Factors Analysis

3.1.2 Drivers

3.1.2 Restraints

3.1.3 Opportunities

3.1.4 Challenges

3.2 PESTLE Analysis

3.3 Porter’s Five Forces Model

5. Statistical Insights and Trends Reporting

5.1 Production Capacity and Utilization, by Country, by Type, 2023

5.2 Feedstock Prices, by Country, by Type, 2023

5.3   Regulatory Impact, by l Country, by Type, 2023.

5.4 Environmental Metrics: Emissions Data, Waste Management Practices, and     Sustainability Initiatives, by Region

5.5 Innovation and R&D, by Type, 2023

6. Competitive Landscape

6.1 List of Major Companies, By Region

6.2 Market Share Analysis, By Region

6.3 Product Benchmarking

6.3.1 Product specifications and features

6.3.2 Pricing

6.4 Strategic Initiatives

6.4.1 Marketing and promotional activities

6.4.2 Distribution and supply chain strategies

6.4.3 Expansion plans and new Product launches

6.4.4 Strategic partnerships and collaborations

6.5 Technological Advancements

6.6 Market Positioning and Branding

7. Organic Peroxide Market Segmentation, by Type

7.1 Chapter Overview

7.2 Diacyl Peroxide

        7.2.1 Diacyl Peroxide Market Trends Analysis (2020-2032)

7.2.2 Diacyl Peroxide Market Size Estimates and Forecasts to 2032 (USD Billion)

7.3 Ketone Peroxide

       7.3.1 Ketone Peroxide Market Trends Analysis (2020-2032)

       7.3.2 Ketone Peroxide Market Size Estimates and Forecasts to 2032 (USD Billion)

7.4 Percarbonates

       7.4.1 Percarbonates Market Trends Analysis (2020-2032)

       7.4.2 Percarbonates Market Size Estimates and Forecasts to 2032 (USD Billion)

7.5 Dialkyl Peroxides

        7.5.1 Dialkyl Peroxides Market Trends Analysis (2020-2032)

7.5.2 Dialkyl Peroxides Market Size Estimates and Forecasts to 2032 (USD Billion)

7.6 Hydro Peroxides

       7.6.1 Hydro Peroxides Market Trends Analysis (2020-2032)

       7.6.2 Hydro Peroxides Market Size Estimates and Forecasts to 2032 (USD Billion)

7.7 Peroxy Ketals

       7.7.1 Peroxy Ketals Market Trends Analysis (2020-2032)

       7.7.2 Peroxy Ketals Market Size Estimates and Forecasts to 2032 (USD Billion)

7.8 Peroxyesters

       7.8.1 Peroxyesters Market Trends Analysis (2020-2032)

       7.8.2 Peroxyesters Market Size Estimates and Forecasts to 2032 (USD Billion)

7.9 Others

       7.9.1 Others Market Trends Analysis (2020-2032)

       7.9.2 Others Market Size Estimates and Forecasts to 2032 (USD Billion)

8. Organic Peroxide Market Segmentation, by Application

8.1 Chapter Overview

8.2 Chemicals & Plastics

        8.2.1 Chemicals & Plastics Market Trends Analysis (2020-2032)

8.2.2 Chemicals & Plastics Market Size Estimates and Forecasts to 2032 (USD Billion)

8.3 Coatings & Adhesives     

       8.3.1 Coatings & Adhesives Market Trends Analysis (2020-2032)

8.3.2 Coatings & Adhesives Market Size Estimates and Forecasts to 2032 (USD Billion)

8.4 Elastomers

        8.4.1 Elastomers Market Trends Analysis (2020-2032)

8.4.2 Elastomers Market Size Estimates and Forecasts to 2032 (USD Billion)

8.5 Paper & Textiles

        8.5.1 Paper & Textiles Market Trends Analysis (2020-2032)

8.5.2 Paper & Textiles Market Size Estimates and Forecasts to 2032 (USD Billion)

8.6 Detergents

       8.6.1 Detergents Market Trends Analysis (2020-2032)

8.6.2 Detergents Market Size Estimates and Forecasts to 2032 (USD Billion)

8.7 Personal Care

        8.7.1 Personal Care Market Trends Analysis (2020-2032)

8.7.2 Personal Care Market Size Estimates and Forecasts to 2032 (USD Billion)

8.8 Others

        8.8.1 Others Market Trends Analysis (2020-2032)

8.8.2 Others Market Size Estimates and Forecasts to 2032 (USD Billion)

9. Regional Analysis

9.1 Chapter Overview

9.2 North America

9.2.1 Trends Analysis

9.2.2 North America Organic Peroxide Market Estimates and Forecasts, by Country (2020-2032) (USD Billion)

9.2.3 North America Organic Peroxide Market Estimates and Forecasts, by Type (2020-2032) (USD Billion)  

9.2.4 North America Organic Peroxide Market Estimates and Forecasts, by Application (2020-2032) (USD Billion)

9.2.5 USA

9.2.5.1 USA Organic Peroxide Market Estimates and Forecasts, by Type (2020-2032) (USD Billion)

9.2.5.2 USA Organic Peroxide Market Estimates and Forecasts, by Application (2020-2032) (USD Billion)

9.2.6 Canada

9.2.6.1 Canada Organic Peroxide Market Estimates and Forecasts, by Type (2020-2032) (USD Billion)

9.2.6.2 Canada Organic Peroxide Market Estimates and Forecasts, by Application (2020-2032) (USD Billion)

9.2.7 Mexico

9.2.7.1 Mexico Organic Peroxide Market Estimates and Forecasts, by Type (2020-2032) (USD Billion)

9.2.7.2 Mexico Organic Peroxide Market Estimates and Forecasts, by Application (2020-2032) (USD Billion)

9.3 Europe

9.3.1 Eastern Europe

9.3.1.1 Trends Analysis

9.3.1.2 Eastern Europe Organic Peroxide Market Estimates and Forecasts, by Country (2020-2032) (USD Billion)

9.3.1.3 Eastern Europe Organic Peroxide Market Estimates and Forecasts, by Type (2020-2032) (USD Billion)  

9.3.1.4 Eastern Europe Organic Peroxide Market Estimates and Forecasts, by Application (2020-2032) (USD Billion)

9.3.1.5 Poland

9.3.1.5.1 Poland Organic Peroxide Market Estimates and Forecasts, by Type (2020-2032) (USD Billion)

9.3.1.5.2 Poland Organic Peroxide Market Estimates and Forecasts, by Application (2020-2032) (USD Billion)

9.3.1.6 Romania

9.3.1.6.1 Romania Organic Peroxide Market Estimates and Forecasts, by Type (2020-2032) (USD Billion)

9.3.1.6.2 Romania Organic Peroxide Market Estimates and Forecasts, by Application (2020-2032) (USD Billion)

9.3.1.7 Hungary

9.3.1.7.1 Hungary Organic Peroxide Market Estimates and Forecasts, by Type (2020-2032) (USD Billion)

9.3.1.7.2 Hungary Organic Peroxide Market Estimates and Forecasts, by Application (2020-2032) (USD Billion)

9.3.1.8 Turkey

9.3.1.8.1 Turkey Organic Peroxide Market Estimates and Forecasts, by Type (2020-2032) (USD Billion)

9.3.1.8.2 Turkey Organic Peroxide Market Estimates and Forecasts, by Application (2020-2032) (USD Billion)

9.3.1.9 Rest of Eastern Europe

9.3.1.9.1 Rest of Eastern Europe Organic Peroxide Market Estimates and Forecasts, by Type (2020-2032) (USD Billion)

9.3.1.9.2 Rest of Eastern Europe Organic Peroxide Market Estimates and Forecasts, by Application (2020-2032) (USD Billion)

9.3.2 Western Europe

9.3.2.1 Trends Analysis

9.3.2.2 Western Europe Organic Peroxide Market Estimates and Forecasts, by Country (2020-2032) (USD Billion)

9.3.2.3 Western Europe Organic Peroxide Market Estimates and Forecasts, by Type (2020-2032) (USD Billion)  

9.3.2.4 Western Europe Organic Peroxide Market Estimates and Forecasts, by Application (2020-2032) (USD Billion)

9.3.2.5 Germany

9.3.2.5.1 Germany Organic Peroxide Market Estimates and Forecasts, by Type (2020-2032) (USD Billion)

9.3.2.5.2 Germany Organic Peroxide Market Estimates and Forecasts, by Application (2020-2032) (USD Billion)

9.3.2.6 France

9.3.2.6.1 France Organic Peroxide Market Estimates and Forecasts, by Type (2020-2032) (USD Billion)

9.3.2.6.2 France Organic Peroxide Market Estimates and Forecasts, by Application (2020-2032) (USD Billion)

9.3.2.7 UK

9.3.2.7.1 UK Organic Peroxide Market Estimates and Forecasts, by Type (2020-2032) (USD Billion)

9.3.2.7.2 UK Organic Peroxide Market Estimates and Forecasts, by Application (2020-2032) (USD Billion)

9.3.2.8 Italy

9.3.2.8.1 Italy Organic Peroxide Market Estimates and Forecasts, by Type (2020-2032) (USD Billion)

9.3.2.8.2 Italy Organic Peroxide Market Estimates and Forecasts, by Application (2020-2032) (USD Billion)

9.3.2.9 Spain

9.3.2.9.1 Spain Organic Peroxide Market Estimates and Forecasts, by Type (2020-2032) (USD Billion)

9.3.2.9.2 Spain Organic Peroxide Market Estimates and Forecasts, by Application (2020-2032) (USD Billion)

9.3.2.10 Netherlands

9.3.2.10.1 Netherlands Organic Peroxide Market Estimates and Forecasts, by Type (2020-2032) (USD Billion)

9.3.2.10.2 Netherlands Organic Peroxide Market Estimates and Forecasts, by Application (2020-2032) (USD Billion)

9.3.2.11 Switzerland

9.3.2.11.1 Switzerland Organic Peroxide Market Estimates and Forecasts, by Type (2020-2032) (USD Billion)

9.3.2.11.2 Switzerland Organic Peroxide Market Estimates and Forecasts, by Application (2020-2032) (USD Billion)

9.3.2.12 Austria

9.3.2.12.1 Austria Organic Peroxide Market Estimates and Forecasts, by Type (2020-2032) (USD Billion)

9.3.2.12.2 Austria Organic Peroxide Market Estimates and Forecasts, by Application (2020-2032) (USD Billion)

9.3.2.13 Rest of Western Europe

9.3.2.13.1 Rest of Western Europe Organic Peroxide Market Estimates and Forecasts, by Type (2020-2032) (USD Billion)

9.3.2.13.2 Rest of Western Europe Organic Peroxide Market Estimates and Forecasts, by Application (2020-2032) (USD Billion)

9.4 Asia Pacific

9.4.1 Trends Analysis

9.4.2 Asia Pacific Organic Peroxide Market Estimates and Forecasts, by Country (2020-2032) (USD Billion)

9.4.3 Asia Pacific Organic Peroxide Market Estimates and Forecasts, by Type (2020-2032) (USD Billion)  

9.4.4 Asia Pacific Organic Peroxide Market Estimates and Forecasts, by Application (2020-2032) (USD Billion)

9.4.5 China

9.4.5.1 China Organic Peroxide Market Estimates and Forecasts, by Type (2020-2032) (USD Billion)

9.4.5.2 China Organic Peroxide Market Estimates and Forecasts, by Application (2020-2032) (USD Billion)

9.4.6 India

9.4.5.1 India Organic Peroxide Market Estimates and Forecasts, by Type (2020-2032) (USD Billion)

9.4.5.2 India Organic Peroxide Market Estimates and Forecasts, by Application (2020-2032) (USD Billion)

9.4.5 Japan

9.4.5.1 Japan Organic Peroxide Market Estimates and Forecasts, by Type (2020-2032) (USD Billion)

9.4.5.2 Japan Organic Peroxide Market Estimates and Forecasts, by Application (2020-2032) (USD Billion)

9.4.6 South Korea

9.4.6.1 South Korea Organic Peroxide Market Estimates and Forecasts, by Type (2020-2032) (USD Billion)

9.4.6.2 South Korea Organic Peroxide Market Estimates and Forecasts, by Application (2020-2032) (USD Billion)

9.4.7 Vietnam

9.4.7.1 Vietnam Organic Peroxide Market Estimates and Forecasts, by Type (2020-2032) (USD Billion)

9.2.7.2 Vietnam Organic Peroxide Market Estimates and Forecasts, by Application (2020-2032) (USD Billion)

9.4.8 Singapore

9.4.8.1 Singapore Organic Peroxide Market Estimates and Forecasts, by Type (2020-2032) (USD Billion)

9.4.8.2 Singapore Organic Peroxide Market Estimates and Forecasts, by Application (2020-2032) (USD Billion)

9.4.9 Australia

9.4.9.1 Australia Organic Peroxide Market Estimates and Forecasts, by Type (2020-2032) (USD Billion)

9.4.9.2 Australia Organic Peroxide Market Estimates and Forecasts, by Application (2020-2032) (USD Billion)

9.4.10 Rest of Asia Pacific

9.4.10.1 Rest of Asia Pacific Organic Peroxide Market Estimates and Forecasts, by Type (2020-2032) (USD Billion)

9.4.10.2 Rest of Asia Pacific Organic Peroxide Market Estimates and Forecasts, by Application (2020-2032) (USD Billion)

9.5 Middle East and Africa

9.5.1 Middle East

9.5.1.1 Trends Analysis

9.5.1.2 Middle East Organic Peroxide Market Estimates and Forecasts, by Country (2020-2032) (USD Billion)

9.5.1.3 Middle East Organic Peroxide Market Estimates and Forecasts, by Type (2020-2032) (USD Billion)  

9.5.1.4 Middle East Organic Peroxide Market Estimates and Forecasts, by Application (2020-2032) (USD Billion)

9.5.1.5 UAE

9.5.1.5.1 UAE Organic Peroxide Market Estimates and Forecasts, by Type (2020-2032) (USD Billion)

9.5.1.5.2 UAE Organic Peroxide Market Estimates and Forecasts, by Application (2020-2032) (USD Billion)

9.5.1.6 Egypt

9.5.1.6.1 Egypt Organic Peroxide Market Estimates and Forecasts, by Type (2020-2032) (USD Billion)

9.5.1.6.2 Egypt Organic Peroxide Market Estimates and Forecasts, by Application (2020-2032) (USD Billion)

9.5.1.7 Saudi Arabia

9.5.1.7.1 Saudi Arabia Organic Peroxide Market Estimates and Forecasts, by Type (2020-2032) (USD Billion)

9.5.1.7.2 Saudi Arabia Organic Peroxide Market Estimates and Forecasts, by Application (2020-2032) (USD Billion)

9.5.1.8 Qatar

9.5.1.8.1 Qatar Organic Peroxide Market Estimates and Forecasts, by Type (2020-2032) (USD Billion)

9.5.1.8.2 Qatar Organic Peroxide Market Estimates and Forecasts, by Application (2020-2032) (USD Billion)

9.5.1.9 Rest of Middle East

9.5.1.9.1 Rest of Middle East Organic Peroxide Market Estimates and Forecasts, by Type (2020-2032) (USD Billion)

9.5.1.9.2 Rest of Middle East Organic Peroxide Market Estimates and Forecasts, by Application (2020-2032) (USD Billion)

9.5.2 Africa

9.5.2.1 Trends Analysis

9.5.2.2 Africa Organic Peroxide Market Estimates and Forecasts, by Country (2020-2032) (USD Billion)

9.5.2.3 Africa Organic Peroxide Market Estimates and Forecasts, by Type (2020-2032) (USD Billion)  

9.5.2.4 Africa Organic Peroxide Market Estimates and Forecasts, by Application (2020-2032) (USD Billion)

9.5.2.5 South Africa

9.5.2.5.1 South Africa Organic Peroxide Market Estimates and Forecasts, by Type (2020-2032) (USD Billion)

9.5.2.5.2 South Africa Organic Peroxide Market Estimates and Forecasts, by Application (2020-2032) (USD Billion)

9.5.2.6 Nigeria

9.5.2.6.1 Nigeria Organic Peroxide Market Estimates and Forecasts, by Type (2020-2032) (USD Billion)

9.5.2.6.2 Nigeria Organic Peroxide Market Estimates and Forecasts, by Application (2020-2032) (USD Billion)

9.6 Latin America

9.6.1 Trends Analysis

9.6.2 Latin America Organic Peroxide Market Estimates and Forecasts, by Country (2020-2032) (USD Billion)

9.6.3 Latin America Organic Peroxide Market Estimates and Forecasts, by Type (2020-2032) (USD Billion)  

9.6.4 Latin America Organic Peroxide Market Estimates and Forecasts, by Application (2020-2032) (USD Billion)

9.6.5 Brazil

9.6.5.1 Brazil Organic Peroxide Market Estimates and Forecasts, by Type (2020-2032) (USD Billion)

9.6.5.2 Brazil Organic Peroxide Market Estimates and Forecasts, by Application (2020-2032) (USD Billion)

9.6.6 Argentina

9.6.6.1 Argentina Organic Peroxide Market Estimates and Forecasts, by Type (2020-2032) (USD Billion)

9.6.6.2 Argentina Organic Peroxide Market Estimates and Forecasts, by Application (2020-2032) (USD Billion)

9.6.7 Colombia

9.6.7.1 Colombia Organic Peroxide Market Estimates and Forecasts, by Type (2020-2032) (USD Billion)

9.6.7.2 Colombia Organic Peroxide Market Estimates and Forecasts, by Application (2020-2032) (USD Billion)

9.6.8 Rest of Latin America

9.6.8.1 Rest of Latin America Organic Peroxide Market Estimates and Forecasts, by Type (2020-2032) (USD Billion)

9.6.8.2 Rest of Latin America Organic Peroxide Market Estimates and Forecasts, by Application (2020-2032) (USD Billion)

10. Company Profiles

           10.1 BASF SE

                          10.1.1 Company Overview

10.1.2 Financial

10.1.3 Product / Services Offered

10.1.4 SWOT Analysis

           10.2   Arkema Group

                           10.2.1 Company Overview

10.2.2 Financial

10.2.3 Product / Services Offered

10.2.4 SWOT Analysis

10.3 AkzoNobel N.V.

              10.3.1 Company Overview

10.3.2 Financial

10.3.3 Product / Services Offered

10.3.4 SWOT Analysis

10.4 PeroxyChem LLC

             10.4.1 Company Overview

10.4.2 Financial

10.4.3 Product / Services Offered

10.4.4 SWOT Analysis

10.5 Evonik Industries AG

             10.5.1 Company Overview

10.5.2 Financial

10.5.3 Product / Services Offered

10.5.4 SWOT Analysis

10.6 Huntsman Corporation

             10.6.1 Company Overview

10.6.2 Financial

10.6.3 Product / Services Offered

10.6.4 SWOT Analysis

10.7 NOF Corporation

             10.7.1 Company Overview

10.7.2 Financial

10.7.3 Product / Services Offered

10.7.4 SWOT Analysis

10.8 DOW Chemical Company

             10.8.1 Company Overview

10.8.2 Financial

10.8.3 Product / Services Offered

10.8.4 SWOT Analysis

10.9 Solvay S.A.

             10.9.1 Company Overview

10.9.2 Financial

10.9.3 Product / Services Offered

10.9.4 SWOT Analysis

10.10 Mitsubishi Gas Chemical Company, Inc.

             10.10.1 Company Overview

10.10.2 Financial

10.10.3 Product / Services Offered

10.10.4 SWOT Analysis

11. Use Cases and Best Practices

12. Conclusion

An accurate research report requires proper strategizing as well as implementation. There are multiple factors involved in the completion of good and accurate research report and selecting the best methodology to compete the research is the toughest part. Since the research reports we provide play a crucial role in any company’s decision-making process, therefore we at SNS Insider always believe that we should choose the best method which gives us results closer to reality. This allows us to reach at a stage wherein we can provide our clients best and accurate investment to output ratio.

Each report that we prepare takes a timeframe of 350-400 business hours for production. Starting from the selection of titles through a couple of in-depth brain storming session to the final QC process before uploading our titles on our website we dedicate around 350 working hours. The titles are selected based on their current market cap and the foreseen CAGR and growth.


The 5 steps process:

Step 1: Secondary Research:

Secondary Research or Desk Research is as the name suggests is a research process wherein, we collect data through the readily available information. In this process we use various paid and unpaid databases which our team has access to and gather data through the same. This includes examining of listed companies’ annual reports, Journals, SEC filling etc. Apart from this our team has access to various associations across the globe across different industries. Lastly, we have exchange relationships with various university as well as individual libraries.

Secondary Research

Step 2: Primary Research

When we talk about primary research, it is a type of study in which the researchers collect relevant data samples directly, rather than relying on previously collected data.  This type of research is focused on gaining content specific facts that can be sued to solve specific problems. Since the collected data is fresh and first hand therefore it makes the study more accurate and genuine.

We at SNS Insider have divided Primary Research into 2 parts.

Part 1 wherein we interview the KOLs of major players as well as the upcoming ones across various geographic regions. This allows us to have their view over the market scenario and acts as an important tool to come closer to the accurate market numbers. As many as 45 paid and unpaid primary interviews are taken from both the demand and supply side of the industry to make sure we land at an accurate judgement and analysis of the market.

This step involves the triangulation of data wherein our team analyses the interview transcripts, online survey responses and observation of on filed participants. The below mentioned chart should give a better understanding of the part 1 of the primary interview.

Primary Research

Part 2: In this part of primary research the data collected via secondary research and the part 1 of the primary research is validated with the interviews from individual consultants and subject matter experts.

Consultants are those set of people who have at least 12 years of experience and expertise within the industry whereas Subject Matter Experts are those with at least 15 years of experience behind their back within the same space. The data with the help of two main processes i.e., FGDs (Focused Group Discussions) and IDs (Individual Discussions). This gives us a 3rd party nonbiased primary view of the market scenario making it a more dependable one while collation of the data pointers.

Step 3: Data Bank Validation

Once all the information is collected via primary and secondary sources, we run that information for data validation. At our intelligence centre our research heads track a lot of information related to the market which includes the quarterly reports, the daily stock prices, and other relevant information. Our data bank server gets updated every fortnight and that is how the information which we collected using our primary and secondary information is revalidated in real time.

Data Bank Validation

Step 4: QA/QC Process

After all the data collection and validation our team does a final level of quality check and quality assurance to get rid of any unwanted or undesired mistakes. This might include but not limited to getting rid of the any typos, duplication of numbers or missing of any important information. The people involved in this process include technical content writers, research heads and graphics people. Once this process is completed the title gets uploader on our platform for our clients to read it.

Step 5: Final QC/QA Process:

This is the last process and comes when the client has ordered the study. In this process a final QA/QC is done before the study is emailed to the client. Since we believe in giving our clients a good experience of our research studies, therefore, to make sure that we do not lack at our end in any way humanly possible we do a final round of quality check and then dispatch the study to the client.

Key Segments:

By Type

  • Diacyl Peroxide

  • Ketone Peroxide

  • Percarbonates

  • Dialkyl Peroxides

  • Hydro Peroxides

  • Peroxy Ketals

  • Peroxyesters

  • Others

By Application

  • Chemicals & Plastics

  • Coatings & Adhesives

  • Elastomers

  • Paper & Textiles

  • Detergents

  • Personal Care

  • Other

Request for Segment Customization as per your Business Requirement: Segment Customization Request

Regional Coverage:

North America

  • US

  • Canada

  • Mexico

Europe

  • Eastern Europe

    • Poland

    • Romania

    • Hungary

    • Turkey

    • Rest of Eastern Europe

  • Western Europe

    • Germany

    • France

    • UK

    • Italy

    • Spain

    • Netherlands

    • Switzerland

    • Austria

    • Rest of Western Europe

Asia Pacific

  • China

  • India

  • Japan

  • South Korea

  • Vietnam

  • Singapore

  • Australia

  • Rest of Asia Pacific

Middle East & Africa

  • Middle East

    • UAE

    • Egypt

    • Saudi Arabia

    • Qatar

    • Rest of Middle East

  • Africa

    • Nigeria

    • South Africa

    • Rest of Africa

  • Latin America

  • Brazil

  • Argentina

  • Colombia

  • Rest of Latin America

Request for Country Level Research Report: Country Level Customization Request

Available Customization

With the given market data, SNS Insider offers customization as per the company’s specific needs. The following customization options are available for the report:

  • Product Analysis

  • Criss-Cross segment analysis (e.g. Product X Application)

  • Product Matrix which gives a detailed comparison of the product portfolio of each company

  • Geographic Analysis

  • Additional countries in any of the regions

  • Company Information

  • Detailed analysis and profiling of additional market players (Up to five)


  •            5000 (33% Discount)


  •            8950 (40% Discount)


  •            3050 (23% Discount)

Start a Conversation

Hi! Click one of our member below to chat on Phone