image

Organic Electronics Market Report Scope & Overview:

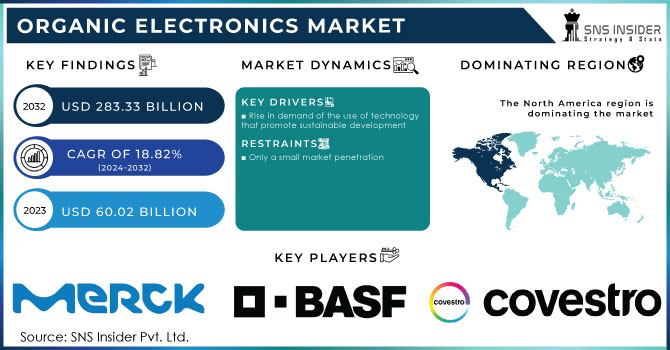
The Organic Electronics Market was valued at USD 58.86 billion in 2023 and is expected to reach USD 283.67 billion by 2032, growing at a CAGR of 19.14% over the forecast period 2024-2032. The increasing demand for flexible displays, wearable sensors, and sustainable energy solutions is leading to the rapid adoption of the Organic Electronics Market across industries. Such gains in performance, leading to increased charge carrier mobility, improved quantum efficiency, and enhanced material stability, are fostering innovation in applications ranging from OLEDs and organic photovoltaics (OPVs) to bioelectronics. Recent manufacturing breakthroughs like roll-to-roll printing and inkjet deposition mitigate manufacturing costs on a large scale. These organic batteries and supercapacitors are promising due to their lightweight structure, biodegradability, and better charge-discharge cycles for next-generation portable and flexible energy solutions, thus finding their way into energy storage.

Organic Electronics Market Revenue Analysis

Get PDF Sample Report on Organic Electronics Market - Request Sample Report

Market Dynamics

Key Drivers: 

  • Rising Demand for OLEDs and Sustainable Tech Driving Organic Electronics Growth

The major factors fueling the organic electronics market include the wide use of OLED technology in consumer electronics, such as Smartphones, televisions, and wearable devices. Driven by a continuous need for flexible, lightweight, and energy-efficient electronic devices, organic semiconductors have been developed and researched extensively. Improvements in organic photovoltaics (OPVs) and organic thin-film transistors (OTFTs) are also accelerating their use in both energy and display applications. This, coupled with the increasing research and development (R&D) investments by prominent players, and rising government support to implement sustainable and green electronic solutions further propelling the market growth. Meanwhile, the automotive sector is seeing greater penetration of organic electronic elements into smart dashboards, HUDs, and ambient lighting, boosting user experience and energy efficiency.

Restrain: 

  • Challenges in Organic Electronics Include Material Instability Environmental Vulnerability and Performance Limitations for Advanced Applications

The relative instability and short lifetime of organic material compared to traditional silicon-based electronics is one of the major problems for the organic electronics market. Organic semiconductors have a higher vulnerability to environmental factors like moisture, oxygen, and UV exposure, which causes degradation over time. This raises reliability issues, especially for long-lifetime applications, such as automotive and aerospace electronics. Moreover, the performance metrics of organic electronic devices, especially the charge carrier mobility and switching frequencies, are yet inferior compared to those of conventional semiconductor technologies, limiting their practical applications in high-speed computing and processing.

Opportunity:

  • Emerging Opportunities in Organic Electronics for Healthcare Wearables Smart Textiles IoT and Sustainable Technologies

Potential openings in the organic electronics marketplace are for rising applications like bioelectronics, smart textiles, and healthcare diagnostics. As organic materials are increasingly being incorporated into printed electronics and wearables, this technology has strong potential for growth. Further development of biodegradable and eco-friendly electronics is in full agreement with international ecological regulatory requirements, driving the interest in organic materials. Moreover, lucrative growth prospects are anticipated to be gained owing to the application of organic electronics in IoT-enabled smart devices and energy-efficient lighting systems. However, as production costs lower and performance rises, the growth will spread into various sectors of the market, including aerospace, defense, and medical devices.

Challenges:

  • Scaling Challenges in Organic Electronics Include Manufacturing Complexity Integration Issues and Material Development Needs

A major hurdle, however, is the complexity of large-scale manufacturing and integration of congregated organic electronic parts. Organic electronics do not utilize conventional silicon-based manufacture, instead requiring specialized techniques to print and coat the materials that need to be of uniform quality and high precision. Until manufacturers work towards a common kit of parts in terms of manufacturing processes for materials, this will continue to hinder widespread adoption. In addition, the existing electronic systems with which organic components need to be integrated are typically hugely incompatible, limiting the seamless integration of organic components into mainstream technology. Even though a lot of progress continues to be made, the existing challenge of further development in material properties and the development of scalable production processes is still one of the most important challenges for organic electronics to be widely commercialized.

Segments Analysis

By Material

In 2023, the market share by semiconductor accounted for 41.6% while the semiconductor segment is anticipated to grow at the fastest CAGR during the forecast period (2024 - 2032). This growth is also due to the rising use of organic semiconductors in OLED, organic photovoltaics, and flexible electronics. They have found demand in applications such as consumer electronic devices, automotive applications, and healthcare beneficiary devices mostly due to their benefits of lightweight, mechanical flexibility, and energy efficiency over traditional alternatives. Also, improvements in organic thin-film transistors (OTFTs) and organic light-emitting diodes (OLEDs) are boosting their performance to target the next-generation electronics. Continued R&D work is anticipated to still enhance the stability of the materials and diversify their applications.

By Application

In 2023, the market share of the display was leading with 47.3%, and it is expected to grow at the fastest CAGR between 2024 and 2032. This growth is primarily driven by the increasing usage of OLED screens across smartphones, televisions, laptops, wearables, and other industrial applications. The quality of the flexible and foldable display technologies continuously improving, which also accelerates adoption, especially in consumer electronics. The growing adoption of energy-efficient and high-contrast display solutions is driving manufacturers to innovate in organic display technology. Further, automotive applications such as organic displays in dashboards and infotainment systems, and, entering application areas such as AR/VR devices driving new growth opportunities for the market.

By End User

In 2023, the market share of Consumer Electronics was 52.8% influenced by increased adoption of OLED displays,  wearables, and flexible electronics. Market growth is mainly propelled by the growing demand for high-resolution, lightweight, and energy-efficient display technologies in smartphones, tablets, and smartwatches.

During the forecast period of 2024 to 2032, the growth of the healthcare sector is likely to witness the fastest CAGR, owing to advances in areas such as organic bioelectronics, wearable health monitoring devices, and flexible medical sensors. An increase in the utilization of organic biosensors in electronic skin, implantable medical devices, and real-time patient monitoring is anticipated to fuel demand growth in the sector.

Regional Analysis

Asia Pacific accounted for a share of 34.7% in 2023. China, Japan, and South Korea have carved up the world market in everything from organic semiconductors to flexible displays to fancy-pants consumer electronics. Samsung Display, LG Display, and others lead the way with high-end OLEDs for smartphones, TVs, and wearables. China is also investing massively in organic photovoltaics (OPVs) and printed electronics, which are providing low-cost, rapid deployment solutions. Government support programs for flexible electronics and smart manufacturing are accelerating innovation and large-scale production in the region, adding to market dominance.

North America is anticipated to exhibit the highest CAGR during 2024-2032 owing to the progressions in organic bioelectronics, healthcare applications, and automotive developments. The rising use of organic sensors, electronic skin, and implantable medical devices is propelling growth in the healthcare industry. With organic electronics incorporated into bands, even wearable health-monitoring devices would also be embedded into organic electronics by companies like Apple and Google, putting forth real-time diagnostics. The introduction of organic LED (OLED) displays in vehicle dashboards and infotainment systems by Tesla and General Motors is driving the demand growth in the automotive sector. In addition, heavy R&D investments from institutions such as MIT and Stanford are also developing flexible electronics and organic computing, laying the foundation for continuous growth in the area.

Organic-Electronics-Market-Regional-Analysis-2023

Get Customized Report as per your Business Requirement - Request For Customized Report

Key players

Some of the major players in the Organic Electronics Market are:

  • Merck KGaA (Germany) (Silicon Dielectrics for Flexible OLEDs)

  • BASF SE (Organic Semiconductor Materials)

  • Covestro AG (Polycarbonate Films for Flexible Displays)

  • DuPont (Inks for Printed Electronics)

  • AUO Corporation (OLED Display Panels)

  • Sony Corporation (OLED Televisions)

  • Samsung Display (South Korea) (Flexible AMOLED Displays)

  • LG Display Co., Ltd. (Flexible OLED Displays)

  • Sumitomo Chemical Co., Ltd. (Organic Semiconductor Materials)

  • Universal Display Corporation (Phosphorescent OLED Materials)

  • FlexEnable (Flexible Organic LCD Displays)

  • Nanosys (Quantum Dot Enhancement Film)

  • Plextronics (Conductive Inks for Organic Solar Cells)

  • BOE Technology (Flexible OLED Displays)

  • Royole Corporation (Flexible Displays and Sensors)

Recent Trends

  • In November 2024, Smartkem and AUO joined forces to develop next-generation rollable, transparent microLED displays using OTFT technology, aiming for cost-effective mass production and commercialization.

  • In November 2024, Samsung Display plans to increase production of small and mid-sized organic light-emitting diode (OLED) panels by 10% next year, driven by growing demand for tablets and foldable devices.

Organic Electronics Market Report Scope:

Report Attributes Details
Market Size in 2023 USD 58.86 Billion
Market Size by 2032 USD 283.67 Billion
CAGR CAGR of 19.14% From 2024 to 2032
Base Year 2023
Forecast Period 2024-2032
Historical Data 2020-2022
Report Scope & Coverage Market Size, Segments Analysis, Competitive  Landscape, Regional Analysis, DROC & SWOT Analysis, Forecast Outlook
Key Segments • By Material (Semiconductor, Conductive, Dielectric, Substrate)
• By Application (Display, Lighting, Solar Cells, System Components, Others)
• By End User (Consumer Electronics, Healthcare, Automotive, Energy, Aerospace & Defense, Others)
Regional Analysis/Coverage North America (US, Canada, Mexico), Europe (Eastern Europe [Poland, Romania, Hungary, Turkey, Rest of Eastern Europe] Western Europe] Germany, France, UK, Italy, Spain, Netherlands, Switzerland, Austria, Rest of Western Europe]), Asia Pacific (China, India, Japan, South Korea, Vietnam, Singapore, Australia, Rest of Asia Pacific), Middle East & Africa (Middle East [UAE, Egypt, Saudi Arabia, Qatar, Rest of Middle East], Africa [Nigeria, South Africa, Rest of Africa], Latin America (Brazil, Argentina, Colombia, Rest of Latin America)
Company Profiles Merck KGaA, BASF SE, Covestro AG, DuPont, AUO Corporation, Sony Corporation, Samsung Display, LG Display Co., Ltd., Sumitomo Chemical Co., Ltd., Universal Display Corporation, FlexEnable, Nanosys, Plextronics, BOE Technology, Royole Corporation.

Frequently Asked Questions

Ans: The Organic Electronics Market is expected to grow at a CAGR of 19.14% during 2024-2032.

Ans: Organic Electronics Market size was USD 58.86 billion in 2023 and is expected to Reach USD 283.67 billion by 2032.

Ans: The major growth factor of the Organic Electronics Market is the increasing demand for flexible, lightweight, and energy-efficient electronic devices, driven by advancements in OLED displays, organic photovoltaics (OPVs), and wearable electronics.

Ans: The Semiconductor segment dominated the Organic Electronics Market in 2023.

Ans: Asia Pacific dominated the Organic Electronics Market in 2023.

Table of Content

1. Introduction

1.1 Market Definition

1.2 Scope (Inclusion and Exclusions)

1.3 Research Assumptions

2. Executive Summary

2.1 Market Overview

2.2 Regional Synopsis

2.3 Competitive Summary

3. Research Methodology

3.1 Top-Down Approach

3.2 Bottom-up Approach

3.3. Data Validation

3.4 Primary Interviews

4. Market Dynamics Impact Analysis

4.1 Market Driving Factors Analysis

4.1.1 Drivers

4.1.2 Restraints

4.1.3 Opportunities

4.1.4 Challenges

4.2 PESTLE Analysis

4.3 Porter’s Five Forces Model

5. Statistical Insights and Trends Reporting

5.1 Performance & Application-Specific Metrics

5.2 Manufacturing & Process Optimization Metrics

      5.3 Energy Storage-Specific Metrics

      5.4 Adoption & Demand-Side Metrics

6. Competitive Landscape

6.1 List of Major Companies, By Region

6.2 Market Share Analysis, By Region

6.3 Product Benchmarking

6.3.1 Product specifications and features

6.3.2 Pricing

6.4 Strategic Initiatives

6.4.1 Marketing and Promotional Activities

6.4.2 Distribution and Supply Chain Strategies

6.4.3 Expansion plans and new product launches

6.4.4 Strategic partnerships and collaborations

6.5 Technological Advancements

6.6 Market Positioning and Branding

7. Organic Electronics Market Segmentation, By Material

7.1 Chapter Overview

7.2 Semiconductor

7.2.1 Semiconductor Market Trends Analysis (2020-2032)

7.2.2 Semiconductor Market Size Estimates and Forecasts to 2032 (USD Billion)

7.3 Conductive

7.3.1 Conductive Market Trends Analysis (2020-2032)

7.3.2 Conductive Market Size Estimates and Forecasts to 2032 (USD Billion)

7.4 Dielectric

7.4.1 Dielectric Market Trends Analysis (2020-2032)

7.4.2 Dielectric Market Size Estimates and Forecasts to 2032 (USD Billion)

7.5 Substrate

7.5.1 Substrate Market Trends Analysis (2020-2032)

7.5.2 Substrate Market Size Estimates and Forecasts to 2032 (USD Billion)

8. Organic Electronics Market Segmentation, By Application

8.1 Chapter Overview

8.2 Display

8.2.1 Display Market Trends Analysis (2020-2032)

8.2.2 Display Market Size Estimates and Forecasts to 2032 (USD Billion)

8.3 Lighting

8.3.1 Lighting Market Trends Analysis (2020-2032)

8.3.2 Lighting Market Size Estimates and Forecasts to 2032 (USD Billion)

8.4 Solar Cells

8.4.1 Solar Cells Market Trends Analysis (2020-2032)

8.4.2 Solar Cells Market Size Estimates and Forecasts to 2032 (USD Billion)

8.5 System Components

8.5.1 System Components Market Trends Analysis (2020-2032)

8.5.2 System Components Market Size Estimates and Forecasts to 2032 (USD Billion)

8.6 Others

8.6.1 Others Market Trends Analysis (2020-2032)

8.6.2 Others Market Size Estimates and Forecasts to 2032 (USD Billion)

9. Organic Electronics Market Segmentation, By End User

9.1 Chapter Overview

9.2 Consumer Electronics

9.2.1 Consumer Electronics Market Trends Analysis (2020-2032)

9.2.2 Consumer Electronics Market Size Estimates and Forecasts to 2032 (USD Billion)

9.3 Healthcare

              9.3.1 Healthcare Market Trends Analysis (2020-2032)

9.3.2 Healthcare Market Size Estimates and Forecasts to 2032 (USD Billion)

9.4 Automotive

              9.4.1 Automotive Market Trends Analysis (2020-2032)

9.4.2 Automotive Market Size Estimates and Forecasts to 2032 (USD Billion)

9.5 Energy

              9.5.1 Energy Market Trends Analysis (2020-2032)

9.5.2 Energy Market Size Estimates and Forecasts to 2032 (USD Billion)

9.6 Aerospace & Defense

              9.6.1 Aerospace & Defense Market Trends Analysis (2020-2032)

9.6.2 Aerospace & Defense Market Size Estimates and Forecasts to 2032 (USD Billion)

9.7 Others

              9.7.1 Others Market Trends Analysis (2020-2032)

9.7.2 Others Market Size Estimates and Forecasts to 2032 (USD Billion)

10. Regional Analysis

10.1 Chapter Overview

10.2 North America

10.2.1 Trends Analysis

10.2.2 North America Organic Electronics Market Estimates and Forecasts, by Country (2020-2032) (USD Billion)

10.2.3 North America Organic Electronics Market Estimates and Forecasts, By Material (2020-2032) (USD Billion) 

10.2.4 North America Organic Electronics Market Estimates and Forecasts, By Application (2020-2032) (USD Billion)

10.2.5 North America Organic Electronics Market Estimates and Forecasts, By End User (2020-2032) (USD Billion)

10.2.6 USA

10.2.6.1 USA Organic Electronics Market Estimates and Forecasts, By Material (2020-2032) (USD Billion)

10.2.6.2 USA Organic Electronics Market Estimates and Forecasts, By Application (2020-2032) (USD Billion)

10.2.6.3 USA Organic Electronics Market Estimates and Forecasts, By End User (2020-2032) (USD Billion)

10.2.7 Canada

10.2.7.1 Canada Organic Electronics Market Estimates and Forecasts, By Material (2020-2032) (USD Billion)

10.2.7.2 Canada Organic Electronics Market Estimates and Forecasts, By Application (2020-2032) (USD Billion)

10.2.7.3 Canada Organic Electronics Market Estimates and Forecasts, By End User (2020-2032) (USD Billion)

10.2.8 Mexico

10.2.8.1 Mexico Organic Electronics Market Estimates and Forecasts, By Material (2020-2032) (USD Billion)

10.2.8.2 Mexico Organic Electronics Market Estimates and Forecasts, By Application (2020-2032) (USD Billion)

10.2.8.3 Mexico Organic Electronics Market Estimates and Forecasts, By End User (2020-2032) (USD Billion)

10.3 Europe

10.3.1 Eastern Europe

10.3.1.1 Trends Analysis

10.3.1.2 Eastern Europe Organic Electronics Market Estimates and Forecasts, by Country (2020-2032) (USD Billion)

10.3.1.3 Eastern Europe Organic Electronics Market Estimates and Forecasts, By Material (2020-2032) (USD Billion) 

10.3.1.4 Eastern Europe Organic Electronics Market Estimates and Forecasts, By Application (2020-2032) (USD Billion)

10.3.1.5 Eastern Europe Organic Electronics Market Estimates and Forecasts, By End User (2020-2032) (USD Billion)

10.3.1.6 Poland

10.3.1.6.1 Poland Organic Electronics Market Estimates and Forecasts, By Material (2020-2032) (USD Billion)

10.3.1.6.2 Poland Organic Electronics Market Estimates and Forecasts, By Application (2020-2032) (USD Billion)

10.3.1.6.3 Poland Organic Electronics Market Estimates and Forecasts, By End User (2020-2032) (USD Billion)

10.3.1.7 Romania

10.3.1.7.1 Romania Organic Electronics Market Estimates and Forecasts, By Material (2020-2032) (USD Billion)

10.3.1.7.2 Romania Organic Electronics Market Estimates and Forecasts, By Application (2020-2032) (USD Billion)

10.3.1.7.3 Romania Organic Electronics Market Estimates and Forecasts, By End User (2020-2032) (USD Billion)

10.3.1.8 Hungary

10.3.1.8.1 Hungary Organic Electronics Market Estimates and Forecasts, By Material (2020-2032) (USD Billion)

10.3.1.8.2 Hungary Organic Electronics Market Estimates and Forecasts, By Application (2020-2032) (USD Billion)

10.3.1.8.3 Hungary Organic Electronics Market Estimates and Forecasts, By End User (2020-2032) (USD Billion)

10.3.1.9 Turkey

10.3.1.9.1 Turkey Organic Electronics Market Estimates and Forecasts, By Material (2020-2032) (USD Billion)

10.3.1.9.2 Turkey Organic Electronics Market Estimates and Forecasts, By Application (2020-2032) (USD Billion)

10.3.1.9.3 Turkey Organic Electronics Market Estimates and Forecasts, By End User (2020-2032) (USD Billion)

10.3.1.10 Rest of Eastern Europe

10.3.1.10.1 Rest of Eastern Europe Organic Electronics Market Estimates and Forecasts, By Material (2020-2032) (USD Billion)

10.3.1.10.2 Rest of Eastern Europe Organic Electronics Market Estimates and Forecasts, By Application (2020-2032) (USD Billion)

10.3.1.10.3 Rest of Eastern Europe Organic Electronics Market Estimates and Forecasts, By End User (2020-2032) (USD Billion)

10.3.2 Western Europe

10.3.2.1 Trends Analysis

10.3.2.2 Western Europe Organic Electronics Market Estimates and Forecasts, by Country (2020-2032) (USD Billion)

10.3.2.3 Western Europe Organic Electronics Market Estimates and Forecasts, By Material (2020-2032) (USD Billion) 

10.3.2.4 Western Europe Organic Electronics Market Estimates and Forecasts, By Application (2020-2032) (USD Billion)

10.3.2.5 Western Europe Organic Electronics Market Estimates and Forecasts, By End User (2020-2032) (USD Billion)

10.3.2.6 Germany

10.3.2.6.1 Germany Organic Electronics Market Estimates and Forecasts, By Material (2020-2032) (USD Billion)

10.3.2.6.2 Germany Organic Electronics Market Estimates and Forecasts, By Application (2020-2032) (USD Billion)

10.3.2.6.3 Germany Organic Electronics Market Estimates and Forecasts, By End User (2020-2032) (USD Billion)

10.3.2.7 France

10.3.2.7.1 France Organic Electronics Market Estimates and Forecasts, By Material (2020-2032) (USD Billion)

10.3.2.7.2 France Organic Electronics Market Estimates and Forecasts, By Application (2020-2032) (USD Billion)

10.3.2.7.3 France Organic Electronics Market Estimates and Forecasts, By End User (2020-2032) (USD Billion)

10.3.2.8 UK

10.3.2.8.1 UK Organic Electronics Market Estimates and Forecasts, By Material (2020-2032) (USD Billion)

10.3.2.8.2 UK Organic Electronics Market Estimates and Forecasts, By Application (2020-2032) (USD Billion)

10.3.2.8.3 UK Organic Electronics Market Estimates and Forecasts, By End User (2020-2032) (USD Billion)

10.3.2.9 Italy

10.3.2.9.1 Italy Organic Electronics Market Estimates and Forecasts, By Material (2020-2032) (USD Billion)

10.3.2.9.2 Italy Organic Electronics Market Estimates and Forecasts, By Application (2020-2032) (USD Billion)

10.3.2.9.3 Italy Organic Electronics Market Estimates and Forecasts, By End User (2020-2032) (USD Billion)

10.3.2.10 Spain

10.3.2.10.1 Spain Organic Electronics Market Estimates and Forecasts, By Material (2020-2032) (USD Billion)

10.3.2.10.2 Spain Organic Electronics Market Estimates and Forecasts, By Application (2020-2032) (USD Billion)

10.3.2.10.3 Spain Organic Electronics Market Estimates and Forecasts, By End User (2020-2032) (USD Billion)

10.3.2.11 Netherlands

10.3.2.11.1 Netherlands Organic Electronics Market Estimates and Forecasts, By Material (2020-2032) (USD Billion)

10.3.2.11.2 Netherlands Organic Electronics Market Estimates and Forecasts, By Application (2020-2032) (USD Billion)

10.3.2.11.3 Netherlands Organic Electronics Market Estimates and Forecasts, By End User (2020-2032) (USD Billion)

10.3.2.12 Switzerland

10.3.2.12.1 Switzerland Organic Electronics Market Estimates and Forecasts, By Material (2020-2032) (USD Billion)

10.3.2.12.2 Switzerland Organic Electronics Market Estimates and Forecasts, By Application (2020-2032) (USD Billion)

10.3.2.12.3 Switzerland Organic Electronics Market Estimates and Forecasts, By End User (2020-2032) (USD Billion)

10.3.2.13 Austria

10.3.2.13.1 Austria Organic Electronics Market Estimates and Forecasts, By Material (2020-2032) (USD Billion)

10.3.2.13.2 Austria Organic Electronics Market Estimates and Forecasts, By Application (2020-2032) (USD Billion)

10.3.2.13.3 Austria Organic Electronics Market Estimates and Forecasts, By End User (2020-2032) (USD Billion)

10.3.2.14 Rest of Western Europe

10.3.2.14.1 Rest of Western Europe Organic Electronics Market Estimates and Forecasts, By Material (2020-2032) (USD Billion)

10.3.2.14.2 Rest of Western Europe Organic Electronics Market Estimates and Forecasts, By Application (2020-2032) (USD Billion)

10.3.2.14.3 Rest of Western Europe Organic Electronics Market Estimates and Forecasts, By End User (2020-2032) (USD Billion)

10.4 Asia Pacific

10.4.1 Trends Analysis

10.4.2 Asia Pacific Organic Electronics Market Estimates and Forecasts, by Country (2020-2032) (USD Billion)

10.4.3 Asia Pacific Organic Electronics Market Estimates and Forecasts, By Material (2020-2032) (USD Billion) 

10.4.4 Asia Pacific Organic Electronics Market Estimates and Forecasts, By Application (2020-2032) (USD Billion)

10.4.5 Asia Pacific Organic Electronics Market Estimates and Forecasts, By End User (2020-2032) (USD Billion)

10.4.6 China

10.4.6.1 China Organic Electronics Market Estimates and Forecasts, By Material (2020-2032) (USD Billion)

10.4.6.2 China Organic Electronics Market Estimates and Forecasts, By Application (2020-2032) (USD Billion)

10.4.6.3 China Organic Electronics Market Estimates and Forecasts, By End User (2020-2032) (USD Billion)

10.4.7 India

10.4.7.1 India Organic Electronics Market Estimates and Forecasts, By Material (2020-2032) (USD Billion)

10.4.7.2 India Organic Electronics Market Estimates and Forecasts, By Application (2020-2032) (USD Billion)

10.4.7.3 India Organic Electronics Market Estimates and Forecasts, By End User (2020-2032) (USD Billion)

10.4.8 Japan

10.4.8.1 Japan Organic Electronics Market Estimates and Forecasts, By Material (2020-2032) (USD Billion)

10.4.8.2 Japan Organic Electronics Market Estimates and Forecasts, By Application (2020-2032) (USD Billion)

10.4.8.3 Japan Organic Electronics Market Estimates and Forecasts, By End User (2020-2032) (USD Billion)

10.4.9 South Korea

10.4.9.1 South Korea Organic Electronics Market Estimates and Forecasts, By Material (2020-2032) (USD Billion)

10.4.9.2 South Korea Organic Electronics Market Estimates and Forecasts, By Application (2020-2032) (USD Billion)

10.4.9.3 South Korea Organic Electronics Market Estimates and Forecasts, By End User (2020-2032) (USD Billion)

10.4.10 Vietnam

10.4.10.1 Vietnam Organic Electronics Market Estimates and Forecasts, By Material (2020-2032) (USD Billion)

10.4.10.2 Vietnam Organic Electronics Market Estimates and Forecasts, By Application (2020-2032) (USD Billion)

10.4.10.3 Vietnam Organic Electronics Market Estimates and Forecasts, By End User (2020-2032) (USD Billion)

10.4.11 Singapore

10.4.11.1 Singapore Organic Electronics Market Estimates and Forecasts, By Material (2020-2032) (USD Billion)

10.4.11.2 Singapore Organic Electronics Market Estimates and Forecasts, By Application (2020-2032) (USD Billion)

10.4.11.3 Singapore Organic Electronics Market Estimates and Forecasts, By End User (2020-2032) (USD Billion)

10.4.12 Australia

10.4.12.1 Australia Organic Electronics Market Estimates and Forecasts, By Material (2020-2032) (USD Billion)

10.4.12.2 Australia Organic Electronics Market Estimates and Forecasts, By Application (2020-2032) (USD Billion)

10.4.12.3 Australia Organic Electronics Market Estimates and Forecasts, By End User (2020-2032) (USD Billion)

10.4.13 Rest of Asia Pacific

10.4.13.1 Rest of Asia Pacific Organic Electronics Market Estimates and Forecasts, By Material (2020-2032) (USD Billion)

10.4.13.2 Rest of Asia Pacific Organic Electronics Market Estimates and Forecasts, By Application (2020-2032) (USD Billion)

10.4.13.3 Rest of Asia Pacific Organic Electronics Market Estimates and Forecasts, By End User (2020-2032) (USD Billion)

10.5 Middle East and Africa

10.5.1 Middle East

10.5.1.1 Trends Analysis

10.5.1.2 Middle East Organic Electronics Market Estimates and Forecasts, by Country (2020-2032) (USD Billion)

10.5.1.3 Middle East Organic Electronics Market Estimates and Forecasts, By Material (2020-2032) (USD Billion) 

10.5.1.4 Middle East Organic Electronics Market Estimates and Forecasts, By Application (2020-2032) (USD Billion)

10.5.1.5 Middle East Organic Electronics Market Estimates and Forecasts, By End User (2020-2032) (USD Billion)

10.5.1.6 UAE

10.5.1.6.1 UAE Organic Electronics Market Estimates and Forecasts, By Material (2020-2032) (USD Billion)

10.5.1.6.2 UAE Organic Electronics Market Estimates and Forecasts, By Application (2020-2032) (USD Billion)

10.5.1.6.3 UAE Organic Electronics Market Estimates and Forecasts, By End User (2020-2032) (USD Billion)

10.5.1.7 Egypt

10.5.1.7.1 Egypt Organic Electronics Market Estimates and Forecasts, By Material (2020-2032) (USD Billion)

10.5.1.7.2 Egypt Organic Electronics Market Estimates and Forecasts, By Application (2020-2032) (USD Billion)

10.5.1.7.3 Egypt Organic Electronics Market Estimates and Forecasts, By End User (2020-2032) (USD Billion)

10.5.1.8 Saudi Arabia

10.5.1.8.1 Saudi Arabia Organic Electronics Market Estimates and Forecasts, By Material (2020-2032) (USD Billion)

10.5.1.8.2 Saudi Arabia Organic Electronics Market Estimates and Forecasts, By Application (2020-2032) (USD Billion)

10.5.1.8.3 Saudi Arabia Organic Electronics Market Estimates and Forecasts, By End User (2020-2032) (USD Billion)

10.5.1.9 Qatar

10.5.1.9.1 Qatar Organic Electronics Market Estimates and Forecasts, By Material (2020-2032) (USD Billion)

10.5.1.9.2 Qatar Organic Electronics Market Estimates and Forecasts, By Application (2020-2032) (USD Billion)

10.5.1.9.3 Qatar Organic Electronics Market Estimates and Forecasts, By End User (2020-2032) (USD Billion)

10.5.1.10 Rest of Middle East

10.5.1.10.1 Rest of Middle East Organic Electronics Market Estimates and Forecasts, By Material (2020-2032) (USD Billion)

10.5.1.10.2 Rest of Middle East Organic Electronics Market Estimates and Forecasts, By Application (2020-2032) (USD Billion)

10.5.1.10.3 Rest of Middle East Organic Electronics Market Estimates and Forecasts, By End User (2020-2032) (USD Billion)

10.5.2 Africa

10.5.2.1 Trends Analysis

10.5.2.2 Africa Organic Electronics Market Estimates and Forecasts, by Country (2020-2032) (USD Billion)

10.5.2.3 Africa Organic Electronics Market Estimates and Forecasts, By Material (2020-2032) (USD Billion) 

10.5.2.4 Africa Organic Electronics Market Estimates and Forecasts, By Application (2020-2032) (USD Billion)

10.5.2.5 Africa Organic Electronics Market Estimates and Forecasts, By End User (2020-2032) (USD Billion)

10.5.2.6 South Africa

10.5.2.6.1 South Africa Organic Electronics Market Estimates and Forecasts, By Material (2020-2032) (USD Billion)

10.5.2.6.2 South Africa Organic Electronics Market Estimates and Forecasts, By Application (2020-2032) (USD Billion)

10.5.2.6.3 South Africa Organic Electronics Market Estimates and Forecasts, By End User (2020-2032) (USD Billion)

10.5.2.7 Nigeria

10.5.2.7.1 Nigeria Organic Electronics Market Estimates and Forecasts, By Material (2020-2032) (USD Billion)

10.5.2.7.2 Nigeria Organic Electronics Market Estimates and Forecasts, By Application (2020-2032) (USD Billion)

10.5.2.7.3 Nigeria Organic Electronics Market Estimates and Forecasts, By End User (2020-2032) (USD Billion)

10.5.2.8 Rest of Africa

10.5.2.8.1 Rest of Africa Organic Electronics Market Estimates and Forecasts, By Material (2020-2032) (USD Billion)

10.5.2.8.2 Rest of Africa Organic Electronics Market Estimates and Forecasts, By Application (2020-2032) (USD Billion)

10.5.2.8.3 Rest of Africa Organic Electronics Market Estimates and Forecasts, By End User (2020-2032) (USD Billion)

10.6 Latin America

10.6.1 Trends Analysis

10.6.2 Latin America Organic Electronics Market Estimates and Forecasts, by Country (2020-2032) (USD Billion)

10.6.3 Latin America Organic Electronics Market Estimates and Forecasts, By Material (2020-2032) (USD Billion) 

10.6.4 Latin America Organic Electronics Market Estimates and Forecasts, By Application (2020-2032) (USD Billion)

10.6.5 Latin America Organic Electronics Market Estimates and Forecasts, By End User (2020-2032) (USD Billion)

10.6.6 Brazil

10.6.6.1 Brazil Organic Electronics Market Estimates and Forecasts, By Material (2020-2032) (USD Billion)

10.6.6.2 Brazil Organic Electronics Market Estimates and Forecasts, By Application (2020-2032) (USD Billion)

10.6.6.3 Brazil Organic Electronics Market Estimates and Forecasts, By End User (2020-2032) (USD Billion)

10.6.7 Argentina

10.6.7.1 Argentina Organic Electronics Market Estimates and Forecasts, By Material (2020-2032) (USD Billion)

10.6.7.2 Argentina Organic Electronics Market Estimates and Forecasts, By Application (2020-2032) (USD Billion)

10.6.7.3 Argentina Organic Electronics Market Estimates and Forecasts, By End User (2020-2032) (USD Billion)

10.6.8 Colombia

10.6.8.1 Colombia Organic Electronics Market Estimates and Forecasts, By Material (2020-2032) (USD Billion)

10.6.8.2 Colombia Organic Electronics Market Estimates and Forecasts, By Application (2020-2032) (USD Billion)

10.6.8.3 Colombia Organic Electronics Market Estimates and Forecasts, By End User (2020-2032) (USD Billion)

10.6.9 Rest of Latin America

10.6.9.1 Rest of Latin America Organic Electronics Market Estimates and Forecasts, By Material (2020-2032) (USD Billion)

10.6.9.2 Rest of Latin America Organic Electronics Market Estimates and Forecasts, By Application (2020-2032) (USD Billion)

10.6.9.3 Rest of Latin America Organic Electronics Market Estimates and Forecasts, By End User (2020-2032) (USD Billion)

11. Company Profiles

11.1 Merck KGaA.

11.1.1 Company Overview

11.1.2 Financial

11.1.3 Products/ Services Offered

11.1.4 SWOT Analysis

11.2 BASF SE

11.2.1 Company Overview

11.2.2 Financial

11.2.3 Products/ Services Offered

11.2.4 SWOT Analysis

11.3 Covestro AG

11.3.1 Company Overview

11.3.2 Financial

11.3.3 Products/ Services Offered

11.3.4 SWOT Analysis

11.4 DuPont

11.4.1 Company Overview

11.4.2 Financial

11.4.3 Products/ Services Offered

11.4.4 SWOT Analysis

11.5 AUO Corporation

11.5.1 Company Overview

11.5.2 Financial

11.5.3 Products/ Services Offered

11.5.4 SWOT Analysis

11.6 Sony Corporation

11.6.1 Company Overview

11.6.2 Financial

11.6.3 Products/ Services Offered

11.6.4 SWOT Analysis

11.7 Samsung Display.

11.7.1 Company Overview

11.7.2 Financial

11.7.3 Products/ Services Offered

11.7.4 SWOT Analysis

11.8 LG Display Co., Ltd.

11.8.1 Company Overview

11.8.2 Financial

11.8.3 Products/ Services Offered

11.8.4 SWOT Analysis

11.9 Sumitomo Chemical Co., Ltd

11.9.1 Company Overview

11.9.2 Financial

11.9.3 Products/ Services Offered

11.9.4 SWOT Analysis

11.10 Universal Display Corporation

11.10.1 Company Overview

11.10.2 Financial

11.10.3 Products/ Services Offered

11.10.4 SWOT Analysis

12. Use Cases and Best Practices

13. Conclusion

An accurate research report requires proper strategizing as well as implementation. There are multiple factors involved in the completion of good and accurate research report and selecting the best methodology to compete the research is the toughest part. Since the research reports we provide play a crucial role in any company’s decision-making process, therefore we at SNS Insider always believe that we should choose the best method which gives us results closer to reality. This allows us to reach at a stage wherein we can provide our clients best and accurate investment to output ratio.

Each report that we prepare takes a timeframe of 350-400 business hours for production. Starting from the selection of titles through a couple of in-depth brain storming session to the final QC process before uploading our titles on our website we dedicate around 350 working hours. The titles are selected based on their current market cap and the foreseen CAGR and growth.


The 5 steps process:

Step 1: Secondary Research:

Secondary Research or Desk Research is as the name suggests is a research process wherein, we collect data through the readily available information. In this process we use various paid and unpaid databases which our team has access to and gather data through the same. This includes examining of listed companies’ annual reports, Journals, SEC filling etc. Apart from this our team has access to various associations across the globe across different industries. Lastly, we have exchange relationships with various university as well as individual libraries.

Secondary Research

Step 2: Primary Research

When we talk about primary research, it is a type of study in which the researchers collect relevant data samples directly, rather than relying on previously collected data.  This type of research is focused on gaining content specific facts that can be sued to solve specific problems. Since the collected data is fresh and first hand therefore it makes the study more accurate and genuine.

We at SNS Insider have divided Primary Research into 2 parts.

Part 1 wherein we interview the KOLs of major players as well as the upcoming ones across various geographic regions. This allows us to have their view over the market scenario and acts as an important tool to come closer to the accurate market numbers. As many as 45 paid and unpaid primary interviews are taken from both the demand and supply side of the industry to make sure we land at an accurate judgement and analysis of the market.

This step involves the triangulation of data wherein our team analyses the interview transcripts, online survey responses and observation of on filed participants. The below mentioned chart should give a better understanding of the part 1 of the primary interview.

Primary Research

Part 2: In this part of primary research the data collected via secondary research and the part 1 of the primary research is validated with the interviews from individual consultants and subject matter experts.

Consultants are those set of people who have at least 12 years of experience and expertise within the industry whereas Subject Matter Experts are those with at least 15 years of experience behind their back within the same space. The data with the help of two main processes i.e., FGDs (Focused Group Discussions) and IDs (Individual Discussions). This gives us a 3rd party nonbiased primary view of the market scenario making it a more dependable one while collation of the data pointers.

Step 3: Data Bank Validation

Once all the information is collected via primary and secondary sources, we run that information for data validation. At our intelligence centre our research heads track a lot of information related to the market which includes the quarterly reports, the daily stock prices, and other relevant information. Our data bank server gets updated every fortnight and that is how the information which we collected using our primary and secondary information is revalidated in real time.

Data Bank Validation

Step 4: QA/QC Process

After all the data collection and validation our team does a final level of quality check and quality assurance to get rid of any unwanted or undesired mistakes. This might include but not limited to getting rid of the any typos, duplication of numbers or missing of any important information. The people involved in this process include technical content writers, research heads and graphics people. Once this process is completed the title gets uploader on our platform for our clients to read it.

Step 5: Final QC/QA Process:

This is the last process and comes when the client has ordered the study. In this process a final QA/QC is done before the study is emailed to the client. Since we believe in giving our clients a good experience of our research studies, therefore, to make sure that we do not lack at our end in any way humanly possible we do a final round of quality check and then dispatch the study to the client.

Key Segments:

By Material

  • Semiconductor

  • Conductive

  • Dielectric

  • Substrate

By Application

  • Display

  • Lighting

  • Solar Cells

  • System Components

  • Others

By End User

  • Consumer Electronics

  • Healthcare

  • Automotive

  • Energy

  • Aerospace & Defense

  • Others

Request for Segment Customization as per your Business Requirement: Segment Customization Request

Regional Coverage:

North America

  • US

  • Canada

  • Mexico

Europe

  • Eastern Europe

    • Poland

    • Romania

    • Hungary

    • Turkey

    • Rest of Eastern Europe

  • Western Europe

    • Germany

    • France

    • UK

    • Italy

    • Spain

    • Netherlands

    • Switzerland

    • Austria

    • Rest of Western Europe

Asia Pacific

  • China

  • India

  • Japan

  • South Korea

  • Vietnam

  • Singapore

  • Australia

  • Rest of Asia Pacific

Middle East & Africa

  • Middle East

    • UAE

    • Egypt

    • Saudi Arabia

    • Qatar

    • Rest of Middle East

  • Africa

    • Nigeria

    • South Africa

    • Rest of Africa

Latin America

  • Brazil

  • Argentina

  • Colombia

  • Rest of Latin America

Request for Country Level Research Report: Country Level Customization Request

Available Customization

With the given market data, SNS Insider offers customization as per the company’s specific needs. The following customization options are available for the report:

  • Detailed Volume Analysis

  • Criss-Cross segment analysis (e.g. Product X Application)

  • Competitive Product Benchmarking

  • Geographic Analysis

  • Additional countries in any of the regions

  • Customized Data Representation

  • Detailed analysis and profiling of additional market players


  •            5000 (33% Discount)


  •            8950 (40% Discount)


  •            3050 (23% Discount)

Start a Conversation

Hi! Click one of our member below to chat on Phone