image

Optoelectronics Market Report Scope & Overview:

Optoelectronics market Revenue Analysis

Get More Information on Optoelectronics market - Request Sample Report

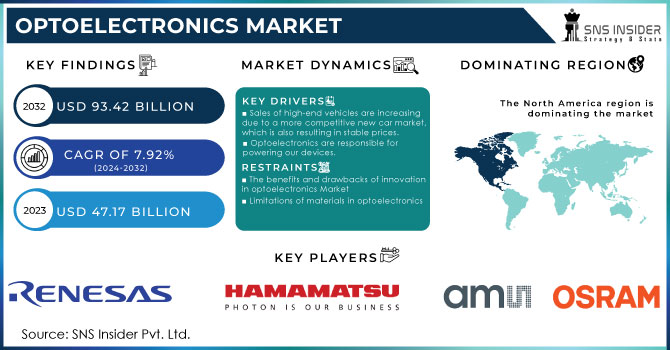
The Optoelectronics market size was valued at USD 47.17 Billion in 2023 and is expected to reach a market size of USD 93.42 billion by the end of 2032 at CAGR about 7.92% during the forecast period of 2024-2032.

The optoelectronics market is thriving due to the strong influence of the consumer electronics industry. Optoelectronic components are essential for the advanced features on our smartphones and impressive display quality on our TVs. Consider Light-Emitting Diodes (LEDs) as an example. These efficient machines light up the backlights of our devices. Major consumer electronics firms such as Samsung use LEDs in their QLED TVs to achieve better brightness, color accuracy, and energy efficiency when compared to older LCD models. Optical electronics excel in displays as well. OLED displays, which are recognized for their deep black levels and expansive viewing angles, utilize OLED materials to transform electricity into light. LG, a major competitor, is leading the way in OLED technology by incorporating it into their smartphones and TVs. Optoelectronic sensors are integrated into our devices, allowing for functions such as adjusting screen brightness automatically, activating sleep mode based on proximity detection, and recognizing faces. Photo detectors enable these sensors to function by transforming light into electrical signals. Broadcom, a leading player in the semiconductor industry, showcases this through its wide range of optoelectronic sensors created especially for use in consumer electronics. The endless consumer demand for increasingly higher resolution screens, feature-packed functions, and energy-saving devices will lead to a definite increase in the demand for optoelectronic components. The close connection between consumer electronics and optoelectronics guarantees a mutually advantageous future. With the advancement of display technology, we anticipate seeing innovative uses of optoelectronics in future consumer electronics.

The constantly increasing need for quicker and more effective optoelectronic devices such as LEDs, lasers, and photo detectors is driving an exciting competition for the next major advancement. Scientists are exploring new areas such as ultrafast optics and 2D materials to expand the limits of potential outcomes. In the field of ultrafast optics, researchers are pursuing the fastest speed possible by controlling light at quadrillions of cycles per second. Picture lasers shooting brief femtosecond pulses. These ultrafast lasers, led by companies such as Menlo Microsystems, could transform industries like telecommunications, data processing, and medical imaging. Fast data transmission through fiber optic cables may become achievable, allowing for the rapid transfer of large quantities of data instantaneously. The exciting realm of 2D materials is found beyond the boundaries of speed. These extremely thin substances, with a thickness of just one atom, have distinct characteristics that show great potential for the advancement of optoelectronics in the future. Their outstanding conductance of electricity and interaction with light could result in the creation of revolutionary devices. Picture LEDs that are not just efficient but also capable of being flexible and see-through. This has the potential to lead to new display technologies and possibly light-emitting textiles Samsung and other companies are currently conducting research on 2D materials to develop advanced displays that are brighter, more energy-efficient, and possibly foldable for upcoming mobile devices. The constant drive for speed and effectiveness in optoelectronics is creating a vibrant research environment, with ultrafast optics and 2D materials at the forefront. 

Market dynamics

Drivers

  • Sales of high-end vehicles are increasing due to a more competitive new car market, which is also resulting in stable prices.

With prices increasing quickly, the new-car market is currently experiencing a period of reevaluation. Although there was a rise in total sales compared to last year, retail sales are declining due to elevated retail prices and rising loan rates. This development is leading manufacturers to focus on luxury and high-end models, which saw the highest sales in January 2023. This trend can be seen in the average transaction price (ATP), which remains elevated compared to the manufacturer's suggested retail price (MSRP) but is beginning to decline. These changes in the market are being driven by a big trend in expensive cars. Their portion of overall sales hit an all-time high of 19.6% in January, driving up the average industry ATP even with a small drop in luxury ATP. It is intriguing that some luxury car buyers are still willing to pay above MSRP for certain models, although the difference is decreasing. This pattern is also seen in the non-luxury sector, with average transaction prices (ATPs) decreasing slightly each month, possibly because of higher incentives provided by manufacturers. Electric cars (EVs) are also a topic of interest. Despite still being more expensive than the industry norm, the average cost of purchasing a new EV decreased significantly in January due to Tesla's major price reductions as the leading competitor in the market. The drop in price probably helped boost Tesla's sales by more than 30% compared to the previous year. The market for new vehicles is changing. Although luxury car sales are increasing and prices are leveling off, worries about affordability persist among price-conscious shoppers. With supply chain problems improving and manufacturers adapting incentives, the market is projected to reach a new balance in the upcoming months.

  • Optoelectronics are responsible for powering our devices.

The flourishing optoelectronics market is heavily influenced by the consumer electronics industry. Optoelectronic components, from our TVs' crystal-clear displays to our smartphones' feature-packed functionality, are the unsung heroes enabling it all. Consider Light-Emitting Diodes (LEDs) as an example. These efficient machines provide light for the screens of our devices, guaranteeing bright colors and clear images. Major companies such as Samsung utilize LEDs in their QLED televisions to achieve superior brightness, color accuracy, and energy efficiency in comparison to conventional LCD models. The screens also showcase the capabilities of optoelectronics. OLED displays, well known for their rich blacks and expansive viewing angles, utilize OLED materials to transform electricity into light. LG and other companies are leading the way in OLED technology by incorporating it into their advanced smartphones and televisions. Optoelectronic sensors are integrated into our gadgets, allowing for various functions such as adjusting screen brightness automatically, triggering sleep mode with proximity detection, and implementing facial recognition technology. These sensors depend on photo detectors, which are optoelectronic devices transforming light into electrical signals. Broadcom, a well-known company in the semiconductor sector, demonstrates this by offering a wide range of optoelectronic sensors tailored for use in consumer electronics.

Restraints

  • The benefits and drawbacks of innovation in optoelectronics Market

Innovation drives the optoelectronics market, yet the rapid pace of advancement can present difficulties. The fast development of display and electronic information instrument technology brings both opportunities and challenges for the optoelectronics industry. Advancements in displays and instruments contribute to the need for enhanced optoelectronic components. Customers desire increasingly higher resolution, slimmer gadgets, and additional features - all of which are crucial areas where advanced optoelectronics are essential. This fast speed may also impede market expansion in the immediate future. The push towards smaller electronics is posing challenges for companies designing components used in light transmission within electronics. Not only does this raise production expenses, but it also poses a threat of products becoming outdated rapidly with the emergence of newer technologies.

  • Limitations of materials in optoelectronics

Despite its ability to transform different industries, optoelectronics is held back by limitations in materials. Certain optoelectronic components require specialized materials that are not as easy to obtain as silicon, which is commonly used in traditional electronics. Such limitations can have a notable effect on the ability to expand production and can impede the widespread use of optoelectronic technologies. One major issue is the reliance on rare earth elements (REEs). Even though their name sounds fancy, these components are actually quite common in the Earth's crust. The extraction and processing are frequently concentrated in specific geographical locations, with only a few countries controlling the global REE supply chain. This focus results in a weakness for the optoelectronics sector.

Segment Analysis

By Device

Light-emitting Diodes (LEDs) held a significant market share of 30% in the optoelectronics market in 2023. This increased energy efficiency results in reduced electricity expenses and a more environmentally friendly impact. LEDs, unlike large incandescent bulbs, are available in a wide range of sizes and colors, making them suitable for a variety of uses, from commercial lighting to small indicator lights. Their impressive longevity leads to lower maintenance expenses and less frequent changing of bulbs. LEDs offer advantages that extend further than just being good for the environment. Their ability to adapt to various situations is also a significant asset they have. LEDs come in many different sizes and colors, making them perfect for a wide variety of purposes, unlike traditional big incandescent bulbs. LEDs are useful in a range of situations, from illuminating commercial structures to functioning as small indicator lights in electronic gadgets. Their extended duration leads to substantial reductions in expenses. Samsung, a leading player in the LED market, showcases its supremacy through offering a diverse range of LED choices that lessen the necessity for frequent replacements. New creative applications to drive the growth of LED technology, solidifying its leadership in the ever-evolving optoelectronics industry.

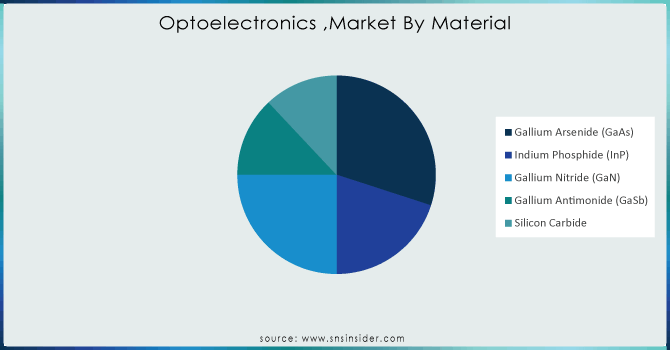
In terms of material, Gallium Arsenide (GaAs) is projected to dominate the optoelectronics market in 2023, holding a 30% market share. This material possesses numerous distinctive characteristics which make it perfect for various optoelectronic gadgets.A key benefit of GaAs is its capability to support the seamless movement of electrons. This results in more effective and brighter LEDs, which are the light-emitting diodes that light up our devices and structures. GaAs is distinguished from other materials by its possession of a "direct bandgap," making it ideal for producing and detecting superior quality light. This feature is essential for GaAs to be an important element in solar cells and fiber optic sensors, where effective light conversion is critical. GaAs also excels in terms of its speed. Its crucial role in mobile networks and data centers is due to its high-speed signal transmission capability, which is vital for rapid data processing. Companies including TriQuint Semiconductor utilize the high-speed capabilities of GaAs to produce high-performance components for these challenging applications.With the increasing need for quicker data transfer, higher quality screens, and effective solar options, GaAs's distinct features make it an essential material. The efficient emission of light, detection, and high-speed signal transmission capabilities of GaAs ensure its continued importance in the constantly changing optoelectronics market.

Optoelectronics-Market-By-Material

Need any customization research on optoelectronics market- Enquiry Now

Regional Analysis

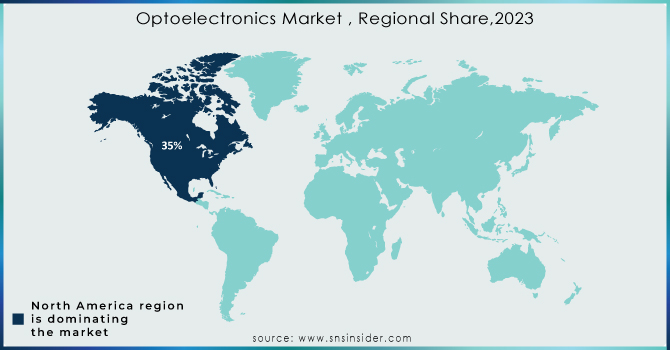
In 2023, North America dominates the optoelectronics market with a 35% share. This control is powered by various important factors including the thriving automotive industry in the area. The increasing need for premium vehicles equipped with cutting-edge functions, such as autonomous driving capabilities and complex lighting systems, requires creative optoelectronic parts. North American car makers are leading the way in integrating these innovations, which is driving growth in the optoelectronics industry. Automotive, North America has a strong foundation of industry participants. These companies invest heavily in research and development, continuously pushing the limits of optoelectronic technology. This emphasis on creativity helps North America maintain its position as a frontrunner in the industry. The area gives priority to improvements in intelligent infrastructure and automation technologies. Optical and electrical components are vital in such projects, from smart traffic control systems to automated manufacturing processes. The increasing number of specialized facilities in the US focused on manufacturing advanced optoelectronic devices demonstrates this dedication. These amenities will continue to reinforce North America's dominance in the optoelectronics market for years to come.

In 2023, the Asia Pacific region dominates with a 31% market share and is witnessing the fastest growth in optoelectronics market. Countries such as China and India have strong economies and a growing consumer electronics sector, which fuels the demand for optoelectronic components used in displays and LEDs. Governments actively encourage domestic industries by implementing supportive policies and investing in research and development (R&D). China's robust electronics sector and expanding manufacturing industry led to increased need for these parts. South Korea's strong automotive sector, which accounts for more than 10% of manufacturing, is expanding thanks to investments in automation that depend on optoelectronic components. Increasing vehicle manufacturing and consumption throughout Asia Pacific indicate a substantial market potential.

Optoelectronics-Market--Regional-Share2023

Key Players

Some of major key Players in optoelectronics market are Renesas Electronics Corporation, ams-OSRAM AG, Hamamatsu Photonics K.K., ROHM Co., Ltd., Samsung Electronics Co., Ltd., Jenoptik AG, Semiconductor Components Industries LLC, Sharp Corporation, Sony Semiconductor Solutions Corporation, TT Electronics, Vishay Intertechnology, Inc., Toshiba Electronic Devices & Storage Corporation and others

Recent Development

  • In February 2024, TSMC, Sony Semiconductor Solutions Corporation, DENSO Corporation, and Toyota Motor Corporation revealed additional funding for Japan Advanced Semiconductor Manufacturing, Inc. ("JASM"), TSMC's majority-owned subsidiary in Kumamoto Prefecture, Japan. The investment aims to establish a new fab, set to be operational by the end of 2027. With the Japanese government's strong backing, JASM's total investment will surpass $20 billion when its initial fab starts operating in 2024.

  • In January 2024, Osram Licht AG introduced a new range of side-looking, low-power LEDs that make design easier, easier to implement, and allow for a uniform look in long light bars and other car rear lighting uses. Automotive manufacturers can achieve a uniform appearance throughout the width of the vehicle by substituting toplooker LEDs with SYNIOS P1515 sidelookers. An RCL or turn indicator can be made with a thinner and simpler optical assembly using the same amount of LEDs found in a top-looker-based arrangement.

Optoelectronics Market Report Scope:

Report Attributes Details
Market Size in 2023 US$ 47.17  Billion 
Market Size by 2032 US$ 93.42 Billion 
CAGR CAGR of 7.92% From 2024 to 2032
Base Year 2023
Forecast Period 2024-2032
Historical Data 2020-2022
Report Scope & Coverage Market Size, Segments Analysis, Competitive  Landscape, Regional Analysis, DROC & SWOT Analysis, Forecast Outlook
Key Segments • By Device (Light-emitting Diodes (LEDs), Laser Diodes, Solar Cells, Photodiodes, Image Sensors, Others (Optoisolators, Phototransistors, etc.))
• By Material (Gallium Arsenide (GaAs), Indium Phosphide (InP), Gallium Nitride (GaN), Gallium Antimonide (GaSb)  ,Silicon Carbide)
• By End User (Automotive, Aerospace & Defense, Consumer Electronics, IT & Telecommunication, Healthcare, Energy & Power, Others (Research & Academia, Industrial, etc.))
Regional Analysis/Coverage North America (US, Canada, Mexico), Europe (Eastern Europe [Poland, Romania, Hungary, Turkey, Rest of Eastern Europe] Western Europe] Germany, France, UK, Italy, Spain, Netherlands, Switzerland, Austria, Rest of Western Europe]), Asia Pacific (China, India, Japan, South Korea, Vietnam, Singapore, Australia, Rest of Asia Pacific), Middle East & Africa (Middle East [UAE, Egypt, Saudi Arabia, Qatar, Rest of Middle East], Africa [Nigeria, South Africa, Rest of Africa], Latin America (Brazil, Argentina, Colombia, Rest of Latin America)
Company Profiles Renesas Electronics Corporation , ams-OSRAM AG, Hamamatsu Photonics K.K. ,ROHM Co., Ltd., Samsung Electronics Co., Ltd. ,Jenoptik AG ,Semiconductor Components Industries LLC , Sharp Corporation, Sony Semiconductor Solutions Corporation ,TT Electronics ,Vishay Intertechnology, Inc. , Toshiba Electronic Devices & Storage Corporation and others.
Key Drivers • Sales of high-end vehicles are increasing due to a more competitive new car market, which is also resulting in stable prices.
• Optoelectronics are responsible for powering our devices.
RESTRAINTS • The benefits and drawbacks of innovation in optoelectronics Market

• Limitations of materials in optoelectronics


Frequently Asked Questions

Ans. The optoelectronics market is driven by advancements in consumer electronics, government initiatives, and the increasing demand for optoelectronic components in the automotive industry.

Ans. The Optoelectronics market size was USD 47.17 Billion in 2023 & expects a good growth by reaching USD 93.42 billion till end of 2032 at CAGR about 7.92% during forecast period 2024-2032.

Ans. Asia Pacific region is anticipated to record the Fastest Growing in the Optoelectronics Market.

Ans .The Light-emitting Diodes (LEDs) systems is leading in the market revenue share in 2023.          

Ans. North America is to hold the largest market share in the Optoelectronics Market   during the forecast period.

TABLE OF CONTENTS

1. Introduction

1.1 Market Definition

1.2 Scope

1.3 Research Assumptions

2. Industry Flowchart

3. Research Methodology

4. Market Dynamics

4.1 Drivers

4.2 Restraints

4.3 Opportunities

4.4 Challenges

5. Porter’s 5 Forces Model

6. Pest Analysis

7. Optoelectronics Market Segmentation, by Device

7.1 Introduction

7.2 Light-emitting Diodes (LEDs)

7.3 Laser Diodes

7.4Solar Cells

7.5 Photodiodes

7.6 Image Sensors

7.7 Others (Optoisolators, Phototransistors, etc.)

8. Optoelectronics Market Segmentation, by Material

8.1 Introduction

8.2 Gallium Arsenide (GaAs)

8.3 Indium Phosphide (InP)

8.4 Gallium Nitride (GaN)

8.5 Gallium Antimonide (GaSb)

8.6 Silicon Carbide

9. Optoelectronics Market Segmentation, by End User

9.1 Introduction

9.2 Automotive

9.3 Aerospace & Defense

9.4 Consumer Electronics

9.5 IT & Telecommunication

9.6 Healthcare

9.7 Energy & Power

9.8 Others (Research & Academia, Industrial, etc.)

10. Regional Analysis

10.1 Introduction

10.2 North America

10.2.1 Trend Analysis

10.2.2 North America Optoelectronics Market by Country

10.2.3 North America Optoelectronics Market by Device

10.2.4 North America Optoelectronics Market by Material

10.2.5 North America Optoelectronics Market by End User

10.2.6 USA

10.2.6.1 USA Optoelectronics Market by Device

10.2.6.2 USA Optoelectronics Market by Material

10.2.6.3 USA Optoelectronics Market by End User

10.2.7 Canada

10.2.7.1 Canada Optoelectronics Market by Device

10.2.7.2 Canada Optoelectronics Market by Material

10.2.7.3 Canada Optoelectronics Market by End User

10.2.8 Mexico

10.2.8.1 Mexico Optoelectronics Market by Device

10.2.8.2 Mexico Optoelectronics Market by Material

10.2.8.3 Mexico Optoelectronics Market by End User

10.3 Europe

10.3.1 Trend Analysis

10.3.2 Eastern Europe

10.3.2.1 Eastern Europe Optoelectronics Market by Country

10.3.2.2 Eastern Europe Optoelectronics Market by Device

10.3.2.3 Eastern Europe Optoelectronics Market by Material

10.3.2.4 Eastern Europe Optoelectronics Market by End User

10.3.2.5 Poland

10.3.2.5.1 Poland Optoelectronics Market by Device

10.3.2.5.2 Poland Optoelectronics Market by Material

10.3.2.5.3 Poland Optoelectronics Market by End User

10.3.2.6 Romania

10.3.2.6.1 Romania Optoelectronics Market by Device

10.3.2.6.2 Romania Optoelectronics Market by Material

10.3.2.6.4 Romania Optoelectronics Market by End User

10.3.2.7 Hungary

10.3.2.7.1 Hungary Optoelectronics Market by Device

10.3.2.7.2 Hungary Optoelectronics Market by Material

10.3.2.7.3 Hungary Optoelectronics Market by End User

10.3.2.8 Turkey

10.3.2.8.1 Turkey Optoelectronics Market by Device

10.3.2.8.2 Turkey Optoelectronics Market by Material

10.3.2.8.3 Turkey Optoelectronics Market by End User

10.3.2.9 Rest of Eastern Europe

10.3.2.9.1 Rest of Eastern Europe Optoelectronics Market by Device

10.3.2.9.2 Rest of Eastern Europe Optoelectronics Market by Material

10.3.2.9.3 Rest of Eastern Europe Optoelectronics Market by End User

10.3.3 Western Europe

10.3.3.1 Western Europe Optoelectronics Market by Country

10.3.3.2 Western Europe Optoelectronics Market by Device

10.3.3.3 Western Europe Optoelectronics Market by Material

10.3.3.4 Western Europe Optoelectronics Market by End User

10.3.3.5 Germany

10.3.3.5.1 Germany Optoelectronics Market by Device

10.3.3.5.2 Germany Optoelectronics Market by Material

10.3.3.5.3 Germany Optoelectronics Market by End User

10.3.3.6 France

10.3.3.6.1 France Optoelectronics Market by Device

10.3.3.6.2 France Optoelectronics Market by Material

10.3.3.6.3 France Optoelectronics Market by End User

10.3.3.7 UK

10.3.3.7.1 UK Optoelectronics Market by Device

10.3.3.7.2 UK Optoelectronics Market by Material

10.3.3.7.3 UK Optoelectronics Market by End User

10.3.3.8 Italy

10.3.3.8.1 Italy Optoelectronics Market by Device

10.3.3.8.2 Italy Optoelectronics Market by Material

10.3.3.8.3 Italy Optoelectronics Market by End User

10.3.3.9 Spain

10.3.3.9.1 Spain Optoelectronics Market by Device

10.3.3.9.2 Spain Optoelectronics Market by Material

10.3.3.9.3 Spain Optoelectronics Market by End User

10.3.3.10 Netherlands

10.3.3.10.1 Netherlands Optoelectronics Market by Device

10.3.3.10.2 Netherlands Optoelectronics Market by Material

10.3.3.10.3 Netherlands Optoelectronics Market by End User

10.3.3.11 Switzerland

10.3.3.11.1 Switzerland Optoelectronics Market by Device

10.3.3.11.2 Switzerland Optoelectronics Market by Material

10.3.3.11.3 Switzerland Optoelectronics Market by End User

10.3.3.12 Austria

10.3.3.12.1 Austria Optoelectronics Market by Device

10.3.3.12.2 Austria Optoelectronics Market by Material

10.3.3.12.3 Austria Optoelectronics Market by End User

10.3.3.13 Rest of Western Europe

10.3.3.13.1 Rest of Western Europe Optoelectronics Market by Device

10.3.3.13.2 Rest of Western Europe Optoelectronics Market by Material

10.3.3.13.3 Rest of Western Europe Optoelectronics Market by End User

10.4 Asia-Pacific

10.4.1 Trend Analysis

10.4.2 Asia-Pacific Optoelectronics Market by Country

10.4.3 Asia-Pacific Optoelectronics Market by Device

10.4.4 Asia-Pacific Optoelectronics Market by Material

10.4.5 Asia-Pacific Optoelectronics Market by End User

10.4.6 China

10.4.6.1 China Optoelectronics Market by Device

10.4.6.2 China Optoelectronics Market by Material

10.4.6.3 China Optoelectronics Market by End User

10.4.7 India

10.4.7.1 India Optoelectronics Market by Device

10.4.7.2 India Optoelectronics Market by Material

10.4.7.3 India Optoelectronics Market by End User

10.4.8 Japan

10.4.8.1 Japan Optoelectronics Market by Device

10.4.8.2 Japan Optoelectronics Market by Material

10.4.8.3 Japan Optoelectronics Market by End User

10.4.9 South Korea

10.4.9.1 South Korea Optoelectronics Market by Device

10.4.9.2 South Korea Optoelectronics Market by Material

10.4.9.3 South Korea Optoelectronics Market by End User

10.4.10 Vietnam

10.4.10.1 Vietnam Optoelectronics Market by Device

10.4.10.2 Vietnam Optoelectronics Market by Material

10.4.10.3 Vietnam Optoelectronics Market by End User

10.4.11 Singapore

10.4.11.1 Singapore Optoelectronics Market by Device

10.4.11.2 Singapore Optoelectronics Market by Material

10.4.11.3 Singapore Optoelectronics Market by End User

10.4.12 Australia

10.4.12.1 Australia Optoelectronics Market by Device

10.4.12.2 Australia Optoelectronics Market by Material

10.4.12.3 Australia Optoelectronics Market by End User

10.4.13 Rest of Asia-Pacific

10.4.13.1 Rest of Asia-Pacific Optoelectronics Market by Device

10.4.13.2 Rest of Asia-Pacific Optoelectronics Market by Material

10.4.13.3 Rest of Asia-Pacific Optoelectronics Market by End User

10.5 Middle East & Africa

10.5.1 Trend Analysis

10.5.2 Middle East

10.5.2.1 Middle East Optoelectronics Market by Country

10.5.2.2 Middle East Optoelectronics Market by Device

10.5.2.3 Middle East Optoelectronics Market by Material

10.5.2.4 Middle East Optoelectronics Market by End User

10.5.2.5 UAE

10.5.2.5.1 UAE Optoelectronics Market by Device

10.5.2.5.2 UAE Optoelectronics Market by Material

10.5.2.5.3 UAE Optoelectronics Market by End User

10.5.2.6 Egypt

10.5.2.6.1 Egypt Optoelectronics Market by Device

10.5.2.6.2 Egypt Optoelectronics Market by Material

10.5.2.6.3 Egypt Optoelectronics Market by End User

10.5.2.7 Saudi Arabia

10.5.2.7.1 Saudi Arabia Optoelectronics Market by Device

10.5.2.7.2 Saudi Arabia Optoelectronics Market by Material

10.5.2.7.3 Saudi Arabia Optoelectronics Market by End User

10.5.2.8 Qatar

10.5.2.8.1 Qatar Optoelectronics Market by Device

10.5.2.8.2 Qatar Optoelectronics Market by Material

10.5.2.8.3 Qatar Optoelectronics Market by End User

10.5.2.9 Rest of Middle East

10.5.2.9.1 Rest of Middle East Optoelectronics Market by Device

10.5.2.9.2 Rest of Middle East Optoelectronics Market by Material

10.5.2.9.3 Rest of Middle East Optoelectronics Market by End User

10.5.3 Africa

10.5.3.1 Africa Optoelectronics Market by Country

10.5.3.2 Africa Optoelectronics Market by Device

10.5.3.3 Africa Optoelectronics Market by Material

10.5.3.4 Africa Optoelectronics Market by End User

10.5.3.5 Nigeria

10.5.3.5.1 Nigeria Optoelectronics Market by Device

10.5.3.5.2 Nigeria Optoelectronics Market by Material

10.5.3.5.3 Nigeria Optoelectronics Market by End User

10.5.3.6 South Africa

10.5.3.6.1 South Africa Optoelectronics Market by Device

10.5.3.6.2 South Africa Optoelectronics Market by Material

10.5.3.6.3 South Africa Optoelectronics Market by End User

10.5.3.7 Rest of Africa

10.5.3.7.1 Rest of Africa Optoelectronics Market by Device

10.5.3.7.2 Rest of Africa Optoelectronics Market by Material

10.5.3.7.3 Rest of Africa Optoelectronics Market by End User

10.6 Latin America

10.6.1 Trend Analysis

10.6.2 Latin America Optoelectronics Market by country

10.6.3 Latin America Optoelectronics Market by Device

10.6.4 Latin America Optoelectronics Market by Material

10.6.5 Latin America Optoelectronics Market by End User

10.6.6 Brazil

10.6.6.1 Brazil Optoelectronics Market by Device

10.6.6.2 Brazil Optoelectronics Market by Material

10.6.6.3 Brazil Optoelectronics Market by End User

10.6.7 Argentina

10.6.7.1 Argentina Optoelectronics Market by Device

10.6.7.2 Argentina Optoelectronics Market by Material

10.6.7.3 Argentina Optoelectronics Market by End User

10.6.8 Colombia

10.6.8.1 Colombia Optoelectronics Market by Device

10.6.8.2 Colombia Optoelectronics Market by Material

10.6.8.3 Colombia Optoelectronics Market by End User

10.6.9 Rest of Latin America

10.6.9.1 Rest of Latin America Optoelectronics Market by Device

10.6.9.2 Rest of Latin America Optoelectronics Market by Material

10.6.9.3 Rest of Latin America Optoelectronics Market by End User

11. Company Profiles

11.1 Renesas Electronics Corporation

11.1.1 Company Overview

11.1.2 Financial

11.1.3 Products/ Services Offered

11.1.4 The SNS View

11.2 ams-OSRAM AG

11.2.1 Company Overview

11.2.2 Financial

11.2.3 Products/ Services Offered

11.2.4 The SNS View

11.3 Hamamatsu Photonics K.K.

11.3.1 Company Overview

11.3.2 Financial

11.3.3 Products/ Services Offered

11.3.4 The SNS View

11.4 ROHM Co., Ltd.

11.4.1 Company Overview

11.4.2 Financial

11.4.3 Products/ Services Offered

11.4.4 The SNS View

11.5 Samsung Electronics Co., Ltd.

11.5.1 Company Overview

11.5.2 Financial

11.5.3 Products/ Services Offered

11.5.4 The SNS View

11.6 Jenoptik AG

11.6.1 Company Overview

11.6.2 Financial

11.6.3 Products/ Services Offered

11.6.4 The SNS View

11.7 Semiconductor Components Industries LLC

11.7.1 Company Overview

11.7.2 Financial

11.7.3 Products/ Services Offered

11.7.4 The SNS View

11.8 Sharp Corporation

11.8.1 Company Overview

11.8.2 Financial

11.8.3 Products/ Services Offered

11.8.4 The SNS View

11.9 Sony Semiconductor Solutions Corporation

11.9.1 Company Overview

11.9.2 Financial

11.9.3 Products/ Services Offered

11.9.4 The SNS View

11.10 TT Electronics

11.10.1 Company Overview

11.10.2 Financial

11.10.3 Products/ Services Offered

11.10.4 The SNS View

12. Competitive Landscape

12.1 Competitive Benchmarking

12.2 Market Share Analysis

12.3 Recent Developments

12.3.1 Industry News

12.3.2 Company News

12.3.3 Mergers & Acquisitions

13. Use Case and Best Practices

14. Conclusion

An accurate research report requires proper strategizing as well as implementation. There are multiple factors involved in the completion of good and accurate research report and selecting the best methodology to compete the research is the toughest part. Since the research reports we provide play a crucial role in any company’s decision-making process, therefore we at SNS Insider always believe that we should choose the best method which gives us results closer to reality. This allows us to reach at a stage wherein we can provide our clients best and accurate investment to output ratio.

Each report that we prepare takes a timeframe of 350-400 business hours for production. Starting from the selection of titles through a couple of in-depth brain storming session to the final QC process before uploading our titles on our website we dedicate around 350 working hours. The titles are selected based on their current market cap and the foreseen CAGR and growth.


The 5 steps process:

Step 1: Secondary Research:

Secondary Research or Desk Research is as the name suggests is a research process wherein, we collect data through the readily available information. In this process we use various paid and unpaid databases which our team has access to and gather data through the same. This includes examining of listed companies’ annual reports, Journals, SEC filling etc. Apart from this our team has access to various associations across the globe across different industries. Lastly, we have exchange relationships with various university as well as individual libraries.

Secondary Research

Step 2: Primary Research

When we talk about primary research, it is a type of study in which the researchers collect relevant data samples directly, rather than relying on previously collected data.  This type of research is focused on gaining content specific facts that can be sued to solve specific problems. Since the collected data is fresh and first hand therefore it makes the study more accurate and genuine.

We at SNS Insider have divided Primary Research into 2 parts.

Part 1 wherein we interview the KOLs of major players as well as the upcoming ones across various geographic regions. This allows us to have their view over the market scenario and acts as an important tool to come closer to the accurate market numbers. As many as 45 paid and unpaid primary interviews are taken from both the demand and supply side of the industry to make sure we land at an accurate judgement and analysis of the market.

This step involves the triangulation of data wherein our team analyses the interview transcripts, online survey responses and observation of on filed participants. The below mentioned chart should give a better understanding of the part 1 of the primary interview.

Primary Research

Part 2: In this part of primary research the data collected via secondary research and the part 1 of the primary research is validated with the interviews from individual consultants and subject matter experts.

Consultants are those set of people who have at least 12 years of experience and expertise within the industry whereas Subject Matter Experts are those with at least 15 years of experience behind their back within the same space. The data with the help of two main processes i.e., FGDs (Focused Group Discussions) and IDs (Individual Discussions). This gives us a 3rd party nonbiased primary view of the market scenario making it a more dependable one while collation of the data pointers.

Step 3: Data Bank Validation

Once all the information is collected via primary and secondary sources, we run that information for data validation. At our intelligence centre our research heads track a lot of information related to the market which includes the quarterly reports, the daily stock prices, and other relevant information. Our data bank server gets updated every fortnight and that is how the information which we collected using our primary and secondary information is revalidated in real time.

Data Bank Validation

Step 4: QA/QC Process

After all the data collection and validation our team does a final level of quality check and quality assurance to get rid of any unwanted or undesired mistakes. This might include but not limited to getting rid of the any typos, duplication of numbers or missing of any important information. The people involved in this process include technical content writers, research heads and graphics people. Once this process is completed the title gets uploader on our platform for our clients to read it.

Step 5: Final QC/QA Process:

This is the last process and comes when the client has ordered the study. In this process a final QA/QC is done before the study is emailed to the client. Since we believe in giving our clients a good experience of our research studies, therefore, to make sure that we do not lack at our end in any way humanly possible we do a final round of quality check and then dispatch the study to the client.

Key Segments:

By Device

  • Light-emitting Diodes (LEDs)

  • Laser Diodes

  • Solar Cells

  • Photodiodes

  • Image Sensors

  • Others (Optoisolators, Phototransistors, etc.)

By Material

  • Gallium Arsenide (GaAs)

  • Indium Phosphide (InP)

  • Gallium Nitride (GaN)

  • Gallium Antimonide (GaSb)

  • Silicon Carbide

By End User

  • Automotive

  • Aerospace & Defense

  • Consumer Electronics

  • IT & Telecommunication

  • Healthcare

  • Energy & Power

  • Others (Research & Academia, Industrial, etc.)

Request for Segment Customization as per your Business Requirement: Segment Customization Request

REGIONAL COVERAGE:

North America

  • US

  • Canada

  • Mexico

Europe

  • Eastern Europe

    • Poland

    • Romania

    • Hungary

    • Turkey

    • Rest of Eastern Europe

  • Western Europe

    • Germany

    • France

    • UK

    • Italy

    • Spain

    • Netherlands

    • Switzerland

    • Austria

    • Rest of Western Europe

Asia Pacific

  • China

  • India

  • Japan

  • South Korea

  • Vietnam

  • Singapore

  • Australia

  • Rest of Asia Pacific

Middle East & Africa

  • Middle East

    • UAE

    • Egypt

    • Saudi Arabia

    • Qatar

    • Rest of the Middle East

  • Africa

    • Nigeria

    • South Africa

    • Rest of Africa

Latin America

  • Brazil

  • Argentina

  • Colombia

Request for Country Level Research Report: Country Level Customization Request

Available Customization

With the given market data, SNS Insider offers customization as per the company’s specific needs. The following customization options are available for the report:

  • Product Analysis

  • Criss-Cross segment analysis (e.g. Product X Application)

  • Product Matrix which gives a detailed comparison of product portfolio of each company

  • Geographic Analysis

  • Additional countries in any of the regions

  • Company Information

  • Detailed analysis and profiling of additional market players (Up to five)


  •            5000 (33% Discount)


  •            8950 (40% Discount)


  •            3050 (23% Discount)

Start a Conversation

Hi! Click one of our member below to chat on Phone