Optical Transport Network (OTN) Market Size:
Get More Information on Optical Transport Network (OTN) Market - Request Sample Report
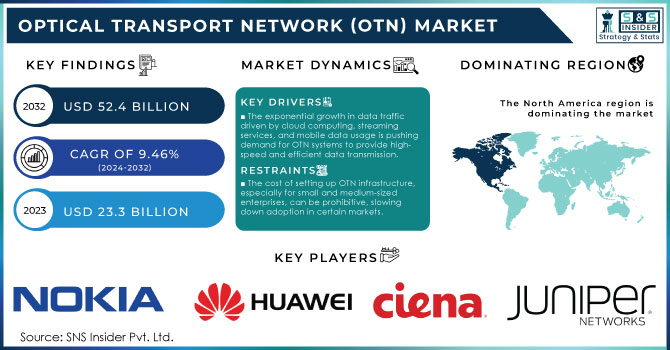
Optical Transport Network (OTN) Market Size was valued at USD 23.3 Billion in 2023 and is expected to reach USD 52.4 Billion by 2032, growing at a CAGR of 9.46% over the forecast period 2024-2032.
Optical Transport Network (OTN) Market growth is driven by rising digital infrastructure and growing investments in high-speed internet services globally. As per the International Telecommunication Union (ITU), 66% of people worldwide used the internet in 2023, which increased by over 5.3 billion users compared to 4.9 billion users in 2022. Governments worldwide have emphasized the need for robust digital infrastructure to support 5G, cloud services, and other high-bandwidth applications. In 2023, the U.S. Federal Communications Commission (FCC) revealed that it would spend another USD 2 billion on expanding rural broadband as part of its own Broadband Equity, Access, and Deployment (BEAD) program. Similarly, the European Commission set a target to achieve 5G connectivity across all urban areas by 2025, under its "Digital Decade Policy." Such initiatives demand highly efficient and scalable network infrastructures, particularly Optical Transport Networks (OTNs), which can handle massive data traffic with lower latency and higher bandwidth efficiency. Additionally, high-speed and low-latency data transmission networks are needed for the increasing adoption of IoT, automotive navigation systems, and AI-enabled servers (for big data processing), which is further driving the demand for optical networks. With smart city initiatives by countries and more cloud computing scenarios, the demand for optical transport networks (OTNs) with high capacity, flexibility, and cost-effectiveness has become significant. The China Academy of Information and Communications Technology (CAICT) reported that China's total internet data traffic surged by 33% in 2023, reflecting the increasing bandwidth needs driving OTN market growth.
The growth of smart cities is fuelling new opportunities for optical transport network (OTN) deployment, as applications like intelligent transportation systems and real-time surveillance depend on high-speed, reliable networks to handle large volumes of data. Simultaneously, the healthcare industry is emerging as an important vertical market for OTNs owing to increased telemedicine and EHR (electronic health record) use. The digitalization of healthcare becoming one of the top priority sectors for governments all over the globe only adds to it, leading to a persistent demand for OTN solutions that can scale high-capacity transmissions while land data movements can be made highly secured in such mission-critical and data-intensive sectors.
Market Dynamics
Driver
The exponential growth in data traffic driven by cloud computing, streaming services, and mobile data usage is pushing demand for OTN systems to provide high-speed and efficient data transmission.
The global deployment of 5G networks is accelerating the need for robust and scalable OTN infrastructure to handle the increased bandwidth requirements and low-latency communication.
With the proliferation of Internet of Things (IoT) devices across industries, the demand for fast and reliable data transfer solutions like OTN is on the rise, supporting seamless IoT communication.
The demand for high-speed connectivity has been driven by the rapid expansion of data-intensive applications, such as cloud computing, video streaming, and social media. According to recent reports, global internet traffic has been growing at an average annual rate of 30%, with projections estimating data traffic to exceed 400 exabytes per month by 2025. Services such as 4K and 8K streaming, typical gaming, virtual reality, and home working are driving this growth.
Optical Transport Networks (OTNs) play a major role in managing this exponential data growth by being capable of transmitting the data high capacity, and low latency over long distances. With critical sectors such as healthcare, finance, and education moving to the cloud (often requiring high connectivity services), this has translated into greater demand for reliable OTN infrastructure which can facilitate seamless inter-cloud connectivity. OTNs are also used by content delivery networks (CDN) such as Netflix and YouTube to handle high data traffic created by millions of users that access the services at once. Increased remote work and use of online collaboration tools e.g. Microsoft Teams, and Zoom have also stimulated the need for OTN solutions to sustain stable and high-quality connections at highspeed levels. Additionally, the Cisco Annual Internet Report predicts that by 2025, 66% of the global population will have internet access, intensifying the need for scalable OTN systems to support the growing volume of data and high-performance applications across the globe.
Restraints
The cost of setting up OTN infrastructure, especially for small and medium-sized enterprises, can be prohibitive, slowing down adoption in certain markets.
The complexity involved in managing and maintaining optical transport networks, especially for multi-vendor environments, can be a significant barrier for organizations looking to upgrade their networks.
As optical transport networks become critical for carrying large volumes of sensitive data, concerns over the security and vulnerability of these networks to cyberattacks may act as a restraint on the market.
The high initial investment as well as deployment cost is one of the main restraints in the Optical Transport Network (OTN) market. OTN infrastructure involves major capital expenditure on optical fibers, advanced switching technologies, and high-capacity routers. Moreover, high-speed transmission, especially for long-distance networks, demands specialized hardware and software that comes with a sizable expense. While excellent from a spec perspective, these costs are prohibitively high for smaller enterprises or budget-constrained regions, leading to slow adoption and upgrades of OTN systems.
In addition, the installation process is labor-intensive and time-consuming – requiring skilled technicians and engineers to set up and maintain it properly. This increases the operational cost in due course and that might discourage organizations from implementing OTN as there are other solutions to networks with comparatively lower capital required upfront. Therefore, these high costs can impede market penetration and expansion.
Segment analysis
By Technology
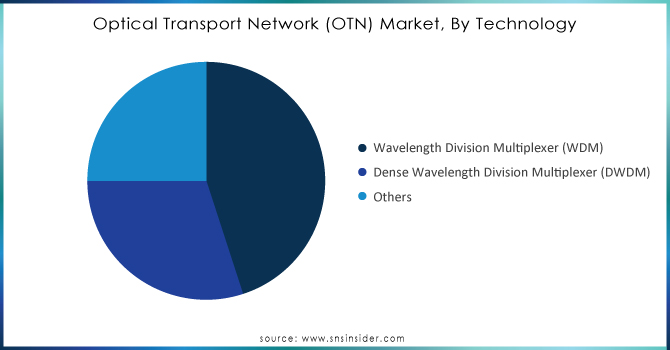
In 2023, the optical transport network (OTN) market was dominated by the wavelength division multiplexer (WDM) segment, which accounted for a significant share of 47% in terms of revenue. WDM (Wavelength Division Multiplexing) technology allows a single optical fiber to carry multiple signals simultaneously, each using different wavelengths of light, greatly increasing the capacity of optical networks. This is shaping up to be vital technology for scaling network infrastructure as data demands driven by cloud services, video streaming, and 5G expand. Wavelength division multiplexer technology is the focus of intensive governmental and telecom provider investment for expanded network capabilities. As an example, in 2023 European Union started its "Horizon Europe" project which funded the deployment of WDM-based optical networks with the support of 5G network rollout. Moreover, the Chinese Ministry of Industry and Information Technology (MIIT) stated that in 2023 WDM technology currently constitutes more than 65% of optical networks newly built in cities. This inexpensive approach is crucial as WDM can increase bandwidth capacity without the need to install more fiber that network operators have been using for a long time thus becoming a leader in OTN technology.
Need Any Customization Research On Optical Transport Network (OTN) Market - Inquiry Now
By Service
The network design segment is expected to hold the major share of the Optical Transport Network (OTN) market by service during the forecast period. Network design services are very important to the optimization of OTN layouts, capacities, and capabilities that enable maximum efficiency with minimum operational costs. As digital services like cloud computing and IoT continue to gain traction, enterprises, and governments require OTN solutions that cater to their specific bandwidth and performance requirements. According to a 2023 report by the U.S. Department of Commerce, 74% of all new IT infrastructure projects incorporated advanced network design services aimed at future-proofing digital infrastructure. In India, investment in network design services for optical networks was driven by a desire among telecom providers to meet rising data demand from the fast-growing base of Internet users in the country, states a report published recently by the Telecom Regulatory Authority of India (TRAI). As modern networks grow in complexity and require improvements to work with legacy systems seamlessly, the need for network design services is proving critical to the ongoing success of optical transport networks, contributing to demand for this segment.
By End User
The Optical Transport Network (OTN) market was led by the IT/Telecom segment in terms of revenue share and is anticipated to register a significant CAGR during the forecast period. The OTN market is primarily driven by the exponential increase in internet traffic, 5G network roll-out, and cloud demands, with the IT/Telecom sector being a continuing leading segment. In 2023, ITU data indicates that 55% of global OTN investments were made by the IT/Telecom sector, as telecom operators progressively scale their network infrastructures supported to meet the increasing demand for expanding data transmission.
On the other hand, the healthcare sector is witnessing the fastest growth in OTN adoption, with a significant CAGR over the forecast period from 2024 to 2032. Increased adoption of OTNs for telemedicine, electronic health records (EHRs), and remote diagnostics has been aided by governmental initiatives to digitize the healthcare systems, including the U.S. HITECH Act and A decade-long EU eHealth Action Plan. This, coupled with the ever-growing demand for facilitated high-speed data transfer in healthcare environments is propelling OTN adoption in this sector.
Regional Analysis
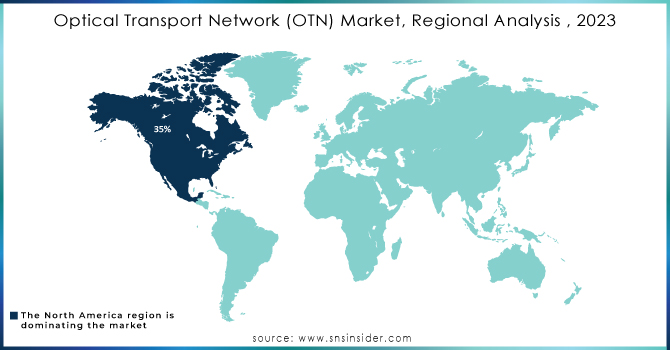
North America was the leading region in 2023 with a share of around 35% in the global Optical Transport Network (OTN) market. The investments in digital infrastructure by private companies and the government enable the dominance of this region. As an example, the U.S. government spent more than USD 45 billion to expand broadband infrastructure through the Infrastructure Investment and Jobs Act (IIJA) in 2023 like building an optical network for better connectivity progress. Moreover, telecom operators in North America are getting more aggressive with their 5G deployment announcement schedules (e.g., Verizon and AT&T) that demand advanced optical networking solutions.
On the other hand, Asia-Pacific is expected to be the fastest-growing region in terms of CAGR over the forecast period, owing to the increasing urbanization coupled with smart city trends and government initiatives toward digital economies. In 2023, CAICT reported that China’s OTN market grew by 28%, fueled by the country's aggressive 5G and fiber optic deployment programs. Other countries, including India and Japan, are also making significant investments in optical networks, contributing to the region’s rapid growth.
Recent Developments
OTN solution for 5G transport networks launched by Huawei Technologies in September 2023 that is capable of providing up to a 30% increase in capacity and a 25 % reduction in latency. Such change will enhance Huawei's profitability in the OTN market as telecom carriers are building their 5G networks.
In January 2024, Nokia secured a contract with the Government of India to deploy WDM-based OTNs across major urban centers as part of India’s “Digital India” initiative. The project seeks to improve and support the digital infrastructure of the country in response to our growing appetite for internet traffic.
Key Players
Key Service Providers/Manufacturers
Cisco Systems, Inc. (NCS 5500 Series, ASR 9000)
Nokia Corporation (1830 Photonic Service Switch, Wavence)
Huawei Technologies Co., Ltd. (OptiXtrans E9600, OptiXtrans D8000)
Ciena Corporation (360° Network Management, Waveserver)
Juniper Networks, Inc. (PTX Series, MX Series)
ZTE Corporation (ZXCTN 6000, ZXCTN 9000)
ADVA Optical Networking SE (FSP 3000, FSP 150)
Infinera Corporation (XTM Series, DTN Series)
Mitsubishi Electric Corporation (ML-7000 Series, MELCO)
Fujitsu Limited (FLASHWAVE 9500, 100G Optical Transport Platform)
Key Users of OTN Services / Products:
AT&T Inc.
Verizon Communications Inc.
China Mobile Ltd.
Deutsche Telekom AG
NTT Communications Corporation
Vodafone Group Plc
T-Mobile US, Inc.
BT Group plc
Comcast Corporation
Telefónica S.A.
Report Attributes | Details |
---|---|
Market Size in 2023 | USD 23.3 Billion |
Market Size by 2032 | USD 52.4 Billion |
CAGR | CAGR of 9.46% From 2024 to 2032 |
Base Year | 2023 |
Forecast Period | 2024-2032 |
Historical Data | 2020-2022 |
Report Scope & Coverage | Market Size, Segments Analysis, Competitive Landscape, Regional Analysis, DROC & SWOT Analysis, Forecast Outlook |
Key Segments | • By Technology (Wavelength Division Multiplexer (WDM), Dense Wavelength Division Multiplexer (DWDM), Others) • By Service (Network Design, Network Support, Others) • By Component (Optical Switch, Optical Platform, Others) • By End-user (IT/Telecom, Healthcare, Retail, Government, Others) |
Regional Analysis/Coverage | North America (US, Canada, Mexico), Europe (Eastern Europe [Poland, Romania, Hungary, Turkey, Rest of Eastern Europe] Western Europe] Germany, France, UK, Italy, Spain, Netherlands, Switzerland, Austria, Rest of Western Europe]), Asia Pacific (China, India, Japan, South Korea, Vietnam, Singapore, Australia, Rest of Asia Pacific), Middle East & Africa (Middle East [UAE, Egypt, Saudi Arabia, Qatar, Rest of Middle East], Africa [Nigeria, South Africa, Rest of Africa], Latin America (Brazil, Argentina, Colombia, Rest of Latin America) |
Company Profiles | Cisco Systems, Inc., Nokia Corporation, Huawei Technologies Co., Ltd., Ciena Corporation, Juniper Networks, Inc., ZTE Corporation, ADVA Optical Networking SE, Infinera Corporation, Mitsubishi Electric Corporation, Fujitsu Limited. |
Key Drivers | • The exponential growth in data traffic driven by cloud computing, streaming services, and mobile data usage is pushing demand for OTN systems to provide high-speed and efficient data transmission. • The global deployment of 5G networks is accelerating the need for robust and scalable OTN infrastructure to handle the increased bandwidth requirements and low-latency communication. |
RESTRAINTS | • The cost of setting up OTN infrastructure, especially for small and medium-sized enterprises, can be prohibitive, slowing down adoption in certain markets. • The complexity involved in managing and maintaining optical transport networks, especially for multi-vendor environments, can be a significant barrier for organizations looking to upgrade their networks. |
Ans. The projected market size for the Optical Transport Network (OTN) Market is USD 52.4 billion by 2032.
Ans: The North American region dominated the Optical Transport Network (OTN) Market in 2023.
Ans. The CAGR of the Optical Transport Network (OTN) Market is 9.46 % During the forecast period of 2024-2032.
And: The wavelength division multiplexer (WDM) technology segment dominated the Optical Transport Network (OTN) Market in 2023.
Ans: The key players in the Optical Transport Network (OTN) market are Cisco Systems, Inc., Nokia Corporation, Huawei Technologies Co., Ltd., Ciena Corporation, Juniper Networks, Inc., ZTE Corporation, ADVA Optical Networking SE, Infinera Corporation, Mitsubishi Electric Corporation, Fujitsu Limited and others
Table of Contents:
1. Introduction
1.1 Market Definition
1.2 Scope (Inclusion and Exclusions)
1.3 Research Assumptions
2. Executive Summary
2.1 Market Overview
2.2 Regional Synopsis
2.3 Competitive Summary
3. Research Methodology
3.1 Top-Down Approach
3.2 Bottom-up Approach
3.3. Data Validation
3.4 Primary Interviews
4. Market Dynamics Impact Analysis
4.1 Market Driving Factors Analysis
4.1.1 Drivers
4.1.2 Restraints
4.1.3 Opportunities
4.1.4 Challenges
4.2 PESTLE Analysis
4.3 Porter’s Five Forces Model
5. Statistical Insights and Trends Reporting
5.1 Adoption Rates of Emerging Technologies
5.2 Network Infrastructure Expansion, by Region
5.3 Cybersecurity Incidents, by Region (2020-2023)
5.4 Cloud Services Usage, by Region
6. Competitive Landscape
6.1 List of Major Companies, By Region
6.2 Market Share Analysis, By Region
6.3 Type Benchmarking
6.3.1 Type specifications and features
6.3.2 Pricing
6.4 Strategic Initiatives
6.4.1 Marketing and promotional activities
6.4.2 Distribution and supply chain strategies
6.4.3 Expansion plans and new Age Cohort launches
6.4.4 Strategic partnerships and collaborations
6.5 Technological Advancements
6.6 Market Positioning and Branding
7. Optical Transport Network (OTN) Market Segmentation, By Technology
7.1 Chapter Overview
7.2 Wavelength Division Multiplexer (WDM)
7.2.1 Wavelength Division Multiplexer (WDM) Market Trends Analysis (2020-2032)
7.2.2 Wavelength Division Multiplexer (WDM) Market Size Estimates and Forecasts to 2032 (USD Billion)
7.3 Dense Wavelength Division Multiplexer (DWDM)
7.3.1 Dense Wavelength Division Multiplexer (DWDM) Market Trends Analysis (2020-2032)
7.3.2 Dense Wavelength Division Multiplexer (DWDM) Market Size Estimates and Forecasts to 2032 (USD Billion)
7.4 Others
7.4.1 Others Market Trends Analysis (2020-2032)
7.4.2 Others Market Size Estimates and Forecasts to 2032 (USD Billion)
8. Optical Transport Network (OTN) Market Segmentation, By Service
8.1 Chapter Overview
8.2 Network Design
8.2.1 Network Design Market Trends Analysis (2020-2032)
8.2.2 Network Design Market Size Estimates and Forecasts to 2032 (USD Billion)
8.3 Network Support
8.3.1 Network Support Market Trends Analysis (2020-2032)
8.3.2 Network Support Market Size Estimates and Forecasts to 2032 (USD Billion)
8.4 Others
8.4.1 Others Market Trends Analysis (2020-2032)
8.4.2 Others Market Size Estimates and Forecasts to 2032 (USD Billion)
9. Optical Transport Network (OTN) Market Segmentation, By Component
9.1 Chapter Overview
9.2 Optical Switch
9.2.1 Optical Switch Market Trends Analysis (2020-2032)
9.2.2 Optical Switch Market Size Estimates and Forecasts to 2032 (USD Billion)
9.3 Optical Platform
9.3.1 Optical Platform Market Trends Analysis (2020-2032)
9.3.2 Optical Platform Market Size Estimates and Forecasts to 2032 (USD Billion)
9.4 Others
9.4.1 Others Market Trends Analysis (2020-2032)
9.4.2 Others Market Size Estimates and Forecasts to 2032 (USD Billion)
10. Optical Transport Network (OTN) Market Segmentation, By End-user
10.1 Chapter Overview
10.2 IT/Telecom
10.2.1 IT/Telecom Market Trends Analysis (2020-2032)
10.2.2 IT/Telecom Market Size Estimates and Forecasts to 2032 (USD Billion)
10.3 Retail
10.3.1 Retail Market Trends Analysis (2020-2032)
10.3.2 Retail Market Size Estimates and Forecasts to 2032 (USD Billion)
10.4 Healthcare
10.4.1 Healthcare Market Trends Analysis (2020-2032)
10.4.2 Healthcare Market Size Estimates and Forecasts to 2032 (USD Billion)
10.5 Government
10.5.1 Government Market Trends Analysis (2020-2032)
10.5.2 Government Market Size Estimates and Forecasts to 2032 (USD Billion)
10.6 Others
10.6.1 Others Market Trends Analysis (2020-2032)
10.6.2 Others Market Size Estimates and Forecasts to 2032 (USD Billion)
11. Regional Analysis
11.1 Chapter Overview
11.2 North America
11.2.1 Trends Analysis
11.2.2 North America Optical Transport Network (OTN) Market Estimates and Forecasts, by Country (2020-2032) (USD Billion)
11.2.3 North America Optical Transport Network (OTN) Market Estimates and Forecasts, By Technology (2020-2032) (USD Billion)
11.2.4 North America Optical Transport Network (OTN) Market Estimates and Forecasts, By Service (2020-2032) (USD Billion)
11.2.5 North America Optical Transport Network (OTN) Market Estimates and Forecasts, By Component (2020-2032) (USD Billion)
11.2.6 North America Optical Transport Network (OTN) Market Estimates and Forecasts, By End-user (2020-2032) (USD Billion)
11.2.7 USA
11.2.7.1 USA Optical Transport Network (OTN) Market Estimates and Forecasts, By Technology (2020-2032) (USD Billion)
11.2.7.2 USA Optical Transport Network (OTN) Market Estimates and Forecasts, By Service (2020-2032) (USD Billion)
11.2.7.3 USA Optical Transport Network (OTN) Market Estimates and Forecasts, By Component (2020-2032) (USD Billion)
11.2.7.4 USA Optical Transport Network (OTN) Market Estimates and Forecasts, By End-user (2020-2032) (USD Billion)
11.2.8 Canada
11.2.8.1 Canada Optical Transport Network (OTN) Market Estimates and Forecasts, By Technology (2020-2032) (USD Billion)
11.2.8.2 Canada Optical Transport Network (OTN) Market Estimates and Forecasts, By Service (2020-2032) (USD Billion)
11.2.8.3 Canada Optical Transport Network (OTN) Market Estimates and Forecasts, By Component (2020-2032) (USD Billion)
11.2.8.4 Canada Optical Transport Network (OTN) Market Estimates and Forecasts, By End-user (2020-2032) (USD Billion)
11.2.9 Mexico
11.2.9.1 Mexico Optical Transport Network (OTN) Market Estimates and Forecasts, By Technology (2020-2032) (USD Billion)
11.2.9.2 Mexico Optical Transport Network (OTN) Market Estimates and Forecasts, By Service (2020-2032) (USD Billion)
11.2.9.3 Mexico Optical Transport Network (OTN) Market Estimates and Forecasts, By Component (2020-2032) (USD Billion)
11.2.9.4 Mexico Optical Transport Network (OTN) Market Estimates and Forecasts, By End-user (2020-2032) (USD Billion)
11.3 Europe
11.3.1 Eastern Europe
11.3.1.1 Trends Analysis
11.3.1.2 Eastern Europe Optical Transport Network (OTN) Market Estimates and Forecasts, by Country (2020-2032) (USD Billion)
11.3.1.3 Eastern Europe Optical Transport Network (OTN) Market Estimates and Forecasts, By Technology (2020-2032) (USD Billion)
11.3.1.4 Eastern Europe Optical Transport Network (OTN) Market Estimates and Forecasts, By Service (2020-2032) (USD Billion)
11.3.1.5 Eastern Europe Optical Transport Network (OTN) Market Estimates and Forecasts, By Component (2020-2032) (USD Billion)
11.3.1.6 Eastern Europe Optical Transport Network (OTN) Market Estimates and Forecasts, By End-user (2020-2032) (USD Billion)
11.3.1.7 Poland
11.3.1.7.1 Poland Optical Transport Network (OTN) Market Estimates and Forecasts, By Technology (2020-2032) (USD Billion)
11.3.1.7.2 Poland Optical Transport Network (OTN) Market Estimates and Forecasts, By Service (2020-2032) (USD Billion)
11.3.1.7.3 Poland Optical Transport Network (OTN) Market Estimates and Forecasts, By Component (2020-2032) (USD Billion)
11.3.1.7.4 Poland Optical Transport Network (OTN) Market Estimates and Forecasts, By End-user (2020-2032) (USD Billion)
11.3.1.8 Romania
11.3.1.8.1 Romania Optical Transport Network (OTN) Market Estimates and Forecasts, By Technology (2020-2032) (USD Billion)
11.3.1.8.2 Romania Optical Transport Network (OTN) Market Estimates and Forecasts, By Service (2020-2032) (USD Billion)
11.3.1.8.3 Romania Optical Transport Network (OTN) Market Estimates and Forecasts, By Component (2020-2032) (USD Billion)
11.3.1.8.4 Romania Optical Transport Network (OTN) Market Estimates and Forecasts, By End-user (2020-2032) (USD Billion)
11.3.1.9 Hungary
11.3.1.9.1 Hungary Optical Transport Network (OTN) Market Estimates and Forecasts, By Technology (2020-2032) (USD Billion)
11.3.1.9.2 Hungary Optical Transport Network (OTN) Market Estimates and Forecasts, By Service (2020-2032) (USD Billion)
11.3.1.9.3 Hungary Optical Transport Network (OTN) Market Estimates and Forecasts, By Component (2020-2032) (USD Billion)
11.3.1.9.4 Hungary Optical Transport Network (OTN) Market Estimates and Forecasts, By End-user (2020-2032) (USD Billion)
11.3.1.10 Turkey
11.3.1.10.1 Turkey Optical Transport Network (OTN) Market Estimates and Forecasts, By Technology (2020-2032) (USD Billion)
11.3.1.10.2 Turkey Optical Transport Network (OTN) Market Estimates and Forecasts, By Service (2020-2032) (USD Billion)
11.3.1.10.3 Turkey Optical Transport Network (OTN) Market Estimates and Forecasts, By Component (2020-2032) (USD Billion)
11.3.1.10.4 Turkey Optical Transport Network (OTN) Market Estimates and Forecasts, By End-user (2020-2032) (USD Billion)
11.3.1.11 Rest of Eastern Europe
11.3.1.11.1 Rest of Eastern Europe Optical Transport Network (OTN) Market Estimates and Forecasts, By Technology (2020-2032) (USD Billion)
11.3.1.11.2 Rest of Eastern Europe Optical Transport Network (OTN) Market Estimates and Forecasts, By Service (2020-2032) (USD Billion)
11.3.1.11.3 Rest of Eastern Europe Optical Transport Network (OTN) Market Estimates and Forecasts, By Component (2020-2032) (USD Billion)
11.3.1.11.4 Rest of Eastern Europe Optical Transport Network (OTN) Market Estimates and Forecasts, By End-user (2020-2032) (USD Billion)
11.3.2 Western Europe
11.3.2.1 Trends Analysis
11.3.2.2 Western Europe Optical Transport Network (OTN) Market Estimates and Forecasts, by Country (2020-2032) (USD Billion)
11.3.2.3 Western Europe Optical Transport Network (OTN) Market Estimates and Forecasts, By Technology (2020-2032) (USD Billion)
11.3.2.4 Western Europe Optical Transport Network (OTN) Market Estimates and Forecasts, By Service (2020-2032) (USD Billion)
11.3.2.5 Western Europe Optical Transport Network (OTN) Market Estimates and Forecasts, By Component (2020-2032) (USD Billion)
11.3.2.6 Western Europe Optical Transport Network (OTN) Market Estimates and Forecasts, By End-user (2020-2032) (USD Billion)
11.3.2.7 Germany
11.3.2.7.1 Germany Optical Transport Network (OTN) Market Estimates and Forecasts, By Technology (2020-2032) (USD Billion)
11.3.2.7.2 Germany Optical Transport Network (OTN) Market Estimates and Forecasts, By Service (2020-2032) (USD Billion)
11.3.2.7.3 Germany Optical Transport Network (OTN) Market Estimates and Forecasts, By Component (2020-2032) (USD Billion)
11.3.2.7.4 Germany Optical Transport Network (OTN) Market Estimates and Forecasts, By End-user (2020-2032) (USD Billion)
11.3.2.8 France
11.3.2.8.1 France Optical Transport Network (OTN) Market Estimates and Forecasts, By Technology (2020-2032) (USD Billion)
11.3.2.8.2 France Optical Transport Network (OTN) Market Estimates and Forecasts, By Service (2020-2032) (USD Billion)
11.3.2.8.3 France Optical Transport Network (OTN) Market Estimates and Forecasts, By Component (2020-2032) (USD Billion)
11.3.2.8.4 France Optical Transport Network (OTN) Market Estimates and Forecasts, By End-user (2020-2032) (USD Billion)
11.3.2.9 UK
11.3.2.9.1 UK Optical Transport Network (OTN) Market Estimates and Forecasts, By Technology (2020-2032) (USD Billion)
11.3.2.9.2 UK Optical Transport Network (OTN) Market Estimates and Forecasts, By Service (2020-2032) (USD Billion)
11.3.2.9.3 UK Optical Transport Network (OTN) Market Estimates and Forecasts, By Component (2020-2032) (USD Billion)
11.3.2.9.4 UK Optical Transport Network (OTN) Market Estimates and Forecasts, By End-user (2020-2032) (USD Billion)
11.3.2.10 Italy
11.3.2.10.1 Italy Optical Transport Network (OTN) Market Estimates and Forecasts, By Technology (2020-2032) (USD Billion)
11.3.2.10.2 Italy Optical Transport Network (OTN) Market Estimates and Forecasts, By Service (2020-2032) (USD Billion)
11.3.2.10.3 Italy Optical Transport Network (OTN) Market Estimates and Forecasts, By Component (2020-2032) (USD Billion)
11.3.2.10.4 Italy Optical Transport Network (OTN) Market Estimates and Forecasts, By End-user (2020-2032) (USD Billion)
11.3.2.11 Spain
11.3.2.11.1 Spain Optical Transport Network (OTN) Market Estimates and Forecasts, By Technology (2020-2032) (USD Billion)
11.3.2.11.2 Spain Optical Transport Network (OTN) Market Estimates and Forecasts, By Service (2020-2032) (USD Billion)
11.3.2.11.3 Spain Optical Transport Network (OTN) Market Estimates and Forecasts, By Component (2020-2032) (USD Billion)
11.3.2.11.4 Spain Optical Transport Network (OTN) Market Estimates and Forecasts, By End-user (2020-2032) (USD Billion)
11.3.2.12 Netherlands
11.3.2.12.1 Netherlands Optical Transport Network (OTN) Market Estimates and Forecasts, By Technology (2020-2032) (USD Billion)
11.3.2.12.2 Netherlands Optical Transport Network (OTN) Market Estimates and Forecasts, By Service (2020-2032) (USD Billion)
11.3.2.12.3 Netherlands Optical Transport Network (OTN) Market Estimates and Forecasts, By Component (2020-2032) (USD Billion)
11.3.2.12.4 Netherlands Optical Transport Network (OTN) Market Estimates and Forecasts, By End-user (2020-2032) (USD Billion)
11.3.2.13 Switzerland
11.3.2.13.1 Switzerland Optical Transport Network (OTN) Market Estimates and Forecasts, By Technology (2020-2032) (USD Billion)
11.3.2.13.2 Switzerland Optical Transport Network (OTN) Market Estimates and Forecasts, By Service (2020-2032) (USD Billion)
11.3.2.13.3 Switzerland Optical Transport Network (OTN) Market Estimates and Forecasts, By Component (2020-2032) (USD Billion)
11.3.2.13.4 Switzerland Optical Transport Network (OTN) Market Estimates and Forecasts, By End-user (2020-2032) (USD Billion)
11.3.2.14 Austria
11.3.2.14.1 Austria Optical Transport Network (OTN) Market Estimates and Forecasts, By Technology (2020-2032) (USD Billion)
11.3.2.14.2 Austria Optical Transport Network (OTN) Market Estimates and Forecasts, By Service (2020-2032) (USD Billion)
11.3.2.14.3 Austria Optical Transport Network (OTN) Market Estimates and Forecasts, By Component (2020-2032) (USD Billion)
11.3.2.14.4 Austria Optical Transport Network (OTN) Market Estimates and Forecasts, By End-user (2020-2032) (USD Billion)
11.3.2.15 Rest of Western Europe
11.3.2.15.1 Rest of Western Europe Optical Transport Network (OTN) Market Estimates and Forecasts, By Technology (2020-2032) (USD Billion)
11.3.2.15.2 Rest of Western Europe Optical Transport Network (OTN) Market Estimates and Forecasts, By Service (2020-2032) (USD Billion)
11.3.2.15.3 Rest of Western Europe Optical Transport Network (OTN) Market Estimates and Forecasts, By Component (2020-2032) (USD Billion)
11.3.2.15.4 Rest of Western Europe Optical Transport Network (OTN) Market Estimates and Forecasts, By End-user (2020-2032) (USD Billion)
11.4 Asia Pacific
11.4.1 Trends Analysis
11.4.2 Asia Pacific Optical Transport Network (OTN) Market Estimates and Forecasts, by Country (2020-2032) (USD Billion)
11.4.3 Asia Pacific Optical Transport Network (OTN) Market Estimates and Forecasts, By Technology (2020-2032) (USD Billion)
11.4.4 Asia Pacific Optical Transport Network (OTN) Market Estimates and Forecasts, By Service (2020-2032) (USD Billion)
11.4.5 Asia Pacific Optical Transport Network (OTN) Market Estimates and Forecasts, By Component (2020-2032) (USD Billion)
11.4.6 Asia Pacific Optical Transport Network (OTN) Market Estimates and Forecasts, By End-user (2020-2032) (USD Billion)
11.4.7 China
11.4.7.1 China Optical Transport Network (OTN) Market Estimates and Forecasts, By Technology (2020-2032) (USD Billion)
11.4.7.2 China Optical Transport Network (OTN) Market Estimates and Forecasts, By Service (2020-2032) (USD Billion)
11.4.7.3 China Optical Transport Network (OTN) Market Estimates and Forecasts, By Component (2020-2032) (USD Billion)
11.4.7.4 China Optical Transport Network (OTN) Market Estimates and Forecasts, By End-user (2020-2032) (USD Billion)
11.4.8 India
11.4.8.1 India Optical Transport Network (OTN) Market Estimates and Forecasts, By Technology (2020-2032) (USD Billion)
11.4.8.2 India Optical Transport Network (OTN) Market Estimates and Forecasts, By Service (2020-2032) (USD Billion)
11.4.8.3 India Optical Transport Network (OTN) Market Estimates and Forecasts, By Component (2020-2032) (USD Billion)
11.4.8.4 India Optical Transport Network (OTN) Market Estimates and Forecasts, By End-user (2020-2032) (USD Billion)
11.4.9 Japan
11.4.9.1 Japan Optical Transport Network (OTN) Market Estimates and Forecasts, By Technology (2020-2032) (USD Billion)
11.4.9.2 Japan Optical Transport Network (OTN) Market Estimates and Forecasts, By Service (2020-2032) (USD Billion)
11.4.9.3 Japan Optical Transport Network (OTN) Market Estimates and Forecasts, By Component (2020-2032) (USD Billion)
11.4.9.4 Japan Optical Transport Network (OTN) Market Estimates and Forecasts, By End-user (2020-2032) (USD Billion)
11.4.10 South Korea
11.4.10.1 South Korea Optical Transport Network (OTN) Market Estimates and Forecasts, By Technology (2020-2032) (USD Billion)
11.4.10.2 South Korea Optical Transport Network (OTN) Market Estimates and Forecasts, By Service (2020-2032) (USD Billion)
11.4.10.3 South Korea Optical Transport Network (OTN) Market Estimates and Forecasts, By Component (2020-2032) (USD Billion)
11.4.10.4 South Korea Optical Transport Network (OTN) Market Estimates and Forecasts, By End-user (2020-2032) (USD Billion)
11.4.11 Vietnam
11.4.11.1 Vietnam Optical Transport Network (OTN) Market Estimates and Forecasts, By Technology (2020-2032) (USD Billion)
11.4.11.2 Vietnam Optical Transport Network (OTN) Market Estimates and Forecasts, By Service (2020-2032) (USD Billion)
11.4.11.3 Vietnam Optical Transport Network (OTN) Market Estimates and Forecasts, By Component (2020-2032) (USD Billion)
11.4.11.4 Vietnam Optical Transport Network (OTN) Market Estimates and Forecasts, By End-user (2020-2032) (USD Billion)
11.4.12 Singapore
11.4.12.1 Singapore Optical Transport Network (OTN) Market Estimates and Forecasts, By Technology (2020-2032) (USD Billion)
11.4.12.2 Singapore Optical Transport Network (OTN) Market Estimates and Forecasts, By Service (2020-2032) (USD Billion)
11.4.12.3 Singapore Optical Transport Network (OTN) Market Estimates and Forecasts, By Component (2020-2032) (USD Billion)
11.4.12.4 Singapore Optical Transport Network (OTN) Market Estimates and Forecasts, By End-user (2020-2032) (USD Billion)
11.4.13 Australia
11.4.13.1 Australia Optical Transport Network (OTN) Market Estimates and Forecasts, By Technology (2020-2032) (USD Billion)
11.4.13.2 Australia Optical Transport Network (OTN) Market Estimates and Forecasts, By Service (2020-2032) (USD Billion)
11.4.13.3 Australia Optical Transport Network (OTN) Market Estimates and Forecasts, By Component (2020-2032) (USD Billion)
11.4.13.4 Australia Optical Transport Network (OTN) Market Estimates and Forecasts, By End-user (2020-2032) (USD Billion)
11.4.14 Rest of Asia Pacific
11.4.14.1 Rest of Asia Pacific Optical Transport Network (OTN) Market Estimates and Forecasts, By Technology (2020-2032) (USD Billion)
11.4.14.2 Rest of Asia Pacific Optical Transport Network (OTN) Market Estimates and Forecasts, By Service (2020-2032) (USD Billion)
11.4.14.3 Rest of Asia Pacific Optical Transport Network (OTN) Market Estimates and Forecasts, By Component (2020-2032) (USD Billion)
11.4.14.4 Rest of Asia Pacific Optical Transport Network (OTN) Market Estimates and Forecasts, By End-user (2020-2032) (USD Billion)
11.5 Middle East and Africa
11.5.1 Middle East
11.5.1.1 Trends Analysis
11.5.1.2 Middle East Optical Transport Network (OTN) Market Estimates and Forecasts, by Country (2020-2032) (USD Billion)
11.5.1.3 Middle East Optical Transport Network (OTN) Market Estimates and Forecasts, By Technology (2020-2032) (USD Billion)
11.5.1.4 Middle East Optical Transport Network (OTN) Market Estimates and Forecasts, By Service (2020-2032) (USD Billion)
11.5.1.5 Middle East Optical Transport Network (OTN) Market Estimates and Forecasts, By Component (2020-2032) (USD Billion)
11.5.1.6 Middle East Optical Transport Network (OTN) Market Estimates and Forecasts, By End-user (2020-2032) (USD Billion)
11.5.1.7 UAE
11.5.1.7.1 UAE Optical Transport Network (OTN) Market Estimates and Forecasts, By Technology (2020-2032) (USD Billion)
11.5.1.7.2 UAE Optical Transport Network (OTN) Market Estimates and Forecasts, By Service (2020-2032) (USD Billion)
11.5.1.7.3 UAE Optical Transport Network (OTN) Market Estimates and Forecasts, By Component (2020-2032) (USD Billion)
11.5.1.7.4 UAE Optical Transport Network (OTN) Market Estimates and Forecasts, By End-user (2020-2032) (USD Billion)
11.5.1.8 Egypt
11.5.1.8.1 Egypt Optical Transport Network (OTN) Market Estimates and Forecasts, By Technology (2020-2032) (USD Billion)
11.5.1.8.2 Egypt Optical Transport Network (OTN) Market Estimates and Forecasts, By Service (2020-2032) (USD Billion)
11.5.1.8.3 Egypt Optical Transport Network (OTN) Market Estimates and Forecasts, By Component (2020-2032) (USD Billion)
11.5.1.8.4 Egypt Optical Transport Network (OTN) Market Estimates and Forecasts, By End-user (2020-2032) (USD Billion)
11.5.1.9 Saudi Arabia
11.5.1.9.1 Saudi Arabia Optical Transport Network (OTN) Market Estimates and Forecasts, By Technology (2020-2032) (USD Billion)
11.5.1.9.2 Saudi Arabia Optical Transport Network (OTN) Market Estimates and Forecasts, By Service (2020-2032) (USD Billion)
11.5.1.9.3 Saudi Arabia Optical Transport Network (OTN) Market Estimates and Forecasts, By Component (2020-2032) (USD Billion)
11.5.1.9.4 Saudi Arabia Optical Transport Network (OTN) Market Estimates and Forecasts, By End-user (2020-2032) (USD Billion)
11.5.1.10 Qatar
11.5.1.10.1 Qatar Optical Transport Network (OTN) Market Estimates and Forecasts, By Technology (2020-2032) (USD Billion)
11.5.1.10.2 Qatar Optical Transport Network (OTN) Market Estimates and Forecasts, By Service (2020-2032) (USD Billion)
11.5.1.10.3 Qatar Optical Transport Network (OTN) Market Estimates and Forecasts, By Component (2020-2032) (USD Billion)
11.5.1.10.4 Qatar Optical Transport Network (OTN) Market Estimates and Forecasts, By End-user (2020-2032) (USD Billion)
11.5.1.11 Rest of Middle East
11.5.1.11.1 Rest of Middle East Optical Transport Network (OTN) Market Estimates and Forecasts, By Technology (2020-2032) (USD Billion)
11.5.1.11.2 Rest of Middle East Optical Transport Network (OTN) Market Estimates and Forecasts, By Service (2020-2032) (USD Billion)
11.5.1.11.3 Rest of Middle East Optical Transport Network (OTN) Market Estimates and Forecasts, By Component (2020-2032) (USD Billion)
11.5.1.11.4 Rest of Middle East Optical Transport Network (OTN) Market Estimates and Forecasts, By End-user (2020-2032) (USD Billion)
11.5.2 Africa
11.5.2.1 Trends Analysis
11.5.2.2 Africa Optical Transport Network (OTN) Market Estimates and Forecasts, by Country (2020-2032) (USD Billion)
11.5.2.3 Africa Optical Transport Network (OTN) Market Estimates and Forecasts, By Technology (2020-2032) (USD Billion)
11.5.2.4 Africa Optical Transport Network (OTN) Market Estimates and Forecasts, By Service (2020-2032) (USD Billion)
11.5.2.5 Africa Optical Transport Network (OTN) Market Estimates and Forecasts, By Component (2020-2032) (USD Billion)
11.5.2.6 Africa Optical Transport Network (OTN) Market Estimates and Forecasts, By End-user (2020-2032) (USD Billion)
11.5.2.7 South Africa
11.5.2.7.1 South Africa Optical Transport Network (OTN) Market Estimates and Forecasts, By Technology (2020-2032) (USD Billion)
11.5.2.7.2 South Africa Optical Transport Network (OTN) Market Estimates and Forecasts, By Service (2020-2032) (USD Billion)
11.5.2.7.3 South Africa Optical Transport Network (OTN) Market Estimates and Forecasts, By Component (2020-2032) (USD Billion)
11.5.2.7.4 South Africa Optical Transport Network (OTN) Market Estimates and Forecasts, By End-user (2020-2032) (USD Billion)
11.5.2.8 Nigeria
11.5.2.8.1 Nigeria Optical Transport Network (OTN) Market Estimates and Forecasts, By Technology (2020-2032) (USD Billion)
11.5.2.8.2 Nigeria Optical Transport Network (OTN) Market Estimates and Forecasts, By Service (2020-2032) (USD Billion)
11.5.2.8.3 Nigeria Optical Transport Network (OTN) Market Estimates and Forecasts, By Component (2020-2032) (USD Billion)
11.5.2.8.4 Nigeria Optical Transport Network (OTN) Market Estimates and Forecasts, By End-user (2020-2032) (USD Billion)
11.5.2.9 Rest of Africa
11.5.2.9.1 Rest of Africa Optical Transport Network (OTN) Market Estimates and Forecasts, By Technology (2020-2032) (USD Billion)
11.5.2.9.2 Rest of Africa Optical Transport Network (OTN) Market Estimates and Forecasts, By Service (2020-2032) (USD Billion)
11.5.2.9.3 Rest of Africa Optical Transport Network (OTN) Market Estimates and Forecasts, By Component (2020-2032) (USD Billion)
11.5.2.9.4 Rest of Africa Optical Transport Network (OTN) Market Estimates and Forecasts, By End-user (2020-2032) (USD Billion)
11.6 Latin America
11.6.1 Trends Analysis
11.6.2 Latin America Optical Transport Network (OTN) Market Estimates and Forecasts, by Country (2020-2032) (USD Billion)
11.6.3 Latin America Optical Transport Network (OTN) Market Estimates and Forecasts, By Technology (2020-2032) (USD Billion)
11.6.4 Latin America Optical Transport Network (OTN) Market Estimates and Forecasts, By Service (2020-2032) (USD Billion)
11.6.5 Latin America Optical Transport Network (OTN) Market Estimates and Forecasts, By Component (2020-2032) (USD Billion)
11.6.6 Latin America Optical Transport Network (OTN) Market Estimates and Forecasts, By End-user (2020-2032) (USD Billion)
11.6.7 Brazil
11.6.7.1 Brazil Optical Transport Network (OTN) Market Estimates and Forecasts, By Technology (2020-2032) (USD Billion)
11.6.7.2 Brazil Optical Transport Network (OTN) Market Estimates and Forecasts, By Service (2020-2032) (USD Billion)
11.6.7.3 Brazil Optical Transport Network (OTN) Market Estimates and Forecasts, By Component (2020-2032) (USD Billion)
11.6.7.4 Brazil Optical Transport Network (OTN) Market Estimates and Forecasts, By End-user (2020-2032) (USD Billion)
11.6.8 Argentina
11.6.8.1 Argentina Optical Transport Network (OTN) Market Estimates and Forecasts, By Technology (2020-2032) (USD Billion)
11.6.8.2 Argentina Optical Transport Network (OTN) Market Estimates and Forecasts, By Service (2020-2032) (USD Billion)
11.6.8.3 Argentina Optical Transport Network (OTN) Market Estimates and Forecasts, By Component (2020-2032) (USD Billion)
11.6.8.4 Argentina Optical Transport Network (OTN) Market Estimates and Forecasts, By End-user (2020-2032) (USD Billion)
11.6.9 Colombia
11.6.9.1 Colombia Optical Transport Network (OTN) Market Estimates and Forecasts, By Technology (2020-2032) (USD Billion)
11.6.9.2 Colombia Optical Transport Network (OTN) Market Estimates and Forecasts, By Service (2020-2032) (USD Billion)
11.6.9.3 Colombia Optical Transport Network (OTN) Market Estimates and Forecasts, By Component (2020-2032) (USD Billion)
11.6.9.4 Colombia Optical Transport Network (OTN) Market Estimates and Forecasts, By End-user (2020-2032) (USD Billion)
11.6.10 Rest of Latin America
11.6.10.1 Rest of Latin America Optical Transport Network (OTN) Market Estimates and Forecasts, By Technology (2020-2032) (USD Billion)
11.6.10.2 Rest of Latin America Optical Transport Network (OTN) Market Estimates and Forecasts, By Service (2020-2032) (USD Billion)
11.6.10.3 Rest of Latin America Optical Transport Network (OTN) Market Estimates and Forecasts, By Component (2020-2032) (USD Billion)
11.6.10.4 Rest of Latin America Optical Transport Network (OTN) Market Estimates and Forecasts, By End-user (2020-2032) (USD Billion)
12. Company Profiles
12.1 Cisco Systems, Inc.
12.1.1 Company Overview
12.1.2 Financial
12.1.3 Product / Services Offered
12.1.4 SWOT Analysis
12.2 Nokia Corporation
12.2.1 Company Overview
12.2.2 Financial
12.2.3 Product / Services Offered
12.2.4 SWOT Analysis
12.3 Huawei Technologies Co., Ltd.
12.3.1 Company Overview
12.3.2 Financial
12.3.3 Product / Services Offered
12.3.4 SWOT Analysis
12.4 Ciena Corporation
12.4.1 Company Overview
12.4.2 Financial
12.4.3 Product / Services Offered
12.4.4 SWOT Analysis
12.5 Juniper Networks, Inc.
12.5.1 Company Overview
12.5.2 Financial
12.5.3 Product / Services Offered
12.5.4 SWOT Analysis
12.6 ZTE Corporation
12.6.1 Company Overview
12.6.2 Financial
12.6.3 Product / Services Offered
12.6.4 SWOT Analysis
12.7 ADVA Optical Networking SE
12.7.1 Company Overview
12.7.2 Financial
12.7.3 Product / Services Offered
12.7.4 SWOT Analysis
12.8 Infinera Corporation
12.8.1 Company Overview
12.8.2 Financial
12.8.3 Product / Services Offered
12.8.4 SWOT Analysis
12.9 Mitsubishi Electric Corporation
12.9.1 Company Overview
12.9.2 Financial
12.9.3 Product / Services Offered
12.9.4 SWOT Analysis
12.10 Fujitsu Limited.
12.10.1 Company Overview
12.10.2 Financial
12.10.3 Product/ Services Offered
12.10.4 SWOT Analysis
13. Use Cases and Best Practices
14. Conclusion
An accurate research report requires proper strategizing as well as implementation. There are multiple factors involved in the completion of good and accurate research report and selecting the best methodology to compete the research is the toughest part. Since the research reports we provide play a crucial role in any company’s decision-making process, therefore we at SNS Insider always believe that we should choose the best method which gives us results closer to reality. This allows us to reach at a stage wherein we can provide our clients best and accurate investment to output ratio.
Each report that we prepare takes a timeframe of 350-400 business hours for production. Starting from the selection of titles through a couple of in-depth brain storming session to the final QC process before uploading our titles on our website we dedicate around 350 working hours. The titles are selected based on their current market cap and the foreseen CAGR and growth.
The 5 steps process:
Step 1: Secondary Research:
Secondary Research or Desk Research is as the name suggests is a research process wherein, we collect data through the readily available information. In this process we use various paid and unpaid databases which our team has access to and gather data through the same. This includes examining of listed companies’ annual reports, Journals, SEC filling etc. Apart from this our team has access to various associations across the globe across different industries. Lastly, we have exchange relationships with various university as well as individual libraries.
Step 2: Primary Research
When we talk about primary research, it is a type of study in which the researchers collect relevant data samples directly, rather than relying on previously collected data. This type of research is focused on gaining content specific facts that can be sued to solve specific problems. Since the collected data is fresh and first hand therefore it makes the study more accurate and genuine.
We at SNS Insider have divided Primary Research into 2 parts.
Part 1 wherein we interview the KOLs of major players as well as the upcoming ones across various geographic regions. This allows us to have their view over the market scenario and acts as an important tool to come closer to the accurate market numbers. As many as 45 paid and unpaid primary interviews are taken from both the demand and supply side of the industry to make sure we land at an accurate judgement and analysis of the market.
This step involves the triangulation of data wherein our team analyses the interview transcripts, online survey responses and observation of on filed participants. The below mentioned chart should give a better understanding of the part 1 of the primary interview.
Part 2: In this part of primary research the data collected via secondary research and the part 1 of the primary research is validated with the interviews from individual consultants and subject matter experts.
Consultants are those set of people who have at least 12 years of experience and expertise within the industry whereas Subject Matter Experts are those with at least 15 years of experience behind their back within the same space. The data with the help of two main processes i.e., FGDs (Focused Group Discussions) and IDs (Individual Discussions). This gives us a 3rd party nonbiased primary view of the market scenario making it a more dependable one while collation of the data pointers.
Step 3: Data Bank Validation
Once all the information is collected via primary and secondary sources, we run that information for data validation. At our intelligence centre our research heads track a lot of information related to the market which includes the quarterly reports, the daily stock prices, and other relevant information. Our data bank server gets updated every fortnight and that is how the information which we collected using our primary and secondary information is revalidated in real time.
Step 4: QA/QC Process
After all the data collection and validation our team does a final level of quality check and quality assurance to get rid of any unwanted or undesired mistakes. This might include but not limited to getting rid of the any typos, duplication of numbers or missing of any important information. The people involved in this process include technical content writers, research heads and graphics people. Once this process is completed the title gets uploader on our platform for our clients to read it.
Step 5: Final QC/QA Process:
This is the last process and comes when the client has ordered the study. In this process a final QA/QC is done before the study is emailed to the client. Since we believe in giving our clients a good experience of our research studies, therefore, to make sure that we do not lack at our end in any way humanly possible we do a final round of quality check and then dispatch the study to the client.
Key Segments:
By Technology
Wavelength Division Multiplexer (WDM)
Dense Wavelength Division Multiplexer (DWDM)
Others
By Service
Network Design
Network Support
Others
By Component
Optical Switch
Optical Platform
Others
By End-user
IT/Telecom
Healthcare
Retail
Government
Others
Request for Segment Customization as per your Business Requirement: Segment Customization Request
REGIONAL COVERAGE:
North America
US
Canada
Mexico
Europe
Eastern Europe
Poland
Romania
Hungary
Turkey
Rest of Eastern Europe
Western Europe
Germany
France
UK
Italy
Spain
Netherlands
Switzerland
Austria
Rest of Western Europe
Asia Pacific
China
India
Japan
South Korea
Vietnam
Singapore
Australia
Rest of Asia Pacific
Middle East & Africa
Middle East
UAE
Egypt
Saudi Arabia
Qatar
Rest of the Middle East
Africa
Nigeria
South Africa
Rest of Africa
Latin America
Brazil
Argentina
Colombia
Rest of Latin America
Request for Country Level Research Report: Country Level Customization Request
Available Customization
With the given market data, SNS Insider offers customization as per the company’s specific needs. The following customization options are available for the report:
Product Analysis
Criss-Cross segment analysis (e.g. Product X Application)
Product Matrix which gives a detailed comparison of product portfolio of each company
Geographic Analysis
Additional countries in any of the regions
Company Information
Detailed analysis and profiling of additional market players (Up to five)
Progressive Web Apps Market size was USD 1.4 Billion in 2023 and will reach to USD 13.3 Billion by 2032 and grow at a CAGR of 28.6% by 2024-2032.
The Capability Centers Market size is projected to reach USD 453.94 billion by 2032 and was valued at USD 128.55 billion in 2023. The estimated CAGR is 13.51% for 2024-2032.
The Workspace as a Service (WaaS) Market Size was valued at USD 8.4 Billion in 2023 and will reach USD 33.4 Billion by 2032 and grow at a CAGR of 16.6% by 2032
The Text Analytics Market size was recorded at USD 9.55 billion in 2023 and is expected to reach USD 41.2 billion in 2032, growing at a CAGR of 17.65% Over the Forecast Period of 2024-2032.
The DataOps Platforms Market size was USD 3.6 billion in 2023 and is expected to Reach USD 25.87 billion by 2032 and grow at a CAGR of 24.5% over the forecast period of 2024-2032.
The IoT MVNO Market size was USD 2.8 Billion in 2023 and is expected to Reach USD 12.80 Billion by 2032 and grow at a CAGR of 18.4% over the forecast period of 2024-2032.
Hi! Click one of our member below to chat on Phone