image

Optical Imaging Market Key Insights:

Optical Imaging Market,Revenue Analysis

Get More Information on Optical Imaging Market - Request Sample Report

The Optical Imaging Market Size was estimated at USD 1.99 billion in 2023 and is expected to reach USD 5.30 billion by 2032 with a growing CAGR of 11.52% during the forecast period of 2024-2032.
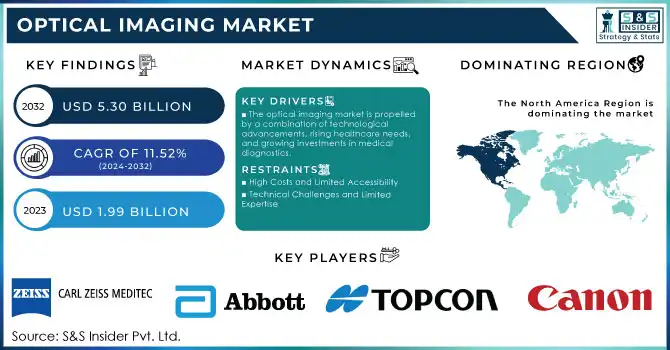
The global optical imaging market is experiencing transformative growth. Factors influencing this are technological innovations and the increasing need for accurate, non-invasive diagnostic tools. According to a study by Nature Communications, advancements in adaptive optics have enabled unprecedented imaging clarity through scattering media, promising breakthroughs in deep tissue visualization. The prevalence of chronic diseases such as cancer and neurodegenerative disorders, which require high-resolution diagnostics, is a key driver of this trend. It is estimated that over 19.3 million new cancer cases were diagnosed globally in 2020, according to the International Agency for Research on Cancer (IARC), highlighting the critical need for advanced imaging solutions.

Optical imaging technologies like optical coherence tomography (OCT) and near-infrared fluorescence (NIRF) imaging are witnessing rapid adoption due to their ability to provide real-time, high-resolution images at the cellular level. For instance, a study in the Survey of Ophthalmology highlighted the application of OCT in ophthalmology, improving early detection of retinal diseases, which affect over 146 million people worldwide. Similarly, NIRF imaging has shown significant promise in oncology for tumor margin detection during surgeries.

Recent advancements have further accelerated the market. A groundbreaking development published by researchers at the Hebrew University demonstrated a novel non-invasive imaging technique capable of imaging through scattering media, marking a substantial leap forward in diagnostics. Meanwhile, portable and compact imaging devices are emerging, improving accessibility in remote and underserved areas.

AI integration is another transformative factor. Studies such as one in Nature Biotechnology revealed that AI algorithms improve diagnostic accuracy by up to 30%, particularly in applications like automated OCT image analysis. These innovations, coupled with increasing healthcare investments and government initiatives to promote early diagnosis, are bolstering the market's trajectory.

The combination of advanced research, robust adoption across clinical applications, and rising global healthcare needs positions the optical imaging market as a cornerstone of modern diagnostics, with a transformative impact expected in the coming years.

Optical Imaging Market Dynamics

Drivers

  • The optical imaging market is propelled by a combination of technological advancements, rising healthcare needs, and growing investments in medical diagnostics.

A key driver is the increasing prevalence of chronic diseases such as cancer, cardiovascular disorders, and neurological conditions, which demand advanced diagnostic solutions for early detection and treatment planning. According to the World Health Organization (WHO), chronic diseases account for nearly 71% of global deaths annually, emphasizing the critical role of high-resolution imaging technologies in reducing this burden.

Technological breakthroughs are at the forefront of market growth. Innovations such as optical coherence tomography (OCT), adaptive optics, and near-infrared fluorescence (NIRF) imaging are expanding diagnostic capabilities across ophthalmology, oncology, and cardiology. For example, OCT is widely adopted in eye care, with studies showing its efficacy in detecting retinal disorders, while NIRF imaging is transforming surgical oncology by enabling real-time tumor visualization.

The integration of artificial intelligence (AI) into imaging systems is another significant driver, enhancing image interpretation and diagnostic accuracy. According to a study in Nature Biotechnology, AI algorithms have improved diagnostic precision by up to 30%, particularly in complex imaging scenarios.

Additionally, increasing investments in healthcare infrastructure and research, with initiatives to improve access to diagnostics in underserved regions, are fostering market expansion. Portable imaging devices and non-invasive imaging technologies are making advanced solutions accessible globally, driving their adoption in clinical and research settings. These factors collectively position optical imaging as a vital component of modern healthcare.

Restraints

  • High Costs and Limited Accessibility

The advanced technologies used in optical imaging systems, such as optical coherence tomography (OCT) and near-infrared fluorescence (NIRF) imaging, often involve substantial development and maintenance costs. This makes these solutions expensive for many healthcare providers, particularly in low-income and rural areas, limiting widespread adoption.

  • Technical Challenges and Limited Expertise

Optical imaging technologies require specialized knowledge for operation and interpretation. A shortage of trained professionals and the complexity of integrating these systems into existing healthcare workflows pose significant barriers to their adoption, especially in emerging markets.

Optical Imaging Market Segmentation Analysis

By Product

Imaging systems accounted for the largest share in 2023, dominating with approximately 45.0% of the market. This dominance is attributed to their extensive application across various fields, such as ophthalmology, neurology, and oncology. High demand for advanced imaging solutions like optical coherence tomography (OCT) and near-infrared fluorescence (NIRF) imaging systems drives this segment. Their capability to provide high-resolution, real-time imaging for early diagnosis and treatment planning has made them indispensable in both clinical and research settings.

The software segment is expected to witness the fastest growth, driven by the integration of artificial intelligence (AI) and machine learning (ML) technologies into imaging solutions. AI-enhanced software significantly improves diagnostic accuracy and automates image interpretation, making it a key enabler for precision medicine. This segment is anticipated to grow at a CAGR of over 12% during the forecast period.

By Application

Ophthalmology led the market in 2023, holding a 35.0% share. The widespread adoption of optical coherence tomography (OCT) for the early detection of retinal disorders, glaucoma, and age-related macular degeneration contributed significantly to this dominance. The aging population and rising prevalence of eye disorders further bolster the demand in this segment.

Oncology is projected to be the fastest-growing segment due to the rising incidence of cancer and the increasing need for precise imaging technologies for tumor detection and treatment planning. Near-infrared fluorescence (NIRF) imaging, used in real-time tumor visualization and margin assessment during surgeries, is driving this growth, with the segment expected to grow at a CAGR exceeding 14% in the coming years.

Optical Imaging Market Regional Overview

North America dominated the market, accounting for the largest share in 2023, driven by advanced healthcare infrastructure, increased healthcare spending, and strong research activities. The U.S. is home to major players such as Abbott, PerkinElmer, and Hamamatsu Photonics, who contribute significantly to the market through the development of cutting-edge imaging technologies. The growing prevalence of chronic diseases, along with a focus on early diagnostics, particularly in ophthalmology and oncology, fuels the demand for optical imaging solutions in this region.

Europe followed closely behind, with countries like Germany, the U.K., and France leading the market. The presence of prominent companies like Carl Zeiss Meditec and Heidelberg Engineering further strengthens Europe’s position. The region benefits from strong investments in healthcare research, particularly in the fields of dermatology, ophthalmology, and oncology. Additionally, European Union funding programs for medical technologies support market growth.

Asia-Pacific is the fastest-growing region, driven by increasing healthcare investments, rising disposable incomes, and the growing demand for advanced diagnostic tools. Countries such as Japan, China, and India are witnessing rapid adoption of optical imaging technologies, especially in ophthalmology and oncology. The rise of local manufacturers, like MOPTIM and Cylite, is contributing to regional market expansion. The region is expected to grow at a significant pace, with a focus on improving healthcare access in emerging markets.
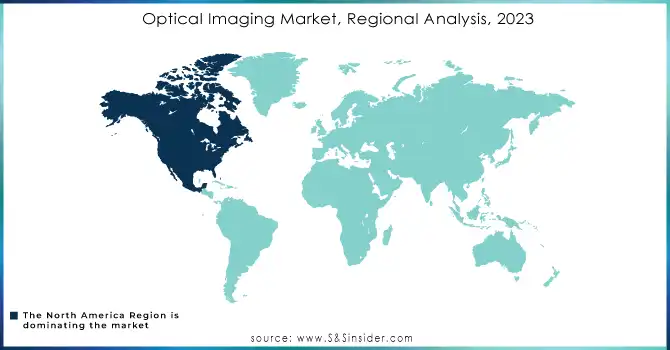
Optical-Imaging-Market-Regional-Analysis-2023

Need Any Customization Research On Optical-Imaging-Market - Inquiry Now

Key Players in Optical Imaging Market

  • Carl Zeiss Meditec: Optical coherence tomography systems, fundus cameras, slit lamps, surgical microscopes

  • Abbott: Advanced imaging systems

  • Topcon Corporation: OCT systems, fundus cameras, ophthalmic imaging software, slit lamps

  • Canon: OCT systems, fundus cameras

  • PerkinElmer: Imaging systems, microscopy solutions

  • Koninklijke Philips: Diagnostic imaging systems

  • Heidelberg Engineering: OCT systems, confocal scanning laser ophthalmoscopes

  • Leica Microsystems: Microscopes, imaging systems

  • Headwall Photonics: Hyperspectral imaging systems

  • Visionix: Ophthalmic diagnostic imaging systems

  • Optical Imaging: Non-invasive imaging solutions

  • Optos: Ultra-widefield retinal imaging devices

  • Wasatch Photonics: Spectroscopy and imaging systems

  • ArcScan: High-resolution OCT systems

  • DermaLumics: Optical coherence tomography devices

  • Cylite: 3D optical coherence tomography systems

  • MOPTIM: OCT systems

  • Michelson Diagnostics: Multibeam optical coherence tomography devices

  • Thorlabs: OCT systems, imaging components

  • Hamamatsu Photonics: Photodetectors, imaging modules

  • iTheraMedical: Optoacoustic imaging systems

  • Kibero: Multimodal imaging systems

  • Seno Medical: Optoacoustic breast imaging systems

  • Aspectus Imaging: Spectral imaging systems

  • Agfa-Gevaert: Digital imaging solutions

Recent Developments

In September 2024, ZEISS unveiled its innovative ZEISS KINEVO 900 S Robotic Visualization System, offering enhanced digital visualization and seamless robotic integration, marking a significant advancement in the neurosurgery market. This cutting-edge system is set to revolutionize surgical precision and patient outcomes.

In Jan 2024, Leica Microsystems introduced an enhanced version of its ARveo 8 digital visualization microscope, featuring advanced 3D AR fluorescence for improved brain tumor and vascular surgery. The new GLOW400 and GLOW800 AR fluorescence systems provide clearer visualization of anatomical structures and vascular flow, while the MyVeo all-in-one surgical headset offers greater mobility, comfort, and efficiency in the operating room.

In Nov 2023, Cleveland Clinic partnered with Canon Inc. to establish a comprehensive imaging research center in the Cleveland Innovation District. This collaboration aims to drive global advancements in medical imaging solutions, fostering innovation and technological progress in the field.

In Oct 2023, Abbott launched its groundbreaking Ultreon 1.0 Software in India, integrating optical coherence tomography (OCT) with Artificial Intelligence (AI) to enhance coronary imaging. The software offers a streamlined, user-friendly interface, providing step-by-step guidance for physicians and improving insights to optimize patient outcomes.

Optical Imaging Market Report Scope:

Report Attributes Details
Market Size in 2023 US$ 1.99 Billion 
Market Size by 2032 US$ 5.30 Billion 
CAGR CAGR of 11.52% From 2024 to 2032
Base Year 2023
Forecast Period 2024-2032
Historical Data 2020-2022
Report Scope & Coverage Market Size, Segments Analysis, Competitive  Landscape, Regional Analysis, DROC & SWOT Analysis, Forecast Outlook
Key Segments • By Product [Imaging Systems (Optical Imaging Systems, Spectral Imaging Systems), Illumination Systems, Lenses, Software]
• By Application (Ophthalmology, Dentistry, Dermatology, Cardiology, Neurology, Oncology, Biotechnology and Research, Other Applications)
• By Technique (Optical Coherence Tomography, Near Infrared Spectroscopy, Hyperspectral Imaging, Photoacoustic Tomography)
• By End User (Diagnostic Imaging Center, Hospitals and Clinics, Research Laboratories, Other End Users)
Regional Analysis/Coverage North America (US, Canada, Mexico), Europe (Eastern Europe [Poland, Romania, Hungary, Turkey, Rest of Eastern Europe] Western Europe [Germany, France, UK, Italy, Spain, Netherlands, Switzerland, Austria, Rest of Western Europe]), Asia Pacific (China, India, Japan, South Korea, Vietnam, Singapore, Australia, Rest of Asia Pacific), Middle East & Africa (Middle East [UAE, Egypt, Saudi Arabia, Qatar, Rest of Middle East], Africa [Nigeria, South Africa, Rest of Africa], Latin America (Brazil, Argentina, Colombia, Rest of Latin America)
Company Profiles Carl Zeiss Meditec, Abbott, Topcon Corporation, Canon, PerkinElmer, Koninklijke Philips, Heidelberg Engineering, Leica Microsystems, Headwall Photonics, Visionix, Optical Imaging, Optos, Wasatch Photonics, ArcScan, DermaLumics, Cylite, MOPTIM, Michelson Diagnostics, Thorlabs, Hamamatsu Photonics, iTheraMedical, Kibero, Seno Medical, Aspectus Imaging, Agfa-Gevaert.
Key Drivers • The optical imaging market is propelled by a combination of technological advancements, rising healthcare needs, and growing investments in medical diagnostics.
Restraints • High Costs and Limited Accessibility
• Technical Challenges and Limited Expertise

Frequently Asked Questions

Ans: The estimated compound annual growth rate is 11.52% during the forecast period for the Optical Imaging market.

Ans: The projected market value of the Optical Imaging market is estimated at USD 1.99 Billion in 2023 and is expected to reach USD 5.30 Billion by 2032.

Ans: The optical imaging market is propelled by a combination of technological advancements, rising healthcare needs, and growing investments in medical diagnostics. 

Ans: The advanced technologies used in optical imaging systems, such as optical coherence tomography (OCT) and near-infrared fluorescence (NIRF) imaging, often involve substantial development and maintenance costs. This makes these solutions expensive for many healthcare providers, particularly in low-income and rural areas, limiting widespread adoption.

Ans: North America is the dominant region in the Optical Imaging market.

Table of Contents

1. Introduction

1.1 Market Definition

1.2 Scope (Inclusion and Exclusions)

1.3 Research Assumptions

2. Executive Summary

2.1 Market Overview

2.2 Regional Synopsis

2.3 Competitive Summary

3. Research Methodology

3.1 Top-Down Approach

3.2 Bottom-up Approach

3.3. Data Validation

3.4 Primary Interviews

4. Market Dynamics Impact Analysis

4.1 Market Driving Factors Analysis

4.1.1 Drivers

4.1.2 Restraints

4.1.3 Opportunities

4.1.4 Challenges

4.2 PESTLE Analysis

4.3 Porter’s Five Forces Model

5. Statistical Insights and Trends Reporting

5.1 Incidence and Prevalence of Conditions Requiring Optical Imaging (2023)

5.2 Adoption and Usage Trends of Optical Imaging Devices (2023)

5.3 Device Volume by Region (2020-2032)

5.4 Healthcare Spending by Region (2023)

       5.5 Regulatory Trends and Approval Rates

6. Competitive Landscape

6.1 List of Major Companies, By Region

6.2 Market Share Analysis, By Region

6.3 Product Benchmarking

6.3.1 Product specifications and features

6.3.2 Pricing

6.4 Strategic Initiatives

6.4.1 Marketing and promotional activities

6.4.2 Distribution and Supply Chain Strategies

6.4.3 Expansion plans and new product launches

6.4.4 Strategic partnerships and collaborations

6.5 Technological Advancements

6.6 Market Positioning and Branding

7. Optical Imaging Market Segmentation, by Product

  7.1 Chapter Overview

   7.2 Imaging Systems

              7.2.1 Imaging Systems Market Trends Analysis (2020-2032)

             7.2.2 Imaging Systems Market Size Estimates and Forecasts to 2032 (USD Million)

7.2.3 Optical Imaging Systems

              7.2.3.1 Optical Imaging Systems Market Trends Analysis (2020-2032)

             7.2.3.2 Optical Imaging Systems Market Size Estimates and Forecasts to 2032 (USD Million)

   7.2.4 Spectral Imaging Systems

              7.2.4.1 Spectral Imaging Systems Market Trends Analysis (2020-2032)

             7.2.4.2 Spectral Imaging Systems Market Size Estimates and Forecasts to 2032 (USD Million)

 7.3 Illumination Systems

          7.3.1 Illumination Systems Market Trends Analysis (2020-2032)

           7.3.2 Illumination Systems Market Size Estimates and Forecasts to 2032 (USD Million)

 7.4 Lenses

          7.4.1 Lenses Market Trends Analysis (2020-2032)

           7.4.2 Lenses Market Size Estimates and Forecasts to 2032 (USD Million)

7.5 Software

          7.5.1 Software Market Trends Analysis (2020-2032)

           7.5.2 Software Market Size Estimates and Forecasts to 2032 (USD Million)

 8. Optical Imaging Market Segmentation, By Application  

8.1 Chapter Overview

     8.2 Ophthalmology

8.2.1 Ophthalmology Market Trends Analysis (2020-2032)

8.2.2 Ophthalmology Market Size Estimates and Forecasts to 2032 (USD Million)

     8.3 Dentistry

8.3.1 Dentistry Market Trends Analysis (2020-2032)

8.3.2 Dentistry Market Size Estimates And Forecasts To 2032 (USD Million)

    8.4 Dermatology

8.4.1 Dermatology Market Trends Analysis (2020-2032)

8.4.2 Dermatology Market Size Estimates And Forecasts To 2032 (USD Million)

    8.5 Cardiology

8.5.1 Cardiology Market Trends Analysis (2020-2032)

8.5.2 Cardiology Market Size Estimates And Forecasts To 2032 (USD Million)

    8.6 Neurology

8.6.1 Neurology Market Trends Analysis (2020-2032)

8.6.2 Neurology Market Size Estimates And Forecasts To 2032 (USD Million)

    8.7 Oncology

8.7.1 Oncology Market Trends Analysis (2020-2032)

8.7.2 Oncology Market Size Estimates And Forecasts To 2032 (USD Million)

    8.8 Biotechnology and Research

8.8.1 Biotechnology and Research Market Trends Analysis (2020-2032)

8.8.2 Biotechnology and Research Market Size Estimates And Forecasts To 2032 (USD Million)

    8.9 Other Applications

8.9.1 Other Applications Market Trends Analysis (2020-2032)

8.9.2 Other Applications Market Size Estimates And Forecasts To 2032 (USD Million)

   9. Optical Imaging Market Segmentation, by Technique

    9.1 Chapter Overview

   9.2 Optical Coherence Tomography

            9.2.1 Optical Coherence Tomography Market Trends Analysis (2020-2032)

9.2.2 Optical Coherence Tomography Market Size Estimates and Forecasts to 2032 (USD Million)

  9.3 Near Infrared Spectroscopy

            9.3.1 Near Infrared Spectroscopy Market Trends Analysis (2020-2032)

9.3.2 Near Infrared Spectroscopy Market Size Estimates and Forecasts to 2032 (USD Million)

   9.4 Hyperspectral Imaging

            9.4.1 Hyperspectral Imaging Market Trends Analysis (2020-2032)

9.4.2 Hyperspectral Imaging Market Size Estimates and Forecasts to 2032 (USD Million)

   9.5 Photoacoustic Tomography

            9.5.1 Photoacoustic Tomography Market Trends Analysis (2020-2032)

9.5.2 Photoacoustic Tomography Market Size Estimates and Forecasts to 2032 (USD Million)

   10. Optical Imaging Market Segmentation, By End-User

10.1 Chapter Overview

     10.2 Diagnostic Imaging Center

10.2.1 Diagnostic Imaging Center Market Trends Analysis (2020-2032)

10.2.2 Diagnostic Imaging Center Market Size Estimates and Forecasts to 2032 (USD Million)

    10.3 Hospitals and Clinics

10.3.1 Hospitals and Clinics Market Trends Analysis (2020-2032)

10.3.2 Hospitals and Clinics Market Size Estimates and Forecasts to 2032 (USD Million)

    10.4 Research Laboratories

10.4.1 Research Laboratories Market Trends Analysis (2020-2032)

10.4.2 Research Laboratories Market Size Estimates and Forecasts to 2032 (USD Million)

10.5 Other End Users

10.5.1 Other End Users Market Trends Analysis (2020-2032)

10.5.2 Other End Users Market Size Estimates and Forecasts to 2032 (USD Million)

11. Regional Analysis

11.1 Chapter Overview

11.2 North America

11.2.1 Trends Analysis

11.2.2 North America Optical Imaging Market Estimates and Forecasts, by Country (2020-2032) (USD Million)

11.2.3 North America Optical Imaging Market Estimates and Forecasts, by Product(2020-2032) (USD Million)  

11.2.4 North America Optical Imaging Market Estimates and Forecasts, By Application (2020-2032) (USD Million)

11.2.5 North America Optical Imaging Market Estimates and Forecasts, by Technique (2020-2032) (USD Million)

11.2.6 North America Optical Imaging Market Estimates and Forecasts, By End-User (2020-2032) (USD Million)

11.2.7 USA

11.2.7.1 USA Optical Imaging Market Estimates and Forecasts, by Product (2020-2032) (USD Million)

11.2.7.2 USA Optical Imaging Market Estimates and Forecasts, By Application (2020-2032) (USD Million)

11.2.7.3 USA Optical Imaging Market Estimates and Forecasts, by Technique(2020-2032) (USD Million)

11.2.7.4 USA Optical Imaging Market Estimates and Forecasts, By End-User (2020-2032) (USD Million)

11.2.8 Canada

11.2.8.1 Canada Optical Imaging Market Estimates and Forecasts, by Product(2020-2032) (USD Million)

11.2.8.2 Canada Optical Imaging Market Estimates and Forecasts, By Application  (2020-2032) (USD Million)

11.2.8.3 Canada Optical Imaging Market Estimates and Forecasts, by Technique(2020-2032) (USD Million)

11.2.8.4 Canada Optical Imaging Market Estimates and Forecasts, By End-User (2020-2032) (USD Million)

11.2.9 Mexico

11.2.9.1 Mexico Optical Imaging Market Estimates and Forecasts, by Product (2020-2032) (USD Million)

11.2.9.2 Mexico Optical Imaging Market Estimates and Forecasts, By Application   (2020-2032) (USD Million)

11.2.9.3 Mexico Optical Imaging Market Estimates and Forecasts, by Technique (2020-2032) (USD Million)

11.2.9.4 Mexico Optical Imaging Market Estimates and Forecasts, By End-User (2020-2032) (USD Million

11.3 Europe

11.3.1 Eastern Europe

11.3.1.1 Trends Analysis

11.3.1.2 Eastern Europe Optical Imaging Market Estimates and Forecasts, by Country (2020-2032) (USD Million)

11.3.1.3 Eastern Europe Optical Imaging Market Estimates and Forecasts, by Product (2020-2032) (USD Million)  

11.3.1.4 Eastern Europe Optical Imaging Market Estimates and Forecasts, By Application   (2020-2032) (USD Million)

11.3.1.5 Eastern Europe Optical Imaging Market Estimates and Forecasts, by Technique (2020-2032) (USD Million)

11.3.1.6 Eastern Europe Optical Imaging Market Estimates and Forecasts, By End-User (2020-2032) (USD Million)

11.3.1.7 Poland

11.3.1.7.1 Poland Optical Imaging Market Estimates and Forecasts, by Product (2020-2032) (USD Million)

11.3.1.7.2 Poland Optical Imaging Market Estimates and Forecasts, By Application   (2020-2032) (USD Million)

11.3.1.7.3 Poland Optical Imaging Market Estimates and Forecasts, by Technique  (2020-2032) (USD Million)

11.3.1.7.4 Poland Optical Imaging Market Estimates and Forecasts, By End-User (2020-2032) (USD Million)

11.3.1.8 Romania

11.3.1.8.1 Romania Optical Imaging Market Estimates and Forecasts, by Product (2020-2032) (USD Million)

11.3.1.8.2 Romania Optical Imaging Market Estimates and Forecasts, By Application   (2020-2032) (USD Million)

11.3.1.8.3 Romania Optical Imaging Market Estimates and Forecasts, by Technique (2020-2032) (USD Million)

11.3.1.8.4 Romania Optical Imaging Market Estimates and Forecasts, By End-User (2020-2032) (USD Million)

11.3.1.9 Hungary

11.3.1.9.1 Hungary Optical Imaging Market Estimates and Forecasts, by Product (2020-2032) (USD Million)

11.3.1.9.2 Hungary Optical Imaging Market Estimates and Forecasts, By Application   (2020-2032) (USD Million)

11.3.1.9.3 Hungary Optical Imaging Market Estimates and Forecasts, by Technique (2020-2032) (USD Million)

11.3.1.9.4 Hungary Optical Imaging Market Estimates and Forecasts, By End-User (2020-2032) (USD Million)

11.3.1.10 Turkey

11.3.1.10.1 Turkey Optical Imaging Market Estimates and Forecasts, by Product (2020-2032) (USD Million)

11.3.1.10.2 Turkey Optical Imaging Market Estimates and Forecasts, By Application   (2020-2032) (USD Million)

11.3.1.10.3 Turkey Optical Imaging Market Estimates and Forecasts, by Technique (2020-2032) (USD Million)

11.3.1.10.4 Turkey Optical Imaging Market Estimates and Forecasts, By End-User (2020-2032) (USD Million)

11.3.1.11 Rest of Eastern Europe

11.3.1.11.1 Rest of Eastern Europe Optical Imaging Market Estimates and Forecasts, by Product (2020-2032) (USD Million)

11.3.1.11.2 Rest of Eastern Europe Optical Imaging Market Estimates and Forecasts, By Application (2020-2032) (USD Million)

11.3.1.11.3 Rest of Eastern Europe Optical Imaging Market Estimates and Forecasts, by Technique (2020-2032) (USD Million)

11.3.1.11.4 Rest of Eastern Europe Optical Imaging Market Estimates and Forecasts, By End-User (2020-2032) (USD Million)

11.3.2 Western Europe

11.3.2.1 Trends Analysis

11.3.2.2 Western Europe Optical Imaging Market Estimates and Forecasts, by Country (2020-2032) (USD Million)

11.3.2.3 Western Europe Optical Imaging Market Estimates and Forecasts, by Product (2020-2032) (USD Million)  

11.3.2.4 Western Europe Optical Imaging Market Estimates and Forecasts, By Application   (2020-2032) (USD Million)

11.3.2.5 Western Europe Optical Imaging Market Estimates and Forecasts, by Technique (2020-2032) (USD Million)

11.3.2.6 Western Europe Optical Imaging Market Estimates and Forecasts, By End-User (2020-2032) (USD Million)

11.3.2.7 Germany

11.3.2.7.1 Germany Optical Imaging Market Estimates and Forecasts, by Product (2020-2032) (USD Million)

11.3.2.7.2 Germany Optical Imaging Market Estimates and Forecasts, By Application   (2020-2032) (USD Million)

11.3.2.7.3 Germany Optical Imaging Market Estimates and Forecasts, by Technique (2020-2032) (USD Million)

11.3.2.7.4 Germany Optical Imaging Market Estimates and Forecasts, By End-User (2020-2032) (USD Million)

11.3.2.8 France

11.3.2.8.1 France Optical Imaging Market Estimates and Forecasts, by Product (2020-2032) (USD Million)

11.3.2.8.2 France Optical Imaging Market Estimates and Forecasts, By Application   (2020-2032) (USD Million)

11.3.2.8.3 France Optical Imaging Market Estimates and Forecasts, by Technique (2020-2032) (USD Million)

11.3.2.8.4 France Optical Imaging Market Estimates and Forecasts, By End-User  (2020-2032) (USD Million)

11.3.2.9 UK

11.3.2.9.1 UK Optical Imaging Market Estimates and Forecasts, by Product (2020-2032) (USD Million)

11.3.2.9.2 UK Optical Imaging Market Estimates and Forecasts, By Application   (2020-2032) (USD Million)

11.3.2.9.3 UK Optical Imaging Market Estimates and Forecasts, by Technique (2020-2032) (USD Million)

11.3.2.9.4 UK Optical Imaging Market Estimates and Forecasts, By End-User  (2020-2032) (USD Million)

11.3.2.10 Italy

11.3.2.10.1 Italy Optical Imaging Market Estimates and Forecasts, by Product (2020-2032) (USD Million)

11.3.2.10.2 Italy Optical Imaging Market Estimates and Forecasts, By Application   (2020-2032) (USD Million)

11.3.2.10.3 Italy Optical Imaging Market Estimates and Forecasts, by Technique (2020-2032) (USD Million)

11.3.2.10.4 Italy Optical Imaging Market Estimates and Forecasts, By End-User  (2020-2032) (USD Million)

11.3.2.11 Spain

11.3.2.11.1 Spain Optical Imaging Market Estimates and Forecasts, by Product (2020-2032) (USD Million)

11.3.2.11.2 Spain Optical Imaging Market Estimates and Forecasts, By Application   (2020-2032) (USD Million)

11.3.2.11.3 Spain Optical Imaging Market Estimates and Forecasts, by Technique (2020-2032) (USD Million)

11.3.2.11.4 Spain Optical Imaging Market Estimates and Forecasts, By End-User  (2020-2032) (USD Million)

11.3.2.12 Netherlands

11.3.2.12.1 Netherlands Optical Imaging Market Estimates and Forecasts, by Product (2020-2032) (USD Million)

11.3.2.12.2 Netherlands Optical Imaging Market Estimates and Forecasts, By Application   (2020-2032) (USD Million)

11.3.2.12.3 Netherlands Optical Imaging Market Estimates and Forecasts, by Technique (2020-2032) (USD Million)

11.3.2.12.4 Netherlands Optical Imaging Market Estimates and Forecasts, By End-User  (2020-2032) (USD Million)

11.3.2.13 Switzerland

11.3.2.13.1 Switzerland Optical Imaging Market Estimates and Forecasts, by Product (2020-2032) (USD Million)

11.3.2.13.2 Switzerland Optical Imaging Market Estimates and Forecasts, By Application    (2020-2032) (USD Million)

11.3.2.13.3 Switzerland Optical Imaging Market Estimates and Forecasts, by Technique (2020-2032) (USD Million)

11.3.2.13.4 Switzerland Optical Imaging Market Estimates and Forecasts, By End-User  (2020-2032) (USD Million)

11.3.2.14 Austria

11.3.2.14.1 Austria Optical Imaging Market Estimates and Forecasts, by Product (2020-2032) (USD Million)

11.3.2.14.2 Austria Optical Imaging Market Estimates and Forecasts, By Application    (2020-2032) (USD Million)

11.3.2.14.3 Austria Optical Imaging Market Estimates and Forecasts, by Technique (2020-2032) (USD Million)

11.3.2.14.4 Austria Optical Imaging Market Estimates and Forecasts, By End-User (2020-2032) (USD Million)

11.3.2.15 Rest of Western Europe

11.3.2.15.1 Rest of Western Europe Optical Imaging Market Estimates and Forecasts, by Product (2020-2032) (USD Million)

11.3.2.15.2 Rest of Western Europe Optical Imaging Market Estimates and Forecasts, By Application   (2020-2032) (USD Million)

11.3.2.15.3 Rest of Western Europe Optical Imaging Market Estimates and Forecasts, by Technique (2020-2032) (USD Million)

11.3.2.15.4 Rest of Western Europe Optical Imaging Market Estimates and Forecasts, By End-User (2020-2032) (USD Million)

11.4 Asia Pacific

11.4.1 Trends Analysis

11.4.2 Asia Pacific Optical Imaging Market Estimates and Forecasts, by Country (2020-2032) (USD Million)

11.4.3 Asia Pacific Optical Imaging Market Estimates and Forecasts, by Product (2020-2032) (USD Million)  

11.4.4 Asia Pacific Optical Imaging Market Estimates and Forecasts, By Application   (2020-2032) (USD Million)

11.4.5 Asia Pacific Optical Imaging Market Estimates and Forecasts, by Technique (2020-2032) (USD Million)

11.4.6 Asia Pacific Optical Imaging Market Estimates and Forecasts, By End-User (2020-2032) (USD Million)

11.4.7 China

11.4.7.1 China Optical Imaging Market Estimates and Forecasts, by Product (2020-2032) (USD Million)

11.4.7.2 China Optical Imaging Market Estimates and Forecasts, By Application   (2020-2032) (USD Million)

11.4.7.3 China Optical Imaging Market Estimates and Forecasts, by Technique (2020-2032) (USD Million)

11.4.7.4 China Optical Imaging Market Estimates and Forecasts, By End-User (2020-2032) (USD Million)

11.4.8 India

11.4.8.1 India Optical Imaging Market Estimates and Forecasts, by Product (2020-2032) (USD Million)

11.4.8.2 India Optical Imaging Market Estimates and Forecasts, By Application  (2020-2032) (USD Million)

11.4.8.3 India Optical Imaging Market Estimates and Forecasts, by Technique (2020-2032) (USD Million)

11.4.8.4 India Optical Imaging Market Estimates and Forecasts, By End-User  (2020-2032) (USD Million)

11.4.9 Japan

11.4.9.1 Japan Optical Imaging Market Estimates and Forecasts, by Product (2020-2032) (USD Million)

11.4.9.2 Japan Optical Imaging Market Estimates and Forecasts, By Application   (2020-2032) (USD Million)

11.4.9.3 Japan Optical Imaging Market Estimates and Forecasts, by Technique (2020-2032) (USD Million)

11.4.9.4 Japan Optical Imaging Market Estimates and Forecasts, By End-User  (2020-2032) (USD Million)

11.4.10 South Korea

11.4.10.1 South Korea Optical Imaging Market Estimates and Forecasts, by Product (2020-2032) (USD Million)

11.4.10.2 South Korea Optical Imaging Market Estimates and Forecasts, By Application   (2020-2032) (USD Million)

11.4.10.3 South Korea Optical Imaging Market Estimates and Forecasts, by Technique (2020-2032) (USD Million)

11.4.10.4 South Korea Optical Imaging Market Estimates and Forecasts, By End-User (2020-2032) (USD Million)

11.4.11 Vietnam

11.4.11.1 Vietnam Optical Imaging Market Estimates and Forecasts, by Product (2020-2032) (USD Million)

11.4.11.2 Vietnam Optical Imaging Market Estimates and Forecasts, By Application   (2020-2032) (USD Million)

11.4.11.3 Vietnam Optical Imaging Market Estimates and Forecasts, by Technique (2020-2032) (USD Million)

11.4.11.4 Vietnam Optical Imaging Market Estimates and Forecasts, By End-User (2020-2032) (USD Million)

11.4.12 Singapore

11.4.12.1 Singapore Optical Imaging Market Estimates and Forecasts, by Product (2020-2032) (USD Million)

11.4.12.2 Singapore Optical Imaging Market Estimates and Forecasts, By Application   (2020-2032) (USD Million)

11.4.12.3 Singapore Optical Imaging Market Estimates and Forecasts, by Technique  (2020-2032) (USD Million)

11.4.12.4 Singapore Optical Imaging Market Estimates and Forecasts, By End-User (2020-2032) (USD Million)

11.4.13 Australia

11.4.13.1 Australia Optical Imaging Market Estimates and Forecasts, by Product (2020-2032) (USD Million)

11.4.13.2 Australia Optical Imaging Market Estimates and Forecasts, By Application   (2020-2032) (USD Million)

11.4.13.3 Australia Optical Imaging Market Estimates and Forecasts, by Technique (2020-2032) (USD Million)

11.4.13.4 Australia Optical Imaging Market Estimates and Forecasts, By End-User  (2020-2032) (USD Million)

11.4.14 Rest of Asia Pacific

11.4.14.1 Rest of Asia Pacific Optical Imaging Market Estimates and Forecasts, by Product (2020-2032) (USD Million)

11.4.14.2 Rest of Asia Pacific Optical Imaging Market Estimates and Forecasts, By Application   (2020-2032) (USD Million)

11.4.14.3 Rest of Asia Pacific Optical Imaging Market Estimates and Forecasts, by Technique (2020-2032) (USD Million)

11.4.14.4 Rest of Asia Pacific Optical Imaging Market Estimates and Forecasts, By End-User (2020-2032) (USD Million)

11.5 Middle East and Africa

11.5.1 Middle East

11.5.1.1 Trends Analysis

11.5.1.2 Middle East Optical Imaging Market Estimates and Forecasts, by Country (2020-2032) (USD Million)

11.5.1.3 Middle East Optical Imaging Market Estimates and Forecasts, by Product (2020-2032) (USD Million)  

11.5.1.4 Middle East Optical Imaging Market Estimates and Forecasts, By Application   (2020-2032) (USD Million)

11.5.1.5 Middle East Optical Imaging Market Estimates and Forecasts, by Technique  (2020-2032) (USD Million)

11.5.1.6 Middle East Optical Imaging Market Estimates and Forecasts, By End-User (2020-2032) (USD Million)

11.5.1.7 UAE

11.5.1.7.1 UAE Optical Imaging Market Estimates and Forecasts, by Product (2020-2032) (USD Million)

11.5.1.7.2 UAE Optical Imaging Market Estimates and Forecasts, By Application   (2020-2032) (USD Million)

11.5.1.7.3 UAE Optical Imaging Market Estimates and Forecasts, by Technique  (2020-2032) (USD Million)

11.5.1.7.4 UAE Optical Imaging Market Estimates and Forecasts, By End-User (2020-2032) (USD Million)

11.5.1.8 Egypt

11.5.1.8.1 Egypt Optical Imaging Market Estimates and Forecasts, by Product (2020-2032) (USD Million)

11.5.1.8.2 Egypt Optical Imaging Market Estimates and Forecasts, By Application   (2020-2032) (USD Million)

11.5.1.8.3 Egypt Optical Imaging Market Estimates and Forecasts, by Technique (2020-2032) (USD Million)

11.5.1.8.4 Egypt Optical Imaging Market Estimates and Forecasts, By End-User (2020-2032) (USD Million)

11.5.1.9 Saudi Arabia

11.5.1.9.1 Saudi Arabia Optical Imaging Market Estimates and Forecasts, by Product (2020-2032) (USD Million)

11.5.1.9.2 Saudi Arabia Optical Imaging Market Estimates and Forecasts, By Application   (2020-2032) (USD Million)

11.5.1.9.3 Saudi Arabia Optical Imaging Market Estimates and Forecasts, by Technique (2020-2032) (USD Million)

11.5.1.9.4 Saudi Arabia Optical Imaging Market Estimates and Forecasts, By End-User  (2020-2032) (USD Million)

11.5.1.10 Qatar

11.5.1.10.1 Qatar Optical Imaging Market Estimates and Forecasts, by Product (2020-2032) (USD Million)

11.5.1.10.2 Qatar Optical Imaging Market Estimates and Forecasts, By Application   (2020-2032) (USD Million)

11.5.1.10.3 Qatar Optical Imaging Market Estimates and Forecasts, by Technique  (2020-2032) (USD Million)

11.5.1.10.4 Qatar Optical Imaging Market Estimates and Forecasts, By End-User (2020-2032) (USD Million)

11.5.1.11 Rest of Middle East

11.5.1.11.1 Rest of Middle East Optical Imaging Market Estimates and Forecasts, by Product (2020-2032) (USD Million)

11.5.1.11.2 Rest of Middle East Optical Imaging Market Estimates and Forecasts, By Application   (2020-2032) (USD Million)

11.5.1.11.3 Rest of Middle East Optical Imaging Market Estimates and Forecasts, by Technique (2020-2032) (USD Million)

11.5.1.11.4 Rest of Middle East Optical Imaging Market Estimates and Forecasts, By End-User (2020-2032) (USD Million)

11.5.2 Africa

11.5.2.1 Trends Analysis

11.5.2.2 Africa Optical Imaging Market Estimates and Forecasts, by Country (2020-2032) (USD Million)

11.5.2.3 Africa Optical Imaging Market Estimates and Forecasts, by Product (2020-2032) (USD Million)  

11.5.2.4 Africa Optical Imaging Market Estimates and Forecasts, By Application   (2020-2032) (USD Million)

11.5.2.5 Africa Optical Imaging Market Estimates and Forecasts, by Technique (2020-2032) (USD Million)

11.5.2.6 Africa Optical Imaging Market Estimates and Forecasts, By End-User  (2020-2032) (USD Million)

11.5.2.7 South Africa

11.5.2.7.1 South Africa Optical Imaging Market Estimates and Forecasts, by Product (2020-2032) (USD Million)

11.5.2.7.2 South Africa Optical Imaging Market Estimates and Forecasts, By Application   (2020-2032) (USD Million)

11.5.2.7.3 South Africa Optical Imaging Market Estimates and Forecasts, by Technique (2020-2032) (USD Million)

11.5.2.7.4 South Africa Optical Imaging Market Estimates and Forecasts, By End-User  (2020-2032) (USD Million)

11.5.2.8 Nigeria

11.5.2.8.1 Nigeria Optical Imaging Market Estimates and Forecasts, by Product (2020-2032) (USD Million)

11.5.2.8.2 Nigeria Optical Imaging Market Estimates and Forecasts, By Application   (2020-2032) (USD Million)

11.5.2.8.3 Nigeria Optical Imaging Market Estimates and Forecasts, by Technique (2020-2032) (USD Million)

11.5.2.8.4 Nigeria Optical Imaging Market Estimates and Forecasts, By End-User (2020-2032) (USD Million)

11.5.2.9 Rest of Africa

11.5.2.9.1 Rest of Africa Optical Imaging Market Estimates and Forecasts, by Product (2020-2032) (USD Million)

11.5.2.9.2 Rest of Africa Optical Imaging Market Estimates and Forecasts, By Application   (2020-2032) (USD Million)

11.5.2.9.3 Rest of Africa Optical Imaging Market Estimates and Forecasts, by Technique (2020-2032) (USD Million)

11.5.2.9.4 Rest of Africa Optical Imaging Market Estimates and Forecasts, By End-User  (2020-2032) (USD Million)

11.6 Latin America

11.6.1 Trends Analysis

11.6.2 Latin America Optical Imaging Market Estimates and Forecasts, by Country (2020-2032) (USD Million)

11.6.3 Latin America Optical Imaging Market Estimates and Forecasts, by Product (2020-2032) (USD Million)  

11.6.4 Latin America Optical Imaging Market Estimates and Forecasts, By Application   (2020-2032) (USD Million)

11.6.5 Latin America Optical Imaging Market Estimates and Forecasts, by Technique (2020-2032) (USD Million)

11.6.6 Latin America Optical Imaging Market Estimates and Forecasts, By End-User (2020-2032) (USD Million)

11.6.7 Brazil

11.6.7.1 Brazil Optical Imaging Market Estimates and Forecasts, by Product (2020-2032) (USD Million)

11.6.7.2 Brazil Optical Imaging Market Estimates and Forecasts, By Application   (2020-2032) (USD Million)

11.6.7.3 Brazil Optical Imaging Market Estimates and Forecasts, by Technique (2020-2032) (USD Million)

11.6.7.4 Brazil Optical Imaging Market Estimates and Forecasts, By End-User (2020-2032) (USD Million)

11.6.8 Argentina

11.6.8.1 Argentina Optical Imaging Market Estimates and Forecasts, by Product (2020-2032) (USD Million)

11.6.8.2 Argentina Optical Imaging Market Estimates and Forecasts, By Application   (2020-2032) (USD Million)

11.6.8.3 Argentina Optical Imaging Market Estimates and Forecasts, by Technique(2020-2032) (USD Million)

11.6.8.4 Argentina Optical Imaging Market Estimates and Forecasts, By End-User (2020-2032) (USD Million)

11.6.9 Colombia

11.6.9.1 Colombia Optical Imaging Market Estimates and Forecasts, by Product(2020-2032) (USD Million)

11.6.9.2 Colombia Optical Imaging Market Estimates and Forecasts, By Application  (2020-2032) (USD Million)

11.6.9.3 Colombia Optical Imaging Market Estimates and Forecasts, by Technique(2020-2032) (USD Million)

11.6.9.4 Colombia Optical Imaging Market Estimates and Forecasts, By End-User (2020-2032) (USD Million)

11.6.10 Rest of Latin America

11.6.10.1 Rest of Latin America Optical Imaging Market Estimates and Forecasts, by Product (2020-2032) (USD Million)

11.6.10.2 Rest of Latin America Optical Imaging Market Estimates and Forecasts, By Application (2020-2032) (USD Million)

11.6.10.3 Rest of Latin America Optical Imaging Market Estimates and Forecasts, by Technique (2020-2032) (USD Million)

11.6.10.4 Rest of Latin America Optical Imaging Market Estimates and Forecasts, By End-User (2020-2032) (USD Million)

12. Company Profiles

12.1 Carl Zeiss Meditec

12.1.1 Company Overview

12.1.2 Financial

12.1.3 Products/ Services Offered

12.1.4 SWOT Analysis

12.2 Abbott

12.2.1 Company Overview

12.2.2 Financial

12.2.3 Products/ Services Offered

12.2.4 SWOT Analysis

12.3 Topcon Corporation

      12.3.1 Company Overview

12.3.2 Financial

12.3.3 Products/ Services Offered

12.3.4 SWOT Analysis

12.4 Canon

12.4.1 Company Overview

12.4.2 Financial

12.4.3 Products/ Services Offered

12.4.4 SWOT Analysis

12.5 PerkinElmer

12.5.1 Company Overview

12.5.2 Financial

12.5.3 Products/ Services Offered

12.5.4 SWOT Analysis

12.6 Koninklijke Philips

12.6.1 Company Overview

12.6.2 Financial

12.6.3 Products/ Services Offered

12.6.4 SWOT Analysis

12.7 Heidelberg Engineering

            12.7.1 Company Overview

12.7.2 Financial

12.7.3 Products/ Services Offered

12.7.4 SWOT Analysis

12.8 Leica Microsystems

12.8.1 Company Overview

12.8.2 Financial

12.8.3 Products/ Services Offered

12.8.4 SWOT Analysis

12.9 Headwall Photonics

12.9.1 Company Overview

12.9.2 Financial

12.9.3 Products/ Services Offered

12.9.4 SWOT Analysis

12.10 Visionix

12.10.1 Company Overview

12.10.2 Financial

12.10.3 Products/ Services Offered

12.10.4 SWOT Analysis

13. Use Cases and Best Practices

14. Conclusion

An accurate research report requires proper strategizing as well as implementation. There are multiple factors involved in the completion of good and accurate research report and selecting the best methodology to compete the research is the toughest part. Since the research reports we provide play a crucial role in any company’s decision-making process, therefore we at SNS Insider always believe that we should choose the best method which gives us results closer to reality. This allows us to reach at a stage wherein we can provide our clients best and accurate investment to output ratio.

Each report that we prepare takes a timeframe of 350-400 business hours for production. Starting from the selection of titles through a couple of in-depth brain storming session to the final QC process before uploading our titles on our website we dedicate around 350 working hours. The titles are selected based on their current market cap and the foreseen CAGR and growth.


The 5 steps process:

Step 1: Secondary Research:

Secondary Research or Desk Research is as the name suggests is a research process wherein, we collect data through the readily available information. In this process we use various paid and unpaid databases which our team has access to and gather data through the same. This includes examining of listed companies’ annual reports, Journals, SEC filling etc. Apart from this our team has access to various associations across the globe across different industries. Lastly, we have exchange relationships with various university as well as individual libraries.

Secondary Research

Step 2: Primary Research

When we talk about primary research, it is a type of study in which the researchers collect relevant data samples directly, rather than relying on previously collected data.  This type of research is focused on gaining content specific facts that can be sued to solve specific problems. Since the collected data is fresh and first hand therefore it makes the study more accurate and genuine.

We at SNS Insider have divided Primary Research into 2 parts.

Part 1 wherein we interview the KOLs of major players as well as the upcoming ones across various geographic regions. This allows us to have their view over the market scenario and acts as an important tool to come closer to the accurate market numbers. As many as 45 paid and unpaid primary interviews are taken from both the demand and supply side of the industry to make sure we land at an accurate judgement and analysis of the market.

This step involves the triangulation of data wherein our team analyses the interview transcripts, online survey responses and observation of on filed participants. The below mentioned chart should give a better understanding of the part 1 of the primary interview.

Primary Research

Part 2: In this part of primary research the data collected via secondary research and the part 1 of the primary research is validated with the interviews from individual consultants and subject matter experts.

Consultants are those set of people who have at least 12 years of experience and expertise within the industry whereas Subject Matter Experts are those with at least 15 years of experience behind their back within the same space. The data with the help of two main processes i.e., FGDs (Focused Group Discussions) and IDs (Individual Discussions). This gives us a 3rd party nonbiased primary view of the market scenario making it a more dependable one while collation of the data pointers.

Step 3: Data Bank Validation

Once all the information is collected via primary and secondary sources, we run that information for data validation. At our intelligence centre our research heads track a lot of information related to the market which includes the quarterly reports, the daily stock prices, and other relevant information. Our data bank server gets updated every fortnight and that is how the information which we collected using our primary and secondary information is revalidated in real time.

Data Bank Validation

Step 4: QA/QC Process

After all the data collection and validation our team does a final level of quality check and quality assurance to get rid of any unwanted or undesired mistakes. This might include but not limited to getting rid of the any typos, duplication of numbers or missing of any important information. The people involved in this process include technical content writers, research heads and graphics people. Once this process is completed the title gets uploader on our platform for our clients to read it.

Step 5: Final QC/QA Process:

This is the last process and comes when the client has ordered the study. In this process a final QA/QC is done before the study is emailed to the client. Since we believe in giving our clients a good experience of our research studies, therefore, to make sure that we do not lack at our end in any way humanly possible we do a final round of quality check and then dispatch the study to the client.

Key Segmentation

By Product

  • Imaging Systems

    • Optical Imaging Systems

    • Spectral Imaging Systems

  • Illumination Systems

  • Lenses

  • Software

By Application

  • Ophthalmology

  • Dentistry

  • Dermatology

  • Cardiology

  • Neurology

  • Oncology

  • Biotechnology and Research

  • Other Applications

By Technique

  • Optical Coherence Tomography

  • Near Infrared Spectroscopy

  • Hyperspectral Imaging

  • Photoacoustic Tomography

By End User

  • Diagnostic Imaging Center

  • Hospitals and Clinics

  • Research Laboratories

  • Other End Users

Request for Segment Customization as per your Business Requirement: Segment Customization Request

Regional Coverage:

North America

  • US

  • Canada

  • Mexico

Europe

  • Eastern Europe

    • Poland

    • Romania

    • Hungary

    • Turkey

    • Rest of Eastern Europe

  • Western Europe

    • Germany

    • France

    • UK

    • Italy

    • Spain

    • Netherlands

    • Switzerland

    • Austria

    • Rest of Western Europe

Asia Pacific

  • China

  • India

  • Japan

  • South Korea

  • Vietnam

  • Singapore

  • Australia

  • Rest of Asia Pacific

Middle East & Africa

Middle East

  • UAE

  • Egypt

  • Saudi Arabia

  • Qatar

  • Rest of the Middle East

Africa

  • Nigeria

  • South Africa

  • Rest of Africa

Latin America

  • Brazil

  • Argentina

  • Colombia

  • Rest of Latin America

Request for Country Level Research Report: Country Level Customization Request

Available Customization

With the given market data, SNS Insider offers customization as per the company’s specific needs. The following customization options are available for the report:

  • Product Analysis

  • Criss-Cross segment analysis (e.g. Product X Application)

  • Product Matrix which gives a detailed comparison of the product portfolio of each company

  • Geographic Analysis

  • Additional countries in any of the regions

  • Company Information

  • Detailed analysis and profiling of additional market players (Up to five)


  •            5000 (33% Discount)


  •            8950 (40% Discount)


  •            3050 (23% Discount)

Start a Conversation

Hi! Click one of our member below to chat on Phone