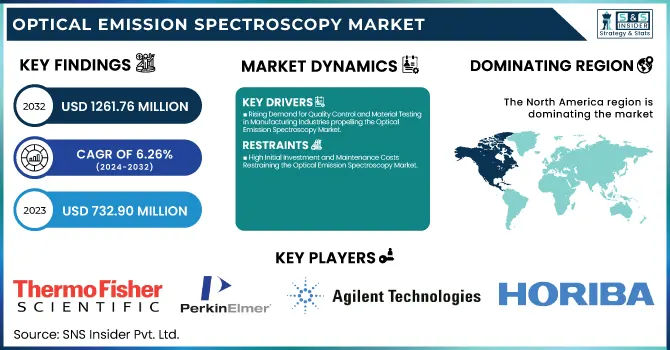
The Optical Emission Spectroscopy Market was valued at USD 732.90 million in 2023 and is expected to reach USD 1261.76 million by 2032, growing at a CAGR of 6.26% from 2024-2032.
The Optical Emission Spectroscopy (OES) Market report provides insights into adoption trends and industry utilization of OES, with the key areas covered being metallurgy, mining, and aerospace. It presents regional OES usage trends, with dominant and growing markets highlighted. The report also provides projections of OES equipment volume with a prospective perspective for technology adoption. Further, it presents spending trends within government, industrial, and private sectors, with the trends in investments highlighted. A distinctive aspect is an analysis of regulatory and compliance trends, reviewing changing standards that dictate OES adoption, and providing an in-depth knowledge of compliance requirements applicable to specific industries.
Drivers
Rising Demand for Quality Control and Material Testing in Manufacturing Industries propelling the Optical Emission Spectroscopy Market.
The growing demand for rigorous quality control and material analysis in industries like metallurgy, automotive, and aerospace is a key driver of the Optical Emission Spectroscopy (OES) market. OES is extensively applied to determine the chemical composition of metals and alloys to meet safety and performance requirements. The automotive industry, for example, is seeing rapid expansion in electric vehicle (EV) manufacturing, where high-precision material analysis is needed to maximize battery performance and lightweight parts. Some recent breakthroughs include the introduction by Thermo Fisher Scientific of a semi-quantitative analysis tool for ICP-OES in April 2024, further increasing the capacity to analyze unknown samples effectively. Moreover, increasing needs for sophisticated material testing in foundries and factories are fueling the implementation of OES technology.
Technological Advancements in Optical Emission Spectroscopy driving the market growth.
Optical Emission Spectroscopy advancements, including better detector sensitivity, automation, and artificial intelligence (AI)-)-enabled data analysis, are driving market expansion. Next-generation OES systems currently utilize solid-state detectors (SSD) and hybrid detection technologies to improve accuracy and speed. The availability of cloud-based spectroscopy solutions permits real-time sharing of data and remote diagnostics, cutting downtime and enhancing efficiency. For example, in 2023, Hitachi High-Tech introduced a next-generation OES system with improved argon-purge optics for better detection limits in the analysis of ultra-low carbon steel. Furthermore, the growing usage of Inductively Coupled Plasma Optical Emission Spectroscopy (ICP-OES) for environmental monitoring and pharmaceutical applications is propelling market growth. The increasing use of AI-driven analytical software in spectroscopy is likely to further automate workflows and enhance precision, driving growth in the OES market.
Restraint
High Initial Investment and Maintenance Costs Restraining the Optical Emission Spectroscopy Market.
One of the biggest constraints in the Optical Emission Spectroscopy (OES) industry is the heavy initial investment and regular maintenance charges involved in such sophisticated analytical systems. OES systems, especially Inductively Coupled Plasma Optical Emission Spectroscopy (ICP-OES) systems, demand high capital outlay for procurement, installation, and calibration. Moreover, operational expenses, such as the requirement for high-purity argon gas, maintenance, and periodic software updates, contribute to the cost, particularly for small and medium-sized businesses. The complexity of operating systems also requires expert employees, further adding training and labor costs. Regardless of declining costs due to technological improvements over time, affordability is an important issue. Budget-constrained firms can use other, less expensive analytical methods like X-ray fluorescence (XRF) spectroscopy to limit the more extensive application of OES across price-sensitive industries.
Opportunities
With growing global environmental regulations and a greater emphasis on green industrial practices, the Optical Emission Spectroscopy (OES) market holds opportunities in environmental monitoring.
Governments and regulatory agencies like the Environmental Protection Agency (EPA) and the European Environment Agency (EEA) are implementing strict emission control policies, which are propelling demand for accurate metal and pollutant analysis in air, water, and soil. OES, especially ICP-OES, is extensively employed for trace detection of heavy metals in industrial effluents, potable water, and crop samples. Increased pollution concerns, combined with advances in automation and real-time monitoring, have motivated industries to make investments in OES technology. The introduction of portable and field-deployable OES instruments is further expanding market penetration, generating new revenues for manufacturers supplying the environmental testing market.
Challenges
One of the biggest challenges in the Optical Emission Spectroscopy (OES) market is the complexity of standardization and calibration across industries and applications.
OES analyzers need highly accurate calibration standards to provide proper elemental analysis, which can depend on the sample matrix, sample type, and the presence of interfering elements. In applications such as metallurgy, mining, and environmental testing, minute deviations from calibration cause results to vary, affecting quality control and compliance with regulations. Various manufacturers employ proprietary software and calibration practices, so cross-platform standardization is problematic. Continuous recalibration resulting from instrument drift or varying operating conditions further complicates repetitive analysis. These challenges can be overcome through enhanced automation in calibration processes, standardization of industry standards, and software-driven analytical corrections to improve reproducibility and usability.
By Offerings
The equipment division dominated the Optical Emission Spectroscopy (OES) market in 2023 with a 62.31% market share, following the widespread uptake of high-technology spectrometers across the metallurgy, mining, automobile, and aircraft industries. Improving focus on material quality checking, meeting regulatory requirements for stringency, and greater dependency on accuracy analytical instrumentation have boosted high-performance OES equipment demand such as Arc/Spark OES and Inductively Coupled Plasma Optical Emission Spectroscopy (ICP-OES) systems. The leading players like Thermo Fisher Scientific, Agilent Technologies, and PerkinElmer are continuously launching innovative, high-throughput OES solutions to increase efficiency and precision in elemental analysis. In addition, as processes across industries are increasingly automated, demand for benchtop and portable spectrometers has increased, supporting the segment's market leadership.
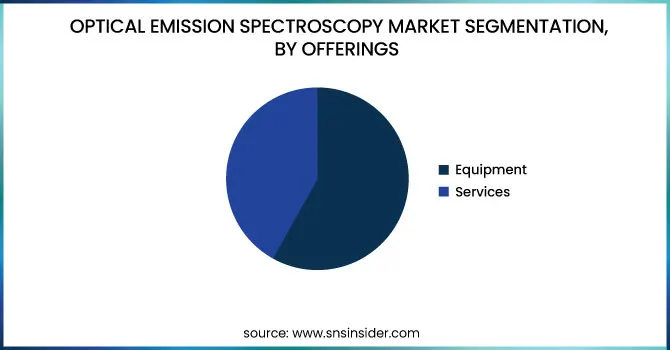
The services segment is experiencing the fastest growth during the forecast period as the demand for instrument calibration, maintenance, and software updates grows to improve the performance and lifespan of OES equipment. With OES systems becoming increasingly sophisticated and integrated with digital technologies, industries need specialized support services such as training, data analysis consulting, and remote monitoring to maximize instrument performance. Furthermore, the increasing trend of outsourcing analytical services to third-party contract research organizations (CROs) and third-party laboratories is driving the demand for specialized OES-related services. Increasing regulatory compliance demands and requirements for high-accuracy material testing are compelling companies to invest in post-sales support and service contracts, which is propelling the growth of the services segment in the Optical Emission Spectroscopy market.
By Form Factor
The benchtop segment dominated the Optical Emission Spectroscopy (OES) market with a 70.14% market share in 2023 because of its higher accuracy, stability, and broad applications in industries like metallurgy, mining, aerospace, and automobile. Benchtop OES systems provide precise elemental analysis and are the most sought-after by laboratories and manufacturing plants that need reliable material testing and quality assurance. These instruments come with sophisticated technologies, including Photomultiplier Tubes (PMT) and Solid-State Detectors (SSD), which improve their analytical capabilities for trace element detection. They are also used in high-volume sample testing industries based on the toughness and versatility of benchtop OES to test a variety of metal and non-metal samples. With top players like Thermo Fisher Scientific, Agilent Technologies, and PerkinElmer regularly developing benchtop models, this segment continued to be the most preferred option in 2023.
By Product
The Arc/Spark Optical Emission Spectroscopy segment dominated the market in 2023 with a 64.15% market share because of its extensive use in metallurgy, foundries, and manufacturing sectors for accurate metal analysis. The technology is extremely efficient in identifying the composition of solid metal samples and hence is the first choice for quality control in steel production, aluminum processing, and automotive industries. Arc/Spark OES provides fast, precise, and reproducible results, with adherence to industry standards for material inspection. Further, high-energy discharge technology evolution and automation have enhanced the efficiency of Arc/Spark OES devices, increasing their demand as well. With prominent companies such as Hitachi High-Tech Analytical Science, Bruker Corporation, and SPECTRO Analytical Instruments developing improved Arc/Spark OES, the segment dominated the market even in 2023.
By Detector
The Solid state detector (SSD) segment dominated the Optical Emission Spectroscopy (OES) Market with a 45.62% market share in 2023 because of its higher sensitivity, speed, and longevity over conventional photomultiplier tube (PMT) detectors. SSDs provide better resolution and quicker signal processing, which makes them suitable for applications that demand accurate elemental analysis, including metallurgy, mining, and environmental testing. In addition, SSD technology is smaller, more energy efficient, and less expensive, which has contributed to its broad application in contemporary OES instruments. Accelerating the growing need for real-time and high-throughput analysis in research labs and industrial quality control further pushed the use of SSDs. Recent developments of CMOS and CCD-based solid-state detectors have improved detection precision and dynamic range, further enhancing the utility of SSDs as the next-generation OES system choice.
By Application
The Chemical Composition Analysis segment dominated the market with 43.06% market share in 2023 because of its importance in material authentication, identification of alloys, and analysis of elements in various industries. OES is greatly depended upon by industries including metallurgy, aerospace, automotive, and manufacturing for accurate chemical characterization of raw materials as well as finished products to certify that they meet the requirements of regulatory norms and quality standards. The increasing need for high-purity metals, advanced alloys, and composite materials has further accelerated the demand for strong chemical composition analysis. Furthermore, improvements in Inductively Coupled Plasma Optical Emission Spectroscopy (ICP-OES) and Arc/Spark OES have improved accuracy, speed, and sensitivity, making them unavoidable for laboratories and industrial use. With more stringent material safety regulations and rising quality control requirements, this segment remained the market leader in 2023.
By End Use
The Metallurgy and Foundries segment dominated the market with a 27.41% market share in 2023 because of the widespread application of OES in metal production, processing, and quality assurance. OES is a critical technology in the metallurgy sector for the analysis of the chemical composition of metals and alloys to comply with industry standards and material specifications. As the requirement for high-strength metals accelerates in building, automotive, aviation, and heavy machinery applications, producers come to depend upon OES in detecting trace contaminants, managing contaminants, and providing product uniformity. In addition, more demanding government regulations towards metal purity as well as assurance of quality necessitated extensive applications of OES in foundries. The capability of Arc/Spark OES and ICP-OES to offer fast, precise, and economical elemental analysis has further reinforced the market dominance of the segment.
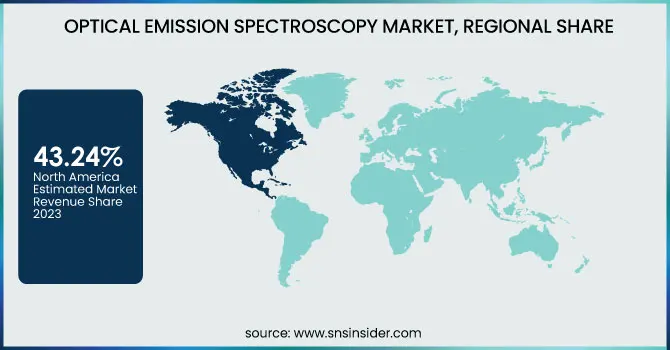
North America dominated the Optical Emission Spectroscopy (OES) market with a 43.24% market share in 2023, owing to the established industrial base, strict regulatory requirements, and high usage of sophisticated analytical technologies. The region has a strong base of leading market players, such as Thermo Fisher Scientific, Agilent Technologies, and PerkinElmer, driving innovation and ongoing development of OES solutions. Moreover, stringent environmental regulations imposed by organizations like the Environmental Protection Agency (EPA) and the Occupational Safety and Health Administration (OSHA) require accurate metal analysis in metallurgy, automotive, and oil & gas industries. The region's investment in research and development, combined with its leadership in quality control and material testing applications, has further entrenched its supremacy. Additionally, U.S. and Canadian aerospace and defense industries greatly depend on OES for component testing and failure analysis, supporting North America's dominance in the industry.
Asia Pacific is witnessing the fastest growth in the Optical Emission Spectroscopy (OES) market with a 7.35% CAGR throughout the forecast period due to Manufacturing and infrastructure, and growing demand for quality control in major industries. China, India, Japan, and South Korea are increasing their metallurgy, automotive, and semiconductor sectors, which are fueling the demand for sophisticated material analysis methods like OES. The booming mining and metal production industry in China and Australia has also boosted the use of OES for ore and alloy analysis. Also, rising environmental issues and tighter regulatory norms in countries such as China and India on emissions as well as wastewater treatment are driving the adoption of OES solutions in environmental testing. With technological shifts, high foreign investments, and a transition towards automation, Asia Pacific is expected to dominate the market growth throughout the forecast period.
Some of the major key players in the Optical Emission Spectroscopy Market
Thermo Fisher Scientific Inc. (iCAP 7000 Plus Series ICP-OES, ARL iSpark Series Optical Emission Spectrometers)
PerkinElmer Inc. (Avio 500 ICP-OES, Optima 8000 ICP-OES)
Agilent Technologies Inc. (5100 ICP-OES, 5800 ICP-OES)
Horiba Ltd. (Ultima Expert ICP-OES, GD-Profiler 2)
Hitachi High-Tech Analytical Science (FM EXPERT Optical Emission Spectrometer, OE750 Optical Emission Spectrometer)
Bruker Corporation (Q4 TASMAN Series, Q8 MAGELLAN)
SPECTRO Analytical Instruments GmbH (SPECTRO ARCOS ICP-OES, SPECTROLAB S)
Shimadzu Corporation (ICPE-9800 Series, ICPE-9000 Series)
Analytik Jena AG (PlasmaQuant PQ 9000, PlasmaQuant PQ 9100 Elite)
GBC Scientific Equipment (Integra XL ICP-OES, OptiMass 9500)
Teledyne Leeman Labs (Prodigy Plus ICP-OES, Prodigy DC Arc)
Rigaku Corporation (NEX DE VS, Supermini200)
Spectro Scientific (Spectroil M Series, Spectroil Q100)
Oxford Instruments plc (Foundry-Master Pro2, PMI-Master Pro2)
Malvern Panalytical Ltd. (Zetium, Epsilon 4)
Skyray Instrument Inc. (ICP-2060T, ICP-5000)
Belec Spektrometrie Opto-Elektronik GmbH (Belec Compact Port HLC, Belec Vario Lab)
Luvata Group (OES-5500, OES-6500)
Angstrom Advanced Inc. (AA-7000 ICP-OES, AA-5000 ICP-OES)
Qualitest International Inc. (Q4 Mobile, Q6 Mobile)
Suppliers (These suppliers provide essential components, consumables, and raw materials required for Optical Emission Spectroscopy (OES) instruments and operations.)
Avantor, Inc.
Merck KGaA
Sigma-Aldrich Corporation
Thermo Fisher Scientific Inc.
PerkinElmer Inc.
Agilent Technologies Inc.
Bruker Corporation
Shimadzu Corporation
Hitachi High-Tech Analytical Science
HORIBA, Ltd.
In April 2024, Thermo Fisher Scientific launched a new semi-quantitative analysis instrument for inductively coupled plasma-optical emission spectroscopy (ICP-OES). The new solution is meant to improve the identification of unknown samples by making the analytical process easier. Through this innovation, Thermo Fisher seeks to enhance efficiency in elemental analysis and help achieve a cleaner and safer environment.
Report Attributes | Details |
---|---|
Market Size in 2023 | US$ 732.90 million |
Market Size by 2032 | US$ 1261.76 million |
CAGR | CAGR of 6.26% From 2024 to 2032 |
Base Year | 2023 |
Forecast Period | 2024-2032 |
Historical Data | 2020-2022 |
Report Scope & Coverage | Market Size, Segments Analysis, Competitive Landscape, Regional Analysis, DROC & SWOT Analysis, Forecast Outlook |
Key Segments | • By Offerings (Equipment, Services) • By Form Factor (Benchtop, Portable) • By Product (Arc/Spark OES, ICP-OES [Inductively Coupled Plasma]) • By Detector (Photomultiplier Tube [PMT], Solid State Detector [SSD], Hybrid) • By Application (Chemical Composition Analysis, Material Testing and Quality Control, Environmental Testing, Research and Development) • By End Use (Metallurgy and Foundries, Mining and Exploration, Automotive, Aerospace and Defense, Oil and Gas, Food and Beverages, Metals and Heavy Machinery, Others) |
Regional Analysis/Coverage | North America (US, Canada, Mexico), Europe (Eastern Europe [Poland, Romania, Hungary, Turkey, Rest of Eastern Europe] Western Europe] Germany, France, UK, Italy, Spain, Netherlands, Switzerland, Austria, Rest of Western Europe]), Asia Pacific (China, India, Japan, South Korea, Vietnam, Singapore, Australia, Rest of Asia Pacific), Middle East & Africa (Middle East [UAE, Egypt, Saudi Arabia, Qatar, Rest of Middle East], Africa [Nigeria, South Africa, Rest of Africa], Latin America (Brazil, Argentina, Colombia, Rest of Latin America) |
Company Profiles | Thermo Fisher Scientific Inc., PerkinElmer Inc., Agilent Technologies Inc., Horiba Ltd., Hitachi High-Tech Analytical Science, Bruker Corporation, SPECTRO Analytical Instruments GmbH, Shimadzu Corporation, Analytik Jena AG, GBC Scientific Equipment, Teledyne Leeman Labs, Rigaku Corporation, Spectro Scientific, Oxford Instruments plc, Malvern Panalytical Ltd., Skyray Instrument Inc., Belec Spektrometrie Opto-Elektronik GmbH, Luvata Group, Angstrom Advanced Inc., Qualitest International Inc., and other players. |
Ans: The Optical Emission Spectroscopy Market is expected to grow at a CAGR of 6.26% during 2024-2032.
Ans: The Optical Emission Spectroscopy Market was USD 732.90 million in 2023 and is expected to Reach USD 1261.76 million by 2032.
Ans: Rising Demand for Quality Control and Material Testing in Manufacturing Industries propelling the Optical Emission Spectroscopy Market.
Ans: The “Equipment” segment dominated the Optical Emission Spectroscopy Market.
Ans: North America dominated the Optical Emission Spectroscopy Market in 2023
Table of Contents:
1. Introduction
1.1 Market Definition
1.2 Scope (Inclusion and Exclusions)
1.3 Research Assumptions
2. Executive Summary
2.1 Market Overview
2.2 Regional Synopsis
2.3 Competitive Summary
3. Research Methodology
3.1 Top-Down Approach
3.2 Bottom-up Approach
3.3. Data Validation
3.4 Primary Interviews
4. Market Dynamics Impact Analysis
4.1 Market Driving Factors Analysis
4.1.1 Drivers
4.1.2 Restraints
4.1.3 Opportunities
4.1.4 Challenges
4.2 PESTLE Analysis
4.3 Porter’s Five Forces Model
5. Statistical Insights and Trends Reporting
5.1 Adoption Rate and Industry Utilization (2023)
5.2 Usage Trends by Region (2023)
5.3 OES Equipment Volume, by Region (2020-2032)
5.4 Spending on OES Technology, by Region (Government, Industrial, Private), 2023
5.5 Regulatory and Compliance Trends Impacting OES Adoption (2023-2032)
6. Competitive Landscape
6.1 List of Major Companies, By Region
6.2 Market Share Analysis, By Region
6.3 Product Benchmarking
6.3.1 Product specifications and features
6.3.2 Pricing
6.4 Strategic Initiatives
6.4.1 Marketing and promotional activities
6.4.2 Distribution and Supply Chain Strategies
6.4.3 Expansion plans and new product launches
6.4.4 Strategic partnerships and collaborations
6.5 Technological Advancements
6.6 Market Positioning and Branding
7. Optical Emission Spectroscopy Market Segmentation, By Offering
7.1 Chapter Overview
7.2 Equipment
7.2.1 Equipment Market Trends Analysis (2020-2032)
7.2.2 Equipment Market Size Estimates and Forecasts to 2032 (USD Million)
7.3 Services
7.3.1 Services Market Trends Analysis (2020-2032)
7.3.2 Services Market Size Estimates and Forecasts to 2032 (USD Million)
8. Optical Emission Spectroscopy Market Segmentation, By Form Factor
8.1 Chapter Overview
8.2 Benchtop
8.2.1 Benchtop Market Trends Analysis (2020-2032)
8.2.2 Benchtop Market Size Estimates And Forecasts To 2032 (USD Million)
8.3 Portable
8.3.1 Portable Market Trends Analysis (2020-2032)
8.3.2 Portable Market Size Estimates And Forecasts To 2032 (USD Million)
9. Optical Emission Spectroscopy Market Segmentation, By Product
9.1 Chapter Overview
9.2 Arc/Spark OES
9.2.1 Arc/Spark OES Market Trends Analysis (2020-2032)
9.2.2 Arc/Spark OES Market Size Estimates And Forecasts To 2032 (USD Million)
9.3 ICP-OES (Inductively Coupled Plasma)
9.3.1 ICP-OES (Inductively Coupled Plasma) Market Trends Analysis (2020-2032)
9.3.2 ICP-OES (Inductively Coupled Plasma) Market Size Estimates And Forecasts To 2032 (USD Million)
10. Optical Emission Spectroscopy Market Segmentation, By Detector
10.1 Chapter Overview
10.2 Photomultiplier Tube (PMT)
10.2.1 Photomultiplier Tube (PMT) Market Trends Analysis (2020-2032)
10.2.2 Photomultiplier Tube (PMT) Market Size Estimates And Forecasts To 2032 (USD Million)
10.3 Solid State Detector (SSD)
10.3.1 Solid State Detector (SSD) Market Trends Analysis (2020-2032)
10.3.2 Solid State Detector (SSD) Market Size Estimates And Forecasts To 2032 (USD Million)
10.4 Hybrid
10.4.1 Hybrid Market Trends Analysis (2020-2032)
10.4.2 Hybrid Market Size Estimates And Forecasts To 2032 (USD Million)
11. Optical Emission Spectroscopy Market Segmentation, By Application
11.1 Chapter Overview
11.2 Chemical Composition Analysis
11.2.1 Chemical Composition Analysis Market Trends Analysis (2020-2032)
11.2.2 Chemical Composition Analysis Market Size Estimates And Forecasts To 2032 (USD Million)
11.3 Material Testing and Quality Control
11.3.1 Material Testing and Quality Control Vehicles Market Trends Analysis (2020-2032)
11.3.2 Material Testing and Quality Control Market Size Estimates And Forecasts To 2032 (USD Million)
11.4 Environmental Testing
11.4.1 Environmental Testing Vehicles Market Trends Analysis (2020-2032)
11.4.2 Environmental Testing Market Size Estimates And Forecasts To 2032 (USD Million)
11.5 Research and Development
11.5.1 Research and Development Vehicles Market Trends Analysis (2020-2032)
11.5.2 Research and Development Market Size Estimates And Forecasts To 2032 (USD Million)
12. Optical Emission Spectroscopy Market Segmentation, By End User
12.1 Chapter Overview
12.2 Research and Development
12.2.1 Research and Development Market Trends Analysis (2020-2032)
12.2.2 Research and Development Market Size Estimates And Forecasts To 2032 (USD Million)
12.3 Mining and Exploration
12.3.1 Mining and Exploration Market Trends Analysis (2020-2032)
12.3.2 Mining and Exploration Market Size Estimates And Forecasts To 2032 (USD Million)
12.4 Automotive
12.4.1 Automotive Market Trends Analysis (2020-2032)
12.4.2 Automotive Market Size Estimates And Forecasts To 2032 (USD Million)
12.5 Aerospace and Defense
12.5.1 Aerospace and Defense Market Trends Analysis (2020-2032)
12.5.2 Aerospace and Defense Market Size Estimates And Forecasts To 2032 (USD Million)
12.6 Oil and Gas
12.6.1 Oil and Gas Market Trends Analysis (2020-2032)
12.6.2 Oil and Gas Market Size Estimates And Forecasts To 2032 (USD Million)
12.7 Food and Beverages
12.7.1 Food and Beverages Market Trends Analysis (2020-2032)
12.7.2 Food and Beverages Market Size Estimates And Forecasts To 2032 (USD Million)
12.8 Metals and Heavy Machinery
12.8.1 Metals and Heavy Machinery Market Trends Analysis (2020-2032)
12.8.2 Metals and Heavy Machinery Market Size Estimates And Forecasts To 2032 (USD Million)
12.9 Others
12.9.1 Others Market Trends Analysis (2020-2032)
12.9.2 Others Market Size Estimates And Forecasts To 2032 (USD Million)
13. Regional Analysis
13.1 Chapter Overview
13.2 North America
13.2.1 Trends Analysis
13.2.2 North America Optical Emission Spectroscopy Market Estimates And Forecasts, By Country (2020-2032) (USD Million)
13.2.3 North America Optical Emission Spectroscopy Market Estimates And Forecasts, By Offering (2020-2032) (USD Million)
13.2.4 North America Optical Emission Spectroscopy Market Estimates And Forecasts, By Deployment (2020-2032) (USD Million)
13.2.5 North America Optical Emission Spectroscopy Market Estimates And Forecasts, By Product (2020-2032) (USD Million)
13.2.6 North America Optical Emission Spectroscopy Market Estimates And Forecasts, By Detector (2020-2032) (USD Million)
13.2.7 North America Optical Emission Spectroscopy Market Estimates And Forecasts, By Application (2020-2032) (USD Million)
13.2.8 North America Optical Emission Spectroscopy Market Segmentation, By End User (2020-2032) (USD Million)
13.2.9 USA
13.2.9.1 USA Optical Emission Spectroscopy Market Estimates And Forecasts, By Offering (2020-2032) (USD Million)
13.2.9.2 USA Optical Emission Spectroscopy Market Estimates And Forecasts, By Deployment (2020-2032) (USD Million)
13.2.9.3 USA Optical Emission Spectroscopy Market Estimates And Forecasts, By Product (2020-2032) (USD Million)
13.2.9.4 USA Optical Emission Spectroscopy Market Estimates And Forecasts, By Detector (2020-2032) (USD Million)
13.2.9.5 USA Optical Emission Spectroscopy Market Estimates And Forecasts, By Application (2020-2032) (USD Million)
13.2.9.6 USA Optical Emission Spectroscopy Market Segmentation, By End User (2020-2032) (USD Million)
13.2.10 Canada
13.2.10.1 Canada Optical Emission Spectroscopy Market Estimates And Forecasts, By Offering (2020-2032) (USD Million)
13.2.10.2 Canada Optical Emission Spectroscopy Market Estimates And Forecasts, By Deployment (2020-2032) (USD Million)
13.2.10.3 Canada Optical Emission Spectroscopy Market Estimates And Forecasts, By Product (2020-2032) (USD Million)
13.2.10.4 Canada Optical Emission Spectroscopy Market Estimates And Forecasts, By Detector (2020-2032) (USD Million)
13.2.10.5 Canada Optical Emission Spectroscopy Market Estimates And Forecasts, By Application (2020-2032) (USD Million)
13.2.10.6 Canada Optical Emission Spectroscopy Market Segmentation, By End User (2020-2032) (USD Million)
13.2.11 Mexico
13.2.11.1 Mexico Optical Emission Spectroscopy Market Estimates And Forecasts, By Offering (2020-2032) (USD Million)
13.2.11.2 Mexico Optical Emission Spectroscopy Market Estimates And Forecasts, By Deployment (2020-2032) (USD Million)
13.2.11.3 Mexico Optical Emission Spectroscopy Market Estimates And Forecasts, By Product (2020-2032) (USD Million)
13.2.11.4 Mexico Optical Emission Spectroscopy Market Estimates And Forecasts, By Detector (2020-2032) (USD Million)
13.2.11.5 Mexico Optical Emission Spectroscopy Market Estimates And Forecasts, By Application (2020-2032) (USD Million)
13.2.11.6 Mexico Optical Emission Spectroscopy Market Segmentation, By End User (2020-2032) (USD Million)
13.3 Europe
13.3.1 Eastern Europe
13.3.1.1 Trends Analysis
13.3.1.2 Eastern Europe Optical Emission Spectroscopy Market Estimates And Forecasts, By Country (2020-2032) (USD Million)
13.3.1.3 Eastern Europe Optical Emission Spectroscopy Market Estimates And Forecasts, By Offering (2020-2032) (USD Million)
13.3.1.4 Eastern Europe Optical Emission Spectroscopy Market Estimates And Forecasts, By Deployment (2020-2032) (USD Million)
13.3.1.5 Eastern Europe Optical Emission Spectroscopy Market Estimates And Forecasts, By Product (2020-2032) (USD Million)
13.3.1.6 Eastern Europe Optical Emission Spectroscopy Market Estimates And Forecasts, By Detector (2020-2032) (USD Million)
13.3.1.7 Eastern Europe Optical Emission Spectroscopy Market Estimates And Forecasts, By Application (2020-2032) (USD Million)
13.3.1.8 Eastern Europe Optical Emission Spectroscopy Market Segmentation, By End User (2020-2032) (USD Million)
13.3.1.9 Poland
13.3.1.9.1 Poland Optical Emission Spectroscopy Market Estimates And Forecasts, By Offering (2020-2032) (USD Million)
13.3.1.9.2 Poland Optical Emission Spectroscopy Market Estimates And Forecasts, By Deployment (2020-2032) (USD Million)
13.3.1.9.3 Poland Optical Emission Spectroscopy Market Estimates And Forecasts, By Product (2020-2032) (USD Million)
13.3.1.9.4 Poland Optical Emission Spectroscopy Market Estimates And Forecasts, By Detector (2020-2032) (USD Million)
13.3.1.9.5 Poland Optical Emission Spectroscopy Market Estimates And Forecasts, By Application (2020-2032) (USD Million)
13.3.1.9.6 Poland Optical Emission Spectroscopy Market Segmentation, By End User (2020-2032) (USD Million)
13.3.1.10 Romania
13.3.1.10.1 Romania Optical Emission Spectroscopy Market Estimates And Forecasts, By Offering (2020-2032) (USD Million)
13.3.1.10.2 Romania Optical Emission Spectroscopy Market Estimates And Forecasts, By Deployment (2020-2032) (USD Million)
13.3.1.10.3 Romania Optical Emission Spectroscopy Market Estimates And Forecasts, By Product (2020-2032) (USD Million)
13.3.1.10.4 Romania Optical Emission Spectroscopy Market Estimates And Forecasts, By Detector (2020-2032) (USD Million)
13.3.1.10.5 Romania Optical Emission Spectroscopy Market Estimates And Forecasts, By Application (2020-2032) (USD Million)
13.3.1.10.6 Romania Optical Emission Spectroscopy Market Segmentation, By End User (2020-2032) (USD Million)
13.3.1.11 Hungary
13.3.1.11.1 Hungary Optical Emission Spectroscopy Market Estimates And Forecasts, By Offering (2020-2032) (USD Million)
13.3.1.11.2 Hungary Optical Emission Spectroscopy Market Estimates And Forecasts, By Deployment (2020-2032) (USD Million)
13.3.1.11.3 Hungary Optical Emission Spectroscopy Market Estimates And Forecasts, By Product (2020-2032) (USD Million)
13.3.1.11.4 Hungary Optical Emission Spectroscopy Market Estimates And Forecasts, By Detector (2020-2032) (USD Million)
13.3.1.11.5 Hungary Optical Emission Spectroscopy Market Estimates And Forecasts, By Application (2020-2032) (USD Million)
13.3.1.11.6 Hungary Optical Emission Spectroscopy Market Segmentation, By End User (2020-2032) (USD Million)
13.3.1.12 Turkey
13.3.1.12.1 Turkey Optical Emission Spectroscopy Market Estimates And Forecasts, By Offering (2020-2032) (USD Million)
13.3.1.12.2 Turkey Optical Emission Spectroscopy Market Estimates And Forecasts, By Deployment (2020-2032) (USD Million)
13.3.1.12.3 Turkey Optical Emission Spectroscopy Market Estimates And Forecasts, By Product (2020-2032) (USD Million)
13.3.1.12.4 Turkey Optical Emission Spectroscopy Market Estimates And Forecasts, By Detector (2020-2032) (USD Million)
13.3.1.12.5 Turkey Optical Emission Spectroscopy Market Estimates And Forecasts, By Application (2020-2032) (USD Million)
13.3.1.12.6 Turkey Optical Emission Spectroscopy Market Segmentation, By End User (2020-2032) (USD Million)
13.3.1.13 Rest Of Eastern Europe
13.3.1.13.1 Rest Of Eastern Europe Optical Emission Spectroscopy Market Estimates And Forecasts, By Offering (2020-2032) (USD Million)
13.3.1.13.2 Rest Of Eastern Europe Optical Emission Spectroscopy Market Estimates And Forecasts, By Deployment (2020-2032) (USD Million)
13.3.1.13.3 Rest Of Eastern Europe Optical Emission Spectroscopy Market Estimates And Forecasts, By Product (2020-2032) (USD Million)
13.3.1.13.4 Rest Of Eastern Europe Optical Emission Spectroscopy Market Estimates And Forecasts, By Detector (2020-2032) (USD Million)
13.3.1.13.5 Rest Of Eastern Europe Optical Emission Spectroscopy Market Estimates And Forecasts, By Application (2020-2032) (USD Million)
13.3.1.13.6 Rest Of Eastern Europe Optical Emission Spectroscopy Market Segmentation, By End User (2020-2032) (USD Million)
13.3.2 Western Europe
13.3.2.1 Trends Analysis
13.3.2.2 Western Europe Optical Emission Spectroscopy Market Estimates And Forecasts, By Country (2020-2032) (USD Million)
13.3.2.3 Western Europe Optical Emission Spectroscopy Market Estimates And Forecasts, By Offering (2020-2032) (USD Million)
13.3.2.4 Western Europe Optical Emission Spectroscopy Market Estimates And Forecasts, By Deployment (2020-2032) (USD Million)
13.3.2.5 Western Europe Optical Emission Spectroscopy Market Estimates And Forecasts, By Product (2020-2032) (USD Million)
13.3.2.6 Western Europe Optical Emission Spectroscopy Market Estimates And Forecasts, By Detector (2020-2032) (USD Million)
13.3.2.7 Western Europe Optical Emission Spectroscopy Market Estimates And Forecasts, By Application (2020-2032) (USD Million)
13.3.2.8 Western Europe Optical Emission Spectroscopy Market Segmentation, By End User (2020-2032) (USD Million)
13.3.2.9 Germany
13.3.2.9.1 Germany Optical Emission Spectroscopy Market Estimates And Forecasts, By Offering (2020-2032) (USD Million)
13.3.2.9.2 Germany Optical Emission Spectroscopy Market Estimates And Forecasts, By Deployment(2020-2032) (USD Million)
13.3.2.9.3 Germany Optical Emission Spectroscopy Market Estimates And Forecasts, By Product (2020-2032) (USD Million)
13.3.2.9.4 Germany Optical Emission Spectroscopy Market Estimates And Forecasts, By Detector (2020-2032) (USD Million)
13.3.2.9.5 Germany Optical Emission Spectroscopy Market Estimates And Forecasts, By Application (2020-2032) (USD Million)
13.3.2.9.6 Germany Optical Emission Spectroscopy Market Segmentation, By End User (2020-2032) (USD Million)
13.3.2.10 France
13.3.2.10.1 France Optical Emission Spectroscopy Market Estimates And Forecasts, By Offering (2020-2032) (USD Million)
13.3.2.10.2 France Optical Emission Spectroscopy Market Estimates And Forecasts, By Deployment (2020-2032) (USD Million)
13.3.2.10.3 France Optical Emission Spectroscopy Market Estimates And Forecasts, By Product (2020-2032) (USD Million)
13.3.2.10.4 France Optical Emission Spectroscopy Market Estimates And Forecasts, By Detector (2020-2032) (USD Million)
13.3.2.10.5 France Optical Emission Spectroscopy Market Estimates And Forecasts, By Application (2020-2032) (USD Million)
13.3.2.10.6 France Optical Emission Spectroscopy Market Segmentation, By End User (2020-2032) (USD Million)
13.3.2.11 UK
13.3.2.11.1 UK Optical Emission Spectroscopy Market Estimates And Forecasts, By Offering (2020-2032) (USD Million)
13.3.2.11.2 UK Optical Emission Spectroscopy Market Estimates And Forecasts, By Deployment (2020-2032) (USD Million)
13.3.2.11.3 UK Optical Emission Spectroscopy Market Estimates And Forecasts, By Product (2020-2032) (USD Million)
13.3.2.11.4 UK Optical Emission Spectroscopy Market Estimates And Forecasts, By Detector (2020-2032) (USD Million)
13.3.2.11.5 UK Optical Emission Spectroscopy Market Estimates And Forecasts, By Application (2020-2032) (USD Million)
13.3.2.11.6 UK Optical Emission Spectroscopy Market Segmentation, By End User (2020-2032) (USD Million)
13.3.2.12 Italy
13.3.2.12.1 Italy Optical Emission Spectroscopy Market Estimates And Forecasts, By Offering (2020-2032) (USD Million)
13.3.2.12.2 Italy Optical Emission Spectroscopy Market Estimates And Forecasts, By Deployment (2020-2032) (USD Million)
13.3.2.12.3 Italy Optical Emission Spectroscopy Market Estimates And Forecasts, By Product (2020-2032) (USD Million)
13.3.2.12.4 Italy Optical Emission Spectroscopy Market Estimates And Forecasts, By Detector (2020-2032) (USD Million)
13.3.2.12.5 Italy Optical Emission Spectroscopy Market Estimates And Forecasts, By Application (2020-2032) (USD Million)
13.3.2.12.6 Italy Optical Emission Spectroscopy Market Segmentation, By End User (2020-2032) (USD Million)
13.3.2.13 Spain
13.3.2.13.1 Spain Optical Emission Spectroscopy Market Estimates And Forecasts, By Offering (2020-2032) (USD Million)
13.3.2.13.2 Spain Optical Emission Spectroscopy Market Estimates And Forecasts, By Deployment (2020-2032) (USD Million)
13.3.2.13.3 Spain Optical Emission Spectroscopy Market Estimates And Forecasts, By Product (2020-2032) (USD Million)
13.3.2.13.4 Spain Optical Emission Spectroscopy Market Estimates And Forecasts, By Detector (2020-2032) (USD Million)
13.3.2.13.5 Spain Optical Emission Spectroscopy Market Estimates and Forecasts, By Application (2020-2032) (USD -13824)
13.3.2.13.6 Spain Optical Emission Spectroscopy Market Segmentation, By End User (2020-2032) (USD Million)
13.3.2.14 Netherlands
13.3.2.14.1 Netherlands Optical Emission Spectroscopy Market Estimates and Forecasts, By Offering (2020-2032) (USD Million)
13.3.2.14.2 Netherlands Optical Emission Spectroscopy Market Estimates And Forecasts, By Deployment(2020-2032) (USD Million)
13.3.2.14.3 Netherlands Optical Emission Spectroscopy Market Estimates And Forecasts, By Product (2020-2032) (USD Million)
13.3.2.14.4 Netherlands Optical Emission Spectroscopy Market Estimates And Forecasts, By Detector (2020-2032) (USD Million)
13.3.2.14.5 Netherlands Optical Emission Spectroscopy Market Estimates And Forecasts, By Application (2020-2032) (USD Million)
13.3.2.14.6 Netherlands Optical Emission Spectroscopy Market Segmentation, By End User (2020-2032) (USD Million)
13.3.2.15 Switzerland
13.3.2.15.1 Switzerland Optical Emission Spectroscopy Market Estimates And Forecasts, By Offering (2020-2032) (USD Million)
13.3.2.15.2 Switzerland Optical Emission Spectroscopy Market Estimates And Forecasts, By Deployment (2020-2032) (USD Million)
13.3.2.15.3 Switzerland Optical Emission Spectroscopy Market Estimates And Forecasts, By Product (2020-2032) (USD Million)
13.3.2.15.4 Switzerland Optical Emission Spectroscopy Market Estimates And Forecasts, By Detector (2020-2032) (USD Million)
13.3.2.15.5 Switzerland Optical Emission Spectroscopy Market Estimates And Forecasts, By Application (2020-2032) (USD Million)
13.3.2.15.6 Switzerland Optical Emission Spectroscopy Market Segmentation, By End User (2020-2032) (USD Million)
13.3.2.16 Austria
13.3.2.16.1 Austria Optical Emission Spectroscopy Market Estimates And Forecasts, By Offering (2020-2032) (USD Million)
13.3.2.16.2 Austria Optical Emission Spectroscopy Market Estimates And Forecasts, By Deployment (2020-2032) (USD Million)
13.3.2.16.3 Austria Optical Emission Spectroscopy Market Estimates And Forecasts, By Product (2020-2032) (USD Million)
13.3.2.16.4 Austria Optical Emission Spectroscopy Market Estimates And Forecasts, By Detector (2020-2032) (USD Million)
13.3.2.16.5 Austria Optical Emission Spectroscopy Market Estimates And Forecasts, By Application (2020-2032) (USD Million)
13.3.2.16.6 Austria Optical Emission Spectroscopy Market Segmentation, By End User (2020-2032) (USD Million)
13.3.2.17 Rest Of Western Europe
13.3.2.17.1 Rest Of Western Europe Optical Emission Spectroscopy Market Estimates And Forecasts, By Offering (2020-2032) (USD Million)
13.3.2.17.2 Rest Of Western Europe Optical Emission Spectroscopy Market Estimates And Forecasts, By Deployment (2020-2032) (USD Million)
13.3.2.17.3 Rest Of Western Europe Optical Emission Spectroscopy Market Estimates And Forecasts, By Product (2020-2032) (USD Million)
13.3.2.17.4 Rest Of Western Europe Optical Emission Spectroscopy Market Estimates And Forecasts, By Detector (2020-2032) (USD Million)
13.3.2.17.5 Rest Of Western Europe Optical Emission Spectroscopy Market Estimates And Forecasts, By Application (2020-2032) (USD Million)
13.3.2.17.6 Rest Of Western Europe Optical Emission Spectroscopy Market Segmentation, By End User (2020-2032) (USD Million)
13.4 Asia Pacific
13.4.1 Trends Analysis
13.4.2 Asia Pacific Optical Emission Spectroscopy Market Estimates And Forecasts, By Country (2020-2032) (USD Million)
13.4.3 Asia Pacific Optical Emission Spectroscopy Market Estimates And Forecasts, By Offering (2020-2032) (USD Million)
13.4.4 Asia Pacific Optical Emission Spectroscopy Market Estimates And Forecasts, By Deployment (2020-2032) (USD Million)
13.4.5 Asia Pacific Optical Emission Spectroscopy Market Estimates And Forecasts, By Product (2020-2032) (USD Million)
13.4.6 Asia Pacific Optical Emission Spectroscopy Market Estimates And Forecasts, By Detector (2020-2032) (USD Million)
13.4.7 Asia Pacific Optical Emission Spectroscopy Market Estimates And Forecasts, By Application (2020-2032) (USD Million)
13.4.8 Asia Pacific Optical Emission Spectroscopy Market Segmentation, By End User (2020-2032) (USD Million)
13.4.9 China
13.4.9.1 China Optical Emission Spectroscopy Market Estimates And Forecasts, By Offering (2020-2032) (USD Million)
13.4.9.2 China Optical Emission Spectroscopy Market Estimates And Forecasts, By Deployment (2020-2032) (USD Million)
13.4.9.3 China Optical Emission Spectroscopy Market Estimates And Forecasts, By Product (2020-2032) (USD Million)
13.4.9.4 China Optical Emission Spectroscopy Market Estimates And Forecasts, By Detector (2020-2032) (USD Million)
13.4.9.5 China Optical Emission Spectroscopy Market Estimates And Forecasts, By Application (2020-2032) (USD Million)
13.4.9.6 China Optical Emission Spectroscopy Market Segmentation, By End User (2020-2032) (USD Million)
13.4.10 India
13.4.10.1 India Optical Emission Spectroscopy Market Estimates And Forecasts, By Offering (2020-2032) (USD Million)
13.4.10.2 India Optical Emission Spectroscopy Market Estimates And Forecasts, By Deployment (2020-2032) (USD Million)
13.4.10.3 India Optical Emission Spectroscopy Market Estimates And Forecasts, By Product (2020-2032) (USD Million)
13.4.10.4 India Optical Emission Spectroscopy Market Estimates And Forecasts, By Detector (2020-2032) (USD Million)
13.4.10.5 India Optical Emission Spectroscopy Market Estimates And Forecasts, By Application (2020-2032) (USD Million)
13.4.10.6 India Optical Emission Spectroscopy Market Segmentation, By End User (2020-2032) (USD Million)
13.4.11 Japan
13.4.11.1 Japan Optical Emission Spectroscopy Market Estimates And Forecasts, By Offering (2020-2032) (USD Million)
13.4.11.2 Japan Optical Emission Spectroscopy Market Estimates And Forecasts, By Deployment (2020-2032) (USD Million)
13.4.11.3 Japan Optical Emission Spectroscopy Market Estimates And Forecasts, By Product (2020-2032) (USD Million)
13.4.11.4 Japan Optical Emission Spectroscopy Market Estimates And Forecasts, By Detector (2020-2032) (USD Million)
13.4.11.5 Japan Optical Emission Spectroscopy Market Estimates And Forecasts, By Application (2020-2032) (USD Million)
13.4.11.6 Japan Optical Emission Spectroscopy Market Segmentation, By End User (2020-2032) (USD Million)
13.4.12 South Korea
13.4.12.1 South Korea Optical Emission Spectroscopy Market Estimates And Forecasts, By Offering (2020-2032) (USD Million)
13.4.12.2 South Korea Optical Emission Spectroscopy Market Estimates And Forecasts, By Deployment (2020-2032) (USD Million)
13.4.12.3 South Korea Optical Emission Spectroscopy Market Estimates And Forecasts, By Product (2020-2032) (USD Million)
13.4.12.4 South Korea Optical Emission Spectroscopy Market Estimates And Forecasts, By Detector (2020-2032) (USD Million)
13.4.12.5 South Korea Optical Emission Spectroscopy Market Estimates And Forecasts, By Application (2020-2032) (USD Million)
13.4.12.6 South Korea Optical Emission Spectroscopy Market Segmentation, By End User (2020-2032) (USD Million)
13.4.13 Vietnam
13.4.13.1 Vietnam Optical Emission Spectroscopy Market Estimates And Forecasts, By Offering (2020-2032) (USD Million)
13.4.13.2 Vietnam Optical Emission Spectroscopy Market Estimates And Forecasts, By Deployment (2020-2032) (USD Million)
13.4.13.3 Vietnam Optical Emission Spectroscopy Market Estimates And Forecasts, By Product (2020-2032) (USD Million)
13.4.13.4 Vietnam Optical Emission Spectroscopy Market Estimates And Forecasts, By Detector (2020-2032) (USD Million)
13.4.13.5 Vietnam Optical Emission Spectroscopy Market Estimates And Forecasts, By Application (2020-2032) (USD Million)
13.4.13.6 Vietnam Optical Emission Spectroscopy Market Segmentation, By End User (2020-2032) (USD Million)
13.4.14 Singapore
13.4.14.1 Singapore Optical Emission Spectroscopy Market Estimates And Forecasts, By Offering (2020-2032) (USD Million)
13.4.14.2 Singapore Optical Emission Spectroscopy Market Estimates And Forecasts, By Deployment (2020-2032) (USD Million)
13.4.14.3 Singapore Optical Emission Spectroscopy Market Estimates And Forecasts, By Product (2020-2032) (USD Million)
13.4.14.4 Singapore Optical Emission Spectroscopy Market Estimates And Forecasts, By Detector (2020-2032) (USD Million)
13.4.14.5 Singapore Optical Emission Spectroscopy Market Estimates And Forecasts, By Application (2020-2032) (USD Million)
13.4.14.6 Singapore Optical Emission Spectroscopy Market Segmentation, By End User (2020-2032) (USD Million)
13.4.15 Australia
13.4.15.1 Australia Optical Emission Spectroscopy Market Estimates And Forecasts, By Offering (2020-2032) (USD Million)
13.4.15.2 Australia Optical Emission Spectroscopy Market Estimates And Forecasts, By Deployment (2020-2032) (USD Million)
13.4.15.3 Australia Optical Emission Spectroscopy Market Estimates And Forecasts, By Product (2020-2032) (USD Million)
13.4.15.4 Australia Optical Emission Spectroscopy Market Estimates And Forecasts, By Detector (2020-2032) (USD Million)
13.4.15.5 Australia Optical Emission Spectroscopy Market Estimates And Forecasts, By Application (2020-2032) (USD Million)
13.4.15.6 Australia Optical Emission Spectroscopy Market Segmentation, By End User (2020-2032) (USD Million)
13.4.16 Rest Of Asia Pacific
13.4.16.1 Rest Of Asia Pacific Optical Emission Spectroscopy Market Estimates And Forecasts, By Offering (2020-2032) (USD Million)
13.4.16.2 Rest Of Asia Pacific Optical Emission Spectroscopy Market Estimates And Forecasts, By Deployment (2020-2032) (USD Million)
13.4.16.3 Rest Of Asia Pacific Optical Emission Spectroscopy Market Estimates And Forecasts, By Product (2020-2032) (USD Million)
13.4.16.4 Rest Of Asia Pacific Optical Emission Spectroscopy Market Estimates And Forecasts, By Detector (2020-2032) (USD Million)
13.4.16.5 Rest Of Asia Pacific Optical Emission Spectroscopy Market Estimates And Forecasts, By Application (2020-2032) (USD Million)
13.4.16.6 Rest Of Asia Pacific Optical Emission Spectroscopy Market Segmentation, By End User (2020-2032) (USD Million)
13.5 Middle East And Africa
13.5.1 Middle East
13.5.1.1 Trends Analysis
13.5.1.2 Middle East Optical Emission Spectroscopy Market Estimates And Forecasts, By Country (2020-2032) (USD Million)
13.5.1.3 Middle East Optical Emission Spectroscopy Market Estimates And Forecasts, By Offering (2020-2032) (USD Million)
13.5.1.4 Middle East Optical Emission Spectroscopy Market Estimates And Forecasts, By Deployment(2020-2032) (USD Million)
13.5.1.5 Middle East Optical Emission Spectroscopy Market Estimates And Forecasts, By Product (2020-2032) (USD Million)
13.5.1.6 Middle East Optical Emission Spectroscopy Market Estimates And Forecasts, By Detector (2020-2032) (USD Million)
13.5.1.7 Middle East Optical Emission Spectroscopy Market Estimates And Forecasts, By Application (2020-2032) (USD Million)
13.5.1.8 Middle East Optical Emission Spectroscopy Market Segmentation, By End User (2020-2032) (USD Million)
13.5.1.9 UAE
13.5.1.9.1 UAE Optical Emission Spectroscopy Market Estimates And Forecasts, By Offering (2020-2032) (USD Million)
13.5.1.9.2 UAE Optical Emission Spectroscopy Market Estimates And Forecasts, By Deployment(2020-2032) (USD Million)
13.5.1.9.3 UAE Optical Emission Spectroscopy Market Estimates And Forecasts, By Product (2020-2032) (USD Million)
13.5.1.9.4 UAE Optical Emission Spectroscopy Market Estimates And Forecasts, By Detector (2020-2032) (USD Million)
13.5.1.9.5 UAE Optical Emission Spectroscopy Market Estimates And Forecasts, By Application (2020-2032) (USD Million)
13.5.1.9.6 UAE Optical Emission Spectroscopy Market Segmentation, By End User (2020-2032) (USD Million)
13.5.1.10 Egypt
13.5.1.10.1 Egypt Optical Emission Spectroscopy Market Estimates And Forecasts, By Offering (2020-2032) (USD Million)
13.5.1.10.2 Egypt Optical Emission Spectroscopy Market Estimates And Forecasts, By Deployment (2020-2032) (USD Million)
13.5.1.10.3 Egypt Optical Emission Spectroscopy Market Estimates And Forecasts, By Product (2020-2032) (USD Million)
13.5.1.10.4 Egypt Optical Emission Spectroscopy Market Estimates And Forecasts, By Detector (2020-2032) (USD Million)
13.5.1.10.5 Egypt Optical Emission Spectroscopy Market Estimates And Forecasts, By Application (2020-2032) (USD Million)
13.5.1.10.6 Egypt Optical Emission Spectroscopy Market Segmentation, By End User (2020-2032) (USD Million)
13.5.1.11 Saudi Arabia
13.5.1.10.1 Saudi Arabia Optical Emission Spectroscopy Market Estimates And Forecasts, By Offering (2020-2032) (USD Million)
13.5.1.11.2 Saudi Arabia Optical Emission Spectroscopy Market Estimates And Forecasts, By Deployment (2020-2032) (USD Million)
13.5.1.11.3 Saudi Arabia Optical Emission Spectroscopy Market Estimates And Forecasts, By Product (2020-2032) (USD Million)
13.5.1.11.4 Saudi Arabia Optical Emission Spectroscopy Market Estimates And Forecasts, By Detector (2020-2032) (USD Million)
13.5.1.11.5 Saudi Arabia Optical Emission Spectroscopy Market Estimates And Forecasts, By Application (2020-2032) (USD Million)
13.5.1.11.6 Saudi Arabia Optical Emission Spectroscopy Market Segmentation, By End User (2020-2032) (USD Million)
13.5.1.12 Qatar
13.5.1.12.1 Qatar Optical Emission Spectroscopy Market Estimates And Forecasts, By Offering (2020-2032) (USD Million)
13.5.1.12.2 Qatar Optical Emission Spectroscopy Market Estimates And Forecasts, By Deployment (2020-2032) (USD Million)
13.5.1.12.3 Qatar Optical Emission Spectroscopy Market Estimates And Forecasts, By Product (2020-2032) (USD Million)
13.5.1.12.4 Qatar Optical Emission Spectroscopy Market Estimates And Forecasts, By Detector (2020-2032) (USD Million)
13.5.1.12.5 Qatar Optical Emission Spectroscopy Market Estimates And Forecasts, By Application (2020-2032) (USD Million)
13.5.1.12.6 Qatar Optical Emission Spectroscopy Market Segmentation, By End User (2020-2032) (USD Million)
13.5.1.13 Rest Of Middle East
13.5.1.13.1 Rest Of Middle East Optical Emission Spectroscopy Market Estimates And Forecasts, By Offering (2020-2032) (USD Million)
13.5.1.13.2 Rest Of Middle East Optical Emission Spectroscopy Market Estimates And Forecasts, By Deployment (2020-2032) (USD Million)
13.5.1.13.3 Rest Of Middle East Optical Emission Spectroscopy Market Estimates And Forecasts, By Product (2020-2032) (USD Million)
13.5.1.13.4 Rest Of Middle East Optical Emission Spectroscopy Market Estimates And Forecasts, By Detector (2020-2032) (USD Million)
13.5.1.13.5 Rest Of Middle East Optical Emission Spectroscopy Market Estimates And Forecasts, By Application (2020-2032) (USD Million)
13.5.1.13.6 Rest Of Middle East Optical Emission Spectroscopy Market Segmentation, By End User (2020-2032) (USD Million)
13.5.2 Africa
13.5.2.1 Trends Analysis
13.5.2.2 Africa Optical Emission Spectroscopy Market Estimates And Forecasts, By Country (2020-2032) (USD Million)
13.5.2.3 Africa Optical Emission Spectroscopy Market Estimates And Forecasts, By Offering (2020-2032) (USD Million)
13.5.2.4 Africa Optical Emission Spectroscopy Market Estimates And Forecasts, By Deployment (2020-2032) (USD Million)
13.5.2.5 Africa Optical Emission Spectroscopy Market Estimates And Forecasts, By Product (2020-2032) (USD Million)
13.5.2.6 Africa Optical Emission Spectroscopy Market Estimates And Forecasts, By Detector (2020-2032) (USD Million)
13.5.2.7 Africa Optical Emission Spectroscopy Market Estimates And Forecasts, By Application (2020-2032) (USD Million)
13.5.2.8 Africa Optical Emission Spectroscopy Market Segmentation, By End User (2020-2032) (USD Million)
13.5.2.9 South Africa
13.5.2.9.1 South Africa Optical Emission Spectroscopy Market Estimates And Forecasts, By Offering (2020-2032) (USD Million)
13.5.2.9.2 South Africa Optical Emission Spectroscopy Market Estimates And Forecasts, By Deployment (2020-2032) (USD Million)
13.5.2.9.3 South Africa Optical Emission Spectroscopy Market Estimates And Forecasts, By Product (2020-2032) (USD Million)
13.5.2.9.4 South Africa Optical Emission Spectroscopy Market Estimates And Forecasts, By Detector (2020-2032) (USD Million)
13.5.2.9.5 South Africa Optical Emission Spectroscopy Market Estimates And Forecasts, By Application (2020-2032) (USD Million)
13.5.2.9.6 South Africa Optical Emission Spectroscopy Market Segmentation, By End User (2020-2032) (USD Million)
13.5.2.10 Nigeria
13.5.2.10.1 Nigeria Optical Emission Spectroscopy Market Estimates And Forecasts, By Offering (2020-2032) (USD Million)
13.5.2.10.2 Nigeria Optical Emission Spectroscopy Market Estimates And Forecasts, By Deployment (2020-2032) (USD Million)
13.5.2.10.3 Nigeria Optical Emission Spectroscopy Market Estimates And Forecasts, By Product (2020-2032) (USD Million)
13.5.2.10.4 Nigeria Optical Emission Spectroscopy Market Estimates And Forecasts, By Detector (2020-2032) (USD Million)
13.5.2.10.5 Nigeria Optical Emission Spectroscopy Market Estimates And Forecasts, By Application (2020-2032) (USD Million)
13.5.2.10.6 Nigeria Optical Emission Spectroscopy Market Segmentation, By End User (2020-2032) (USD Million)
13.5.2.11 Rest Of Africa
13.5.2.11.1 Rest Of Africa Optical Emission Spectroscopy Market Estimates And Forecasts, By Offering (2020-2032) (USD Million)
13.5.2.11.2 Rest Of Africa Optical Emission Spectroscopy Market Estimates And Forecasts, By Deployment (2020-2032) (USD Million)
13.5.2.11.3 Rest Of Africa Optical Emission Spectroscopy Market Estimates And Forecasts, By Product (2020-2032) (USD Million)
13.5.2.11.4 Rest Of Africa Optical Emission Spectroscopy Market Estimates And Forecasts, By Detector (2020-2032) (USD Million)
13.5.2.11.5 Rest Of Africa Optical Emission Spectroscopy Market Estimates And Forecasts, By Application (2020-2032) (USD Million)
13.5.2.11.6 Rest Of Africa Optical Emission Spectroscopy Market Segmentation, By End User (2020-2032) (USD Million)
13.6 Latin America
13.6.1 Trends Analysis
13.6.2 Latin America Optical Emission Spectroscopy Market Estimates And Forecasts, By Country (2020-2032) (USD Million)
13.6.3 Latin America Optical Emission Spectroscopy Market Estimates And Forecasts, By Offering (2020-2032) (USD Million)
13.6.4 Latin America Optical Emission Spectroscopy Market Estimates And Forecasts, By Deployment (2020-2032) (USD Million)
13.6.5 Latin America Optical Emission Spectroscopy Market Estimates And Forecasts, By Product (2020-2032) (USD Million)
13.6.6 Latin America Optical Emission Spectroscopy Market Estimates And Forecasts, By Detector (2020-2032) (USD Million)
13.6.7 Latin America Optical Emission Spectroscopy Market Estimates And Forecasts, By Application (2020-2032) (USD Million)
13.6.8 Latin America Optical Emission Spectroscopy Market Segmentation, By End User (2020-2032) (USD Million)
13.6.9 Brazil
13.6.9.1 Brazil Optical Emission Spectroscopy Market Estimates And Forecasts, By Offering (2020-2032) (USD Million)
13.6.9.2 Brazil Optical Emission Spectroscopy Market Estimates And Forecasts, By Deployment (2020-2032) (USD Million)
13.6.9.3 Brazil Optical Emission Spectroscopy Market Estimates And Forecasts, By Product (2020-2032) (USD Million)
13.6.9.4 Brazil Optical Emission Spectroscopy Market Estimates And Forecasts, By Detector (2020-2032) (USD Million)
13.6.9.5 Brazil Optical Emission Spectroscopy Market Estimates And Forecasts, By Application (2020-2032) (USD Million)
13.6.9.6 Brazil Optical Emission Spectroscopy Market Segmentation, By End User (2020-2032) (USD Million)
13.6.10 Argentina
13.6.10.1 Argentina Optical Emission Spectroscopy Market Estimates And Forecasts, By Offering (2020-2032) (USD Million)
13.6.10.2 Argentina Optical Emission Spectroscopy Market Estimates And Forecasts, By Deployment(2020-2032) (USD Million)
13.6.10.3 Argentina Optical Emission Spectroscopy Market Estimates And Forecasts, By Product (2020-2032) (USD Million)
13.6.10.4 Argentina Optical Emission Spectroscopy Market Estimates And Forecasts, By Detector (2020-2032) (USD Million)
13.6.10.5 Argentina Optical Emission Spectroscopy Market Estimates And Forecasts, By Application (2020-2032) (USD Million)
13.6.10.6 Argentina Optical Emission Spectroscopy Market Segmentation, By End User (2020-2032) (USD Million)
13.6.11 Colombia
13.6.11.1 Colombia Optical Emission Spectroscopy Market Estimates And Forecasts, By Offering (2020-2032) (USD Million)
13.6.11.2 Colombia Optical Emission Spectroscopy Market Estimates And Forecasts, By Deployment(2020-2032) (USD Million)
13.6.11.3 Colombia Optical Emission Spectroscopy Market Estimates And Forecasts, By Product (2020-2032) (USD Million)
13.6.11.4 Colombia Optical Emission Spectroscopy Market Estimates And Forecasts, By Detector (2020-2032) (USD Million)
13.6.11.5 Colombia Optical Emission Spectroscopy Market Estimates And Forecasts, By Application (2020-2032) (USD Million)
13.6.11.6 Colombia Optical Emission Spectroscopy Market Segmentation, By End User (2020-2032) (USD Million)
13.6.12 Rest of Latin America
13.6.12.1 Rest of Latin America Optical Emission Spectroscopy Market Estimates And Forecasts, By Offering (2020-2032) (USD Million)
13.6.12.2 Rest of Latin America Optical Emission Spectroscopy Market Estimates And Forecasts, By Deployment(2020-2032) (USD Million)
13.6.12.3 Rest of Latin America Optical Emission Spectroscopy Market Estimates And Forecasts, By Product (2020-2032) (USD Million)
13.6.12.4 Rest of Latin America Optical Emission Spectroscopy Market Estimates And Forecasts, By Detector (2020-2032) (USD Million)
13.6.12.5 Rest of Latin America Optical Emission Spectroscopy Market Estimates And Forecasts, By Application (2020-2032) (USD Million)
13.6.12.6 Rest of Latin America Optical Emission Spectroscopy Market Segmentation, By End User (2020-2032) (USD Million)
14. Company Profiles
14.1 Thermo Fisher Scientific Inc.
14.1.1Company Overview
14.1.2 Financial
14.1.3 Products/ Services Offered
14.1.4 SWOT Analysis
14.2 PerkinElmer Inc.
14.2.1 Company Overview
14.2.2 Financial
14.2.3 Products/ Services Offered
14.2.4 SWOT Analysis
14.3 Agilent Technologies Inc.
14.3.1 Company Overview
14.3.2 Financial
14.3.3 Products/ Services Offered
14.3.4 SWOT Analysis
14.4 Horiba Ltd.
14.4.1 Company Overview
14.4.2 Financial
14.4.3 Products/ Services Offered
14.4.4 SWOT Analysis
14.5 Hitachi High-Tech Analytical Science
14.5.1 Company Overview
14.5.2 Financial
14.5.3 Products/ Services Offered
14.5.4 SWOT Analysis
14.6 Bruker Corporation
14.6.1 Company Overview
14.6.2 Financial
14.6.3 Products/ Services Offered
14.6.4 SWOT Analysis
14.7 SPECTRO Analytical Instruments GmbH
14.7.1 Company Overview
14.7.2 Financial
14.7.3 Products/ Services Offered
14.7.4 SWOT Analysis
14.8 Shimadzu Corporation
14.8.1 Company Overview
14.8.2 Financial
14.8.3 Products/ Services Offered
14.8.4 SWOT Analysis
14.9 Analytik Jena AG
14.9.1 Company Overview
14.9.2 Financial
14.9.3 Products/ Services Offered
14.9.4 SWOT Analysis
14.10 GBC Scientific Equipment
14.10.1 Company Overview
14.10.2 Financial
14.10.3 Products/ Services Offered
14.10.4 SWOT Analysis
15. Use Cases and Best Practices
16. Conclusion
An accurate research report requires proper strategizing as well as implementation. There are multiple factors involved in the completion of good and accurate research report and selecting the best methodology to compete the research is the toughest part. Since the research reports we provide play a crucial role in any company’s decision-making process, therefore we at SNS Insider always believe that we should choose the best method which gives us results closer to reality. This allows us to reach at a stage wherein we can provide our clients best and accurate investment to output ratio.
Each report that we prepare takes a timeframe of 350-400 business hours for production. Starting from the selection of titles through a couple of in-depth brain storming session to the final QC process before uploading our titles on our website we dedicate around 350 working hours. The titles are selected based on their current market cap and the foreseen CAGR and growth.
The 5 steps process:
Step 1: Secondary Research:
Secondary Research or Desk Research is as the name suggests is a research process wherein, we collect data through the readily available information. In this process we use various paid and unpaid databases which our team has access to and gather data through the same. This includes examining of listed companies’ annual reports, Journals, SEC filling etc. Apart from this our team has access to various associations across the globe across different industries. Lastly, we have exchange relationships with various university as well as individual libraries.
Step 2: Primary Research
When we talk about primary research, it is a type of study in which the researchers collect relevant data samples directly, rather than relying on previously collected data. This type of research is focused on gaining content specific facts that can be sued to solve specific problems. Since the collected data is fresh and first hand therefore it makes the study more accurate and genuine.
We at SNS Insider have divided Primary Research into 2 parts.
Part 1 wherein we interview the KOLs of major players as well as the upcoming ones across various geographic regions. This allows us to have their view over the market scenario and acts as an important tool to come closer to the accurate market numbers. As many as 45 paid and unpaid primary interviews are taken from both the demand and supply side of the industry to make sure we land at an accurate judgement and analysis of the market.
This step involves the triangulation of data wherein our team analyses the interview transcripts, online survey responses and observation of on filed participants. The below mentioned chart should give a better understanding of the part 1 of the primary interview.
Part 2: In this part of primary research the data collected via secondary research and the part 1 of the primary research is validated with the interviews from individual consultants and subject matter experts.
Consultants are those set of people who have at least 12 years of experience and expertise within the industry whereas Subject Matter Experts are those with at least 15 years of experience behind their back within the same space. The data with the help of two main processes i.e., FGDs (Focused Group Discussions) and IDs (Individual Discussions). This gives us a 3rd party nonbiased primary view of the market scenario making it a more dependable one while collation of the data pointers.
Step 3: Data Bank Validation
Once all the information is collected via primary and secondary sources, we run that information for data validation. At our intelligence centre our research heads track a lot of information related to the market which includes the quarterly reports, the daily stock prices, and other relevant information. Our data bank server gets updated every fortnight and that is how the information which we collected using our primary and secondary information is revalidated in real time.
Step 4: QA/QC Process
After all the data collection and validation our team does a final level of quality check and quality assurance to get rid of any unwanted or undesired mistakes. This might include but not limited to getting rid of the any typos, duplication of numbers or missing of any important information. The people involved in this process include technical content writers, research heads and graphics people. Once this process is completed the title gets uploader on our platform for our clients to read it.
Step 5: Final QC/QA Process:
This is the last process and comes when the client has ordered the study. In this process a final QA/QC is done before the study is emailed to the client. Since we believe in giving our clients a good experience of our research studies, therefore, to make sure that we do not lack at our end in any way humanly possible we do a final round of quality check and then dispatch the study to the client.
Key Segments:
By Offerings
Equipment
Services
By Form Factor
Benchtop
Portable
By Product
Arc/Spark OES
ICP-OES (Inductively Coupled Plasma)
By Detector
Photomultiplier Tube (PMT)
Solid State Detector (SSD)
Hybrid
By Application
Chemical Composition Analysis
Material Testing and Quality Control
Environmental Testing
Research and Development
By End Use
Metallurgy and Foundries
Mining and Exploration
Automotive
Aerospace and Defense
Oil and Gas
Food and Beverages
Metals and Heavy Machinery
Others
Request for Segment Customization as per your Business Requirement: Segment Customization Request
Regional Coverage:
North America
US
Canada
Mexico
Europe
Eastern Europe
Poland
Romania
Hungary
Turkey
Rest of Eastern Europe
Western Europe
Germany
France
UK
Italy
Spain
Netherlands
Switzerland
Austria
Rest of Western Europe
Asia Pacific
China
India
Japan
South Korea
Vietnam
Singapore
Australia
Rest of Asia Pacific
Middle East & Africa
Middle East
UAE
Egypt
Saudi Arabia
Qatar
Rest of Middle East
Africa
Nigeria
South Africa
Rest of Africa
Latin America
Brazil
Argentina
Colombia
Rest of Latin America
Request for Country Level Research Report: Country Level Customization Request
Available Customization
With the given market data, SNS Insider offers customization as per the company’s specific needs. The following customization options are available for the report:
Detailed Volume Analysis
Criss-Cross segment analysis (e.g. Product X Application)
Competitive Product Benchmarking
Geographic Analysis
Additional countries in any of the regions
Customized Data Representation
Detailed analysis and profiling of additional market players
The Advance Directives Market was valued at USD 122.74 billion in 2023 and is anticipated to reach USD 588.40 billion by 2032 with a CAGR of 19.04% over the forecast period 2024-2032.
The Global Vaccine Market Size valued at USD 74.7 billion in 2023, projected to reach USD 186.5 billion by 2032, with a CAGR of 10.7%.
Artificial Cervical Disc Market was valued at USD 2.43 Bn in 2023 and is expected to reach USD 8.56 Bn by 2032, growing at a CAGR of 15.10% from 2024 to 2032.
The Women’s Wearable Fertility Monitors Market Size was valued at USD 3.02 Billion in 2023, and is expected to reach USD 7.03 Billion by 2032, and grow at a CAGR of 10.34% over the forecast period 2024-2032.
The Hyperphosphatemia Treatment Market Size was valued at USD 1.33 billion in 2023, and is expected to reach USD 2.73 billion by 2032, and grow at a CAGR of 8.3% over the forecast period 2024-2032.
The Oncology Companion Diagnostic Market, valued at USD 4.12 billion in 2023, projected to grow to USD 10.60 billion by 2032 at an 11.09% CAGR.
Hi! Click one of our member below to chat on Phone