Optical Character Recognition Market Report Scope & Overview:
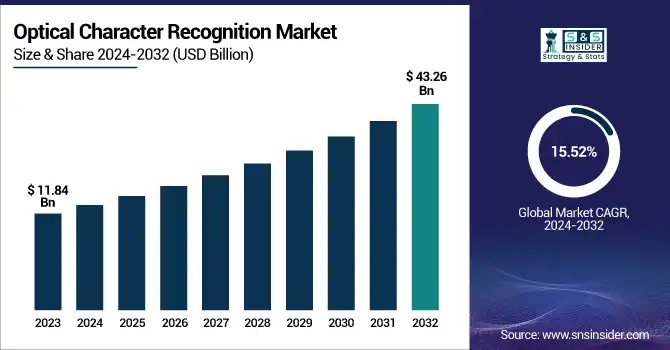
Optical Character Recognition Market was valued at USD 11.84 billion in 2023 and is expected to reach USD 43.26 billion by 2032, growing at a CAGR of 15.52% from 2024-2032
This report includes insights into accuracy improvement trends, highlighting AI-driven enhancements and machine learning models refining OCR precision. It explores the integration with other technologies, such as RPA, cloud computing, and NLP, expanding OCR applications. The report also examines cost reduction statistics, showing how advancements in processing power and open-source solutions lower implementation expenses. Furthermore, it analyzes government vs. private sector demand, revealing increasing adoption in regulatory compliance, digital transformation, and automated data processing across industries. The market's rapid growth is fueled by automation needs, document digitization, and AI-driven analytics, making OCR a critical tool for businesses and governments alike.
U.S. Optical Character Recognition Market was valued at USD 3.33 billion in 2023 and is expected to reach USD 12.14 billion by 2032, growing at a CAGR of 15.44% from 2024-2032
This growth is driven by increasing automation in enterprises, digital transformation initiatives, and rising adoption of AI-powered OCR solutions. The demand for efficient document management, data extraction, and compliance automation in sectors like BFSI, healthcare, and government is accelerating adoption. Additionally, integration with AI, cloud computing, and RPA is enhancing OCR accuracy and scalability. Cost reductions and expanding applications in e-commerce, logistics, and legal sectors further fuel market expansion.
Drivers
Digital Transformation and Automation Driving the Adoption of OCR Technology for Efficient Document Processing Across Industries
The rapid digital transformation across industries is a key factor driving the adoption of Optical Character Recognition (OCR) technology. As businesses seek to streamline operations, OCR enables the automated conversion of paper documents into editable digital formats, significantly reducing manual data entry efforts. This transition helps companies save time, enhance productivity, and minimize human error, all while ensuring faster processing of critical documents. Due to growing dependence on decision-making from data and requirement for real-time information, firms are increasingly deploying OCR systems in order to convert and organize documents digitally. Gains in the fields of e-commerce, documentation required for laws, and paperless business further stimulate the OCR solution demand. All these have helped to contribute toward tremendous growth in the market for OCR.
Restraints
Challenges in Accuracy and Document Quality Limit the Effectiveness of OCR Technology Across Various Industries
In spite of the increasing use of Optical Character Recognition (OCR), there are still some limitations that affect its performance in different industries. OCR software tends to struggle with complex documents, including those with poor handwriting, complex fonts, or low-quality scans. Such problems may result in text recognition inaccuracies, which restrict the technology from delivering accurate results in high-stakes applications. Furthermore, when it comes to handwritten text, torn papers, or faded prints, OCR software can fail to recover accurate data, which can result in errors or omissions. Such accuracy limitations render OCR unreliable in some applications, especially those in healthcare, law, and finance, where data accuracy is essential for processing and decision-making.
Opportunities
AI and Machine Learning Integration Enhancing OCR Accuracy and Expanding Its Applications Across Various Industries
The integration of Artificial Intelligence (AI) and Machine Learning (ML) with Optical Character Recognition (OCR) is unleashing new capabilities and fueling growth in the market. Through the use of AI, OCR systems can achieve much higher accuracy, particularly in identifying complex documents, like handwritten text, multiple fonts, or low-resolution scanned images. Machine learning algorithms enable OCR to learn and adapt to particular document types, enhancing performance over time. This convergence of technologies makes OCR more capable of processing a larger variety of documents, and it can be applied across sectors such as healthcare, law, and finance. As companies and institutions look for faster, automated document processing, the ongoing evolution of AI and ML will make OCR systems more accurate, further driving market uptake and increasing its applications.
Challenges
Data Security and Privacy Concerns Hindering OCR Adoption Due to Compliance and Risk of Data Breaches
With the growing use of Optical Character Recognition (OCR) technology, data security and privacy issues are becoming important barriers. Sensitive data like personal identification details, financial information, or health records are often handled by OCR systems. Consequently, companies need to make sure that such systems meet strict regulatory requirements, including GDPR and HIPAA. Failure to protect this sensitive information can result in serious legal repercussions, including fines and loss of customer confidence. In addition, possible data breaches or unauthorized access to data pose a serious threat to organizations employing OCR technology, especially in highly regulated industries like healthcare, finance, and government. These security issues make it necessary for the creation of stronger and more secure OCR systems to guarantee safe data processing and compliance.
By Type
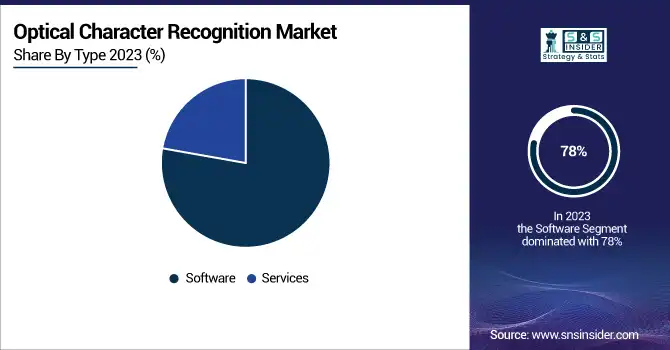
The Software segment dominated the Optical Character Recognition (OCR) market with the highest revenue share of about 78% in 2023 due to the increasing adoption of OCR solutions across various industries. Software-based OCR systems offer advanced features such as document automation, text recognition, and digitalization of paper-based processes, making them essential for businesses looking to enhance efficiency. The demand for these solutions in sectors like healthcare, finance, and legal has contributed to their dominance in the market.
The Services segment is expected to grow at the fastest CAGR of about 17.87% from 2024-2032, driven by the rising demand for customized OCR solutions and system integration. As businesses increasingly adopt OCR technology, the need for professional services, including implementation, support, and consulting, is growing. These services ensure smooth integration with existing systems and help companies optimize OCR applications for specific needs, driving rapid growth in this segment.
By Vertical
The BFSI (Banking, Financial Services, and Insurance) segment dominated the Optical Character Recognition (OCR) market with the highest revenue share of about 26% in 2023. This dominance is due to the extensive use of OCR technology in automating document management, improving operational efficiency, and ensuring compliance with regulatory standards. Banks and financial institutions rely on OCR for processing checks, invoices, contracts, and customer identification, which significantly reduces manual labor, speeds up transactions, and enhances accuracy in data extraction.
The Transport and Logistics segment is expected to grow at the fastest CAGR of about 20.24% from 2024-2032, driven by the increasing need for efficient document handling and automation in supply chain management. OCR technology helps logistics companies automate the processing of shipping labels, invoices, and customs documentation, enhancing speed and reducing human error. As the sector embraces digitalization to improve efficiency and track shipments in real-time, the demand for OCR solutions continues to rise.
By End-use
The BFSI (Banking, Financial Services, and Insurance) segment dominated the Optical Character Recognition (OCR) market with the highest revenue share of about 26% in 2023. This dominance is attributed to the significant reliance of financial institutions on OCR for automating document processing, enhancing operational efficiency, and ensuring compliance with regulations. OCR aids in processing checks, invoices, contracts, and customer identification, improving accuracy and reducing manual labor. Meanwhile, the Transport and Logistics segment is expected to grow at the fastest CAGR of about 20.24% from 2024-2032, driven by the increasing need for automation in supply chain management. OCR technology is helping logistics companies automate the processing of shipping labels, invoices, and customs documentation, improving speed, reducing errors, and optimizing operational workflows, making it a crucial solution for the sector's digital transformation.
Regional Analysis
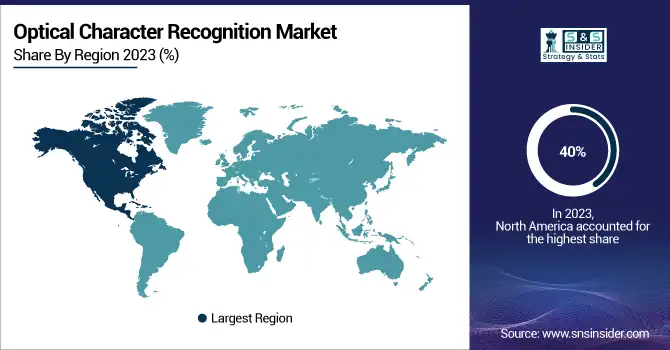
North America dominated the Optical Character Recognition (OCR) market with the highest revenue share of about 40% in 2023. This dominance is primarily due to the early adoption of OCR technology by industries in the region, including healthcare, BFSI, and retail. The region's strong technological infrastructure, high investment in digital transformation, and widespread demand for automation solutions across businesses have led to the extensive use of OCR for document processing, compliance, and data management.
Asia Pacific is expected to grow at the fastest CAGR of about 17.66% from 2024-2032, driven by rapid digital transformation and increasing investments in automation technologies. The growing adoption of OCR in emerging economies like China and India, coupled with the region's expanding e-commerce, logistics, and healthcare sectors, is fueling this growth. The demand for efficient document processing, cost reduction, and enhanced operational efficiency is propelling OCR adoption across various industries in Asia Pacific.
ABBYY: FineReader, FlexiCapture
Adobe: Acrobat Pro DC, Scan
Anyline GmbH: Anyline OCR SDK, Anyline Mobile Scanning App
ATAPY Software: OCR SDK, Document Conversion Services
Captricity Inc.: Captricity Data Capture, ReadAPI
Creaceed S.P.R.L.: Prizmo, Prizmo Go
CVISION Technologies, Inc.: Maestro Recognition Server, PdfCompressor
Exper-OCR, Inc.: ExperVision OCR, TypeReader
Google LLC: Cloud Vision API, Google Drive OCR
International Business Machines Corporation (IBM): Datacap, IBM Content Analyzer
IntSig Information Co., Ltd. Corporation: CamScanner, CamCard
IRIS S.A.: Readiris, IRIScan
LEAD Technologies, Inc.: LEADTOOLS OCR SDK, LEADTOOLS Document Imaging
Microsoft: Azure Computer Vision, OneNote OCR
NAVER Corp.: Clova OCR, Papago
Nuance Communications, Inc.: OmniPage, Power PDF
Open Text Corporation: Capture Center, Document Capture
CME Imaging Solutions: Document Scanning Services, Microfilm Conversion
Rely Services Inc: Data Entry Services, Document Management Solutions
Archive Power Systems, Inc.: Archive Power, DocuPower
Sage Document Services Group LLC: Document Scanning, Digital Conversion
ZYCLYX CONSULTING SERVICES PVT. LTD: OCR Processing, Data Digitization
Anderson Archival: Digital Archiving, OCR Services
KAYMAN VAULTS: Secure Document Storage, OCR-Based Document Management
Scanning America, Inc.: OCR Scanning Services, Document Imaging Solutions
In 2024, ABBYY introduced purpose-built AI capabilities to enhance its document processing solutions, focusing on automation and intelligent data extraction, aiming to improve efficiency and accuracy for businesses worldwide.
In February 2025, Adobe introduced Acrobat AI Assistant, an advanced feature designed to streamline contract review by automating tasks like data extraction, analysis, and providing intelligent suggestions for faster document processing.
Report Attributes | Details |
---|---|
Market Size in 2023 | US$ 11.84 Billion |
Market Size by 2032 | US$ 43.26 Billion |
CAGR | CAGR of 15.52% From 2024 to 2032 |
Base Year | 2023 |
Forecast Period | 2024-2032 |
Historical Data | 2020-2022 |
Report Scope & Coverage | Market Size, Segments Analysis, Competitive Landscape, Regional Analysis, DROC & SWOT Analysis, Forecast Outlook |
Key Segments | • By Type (Software, Services) • By End-use (B2B, B2C) • By Vertical (Retail, BFSI, Government, Transport and Logistics, Healthcare, IT & Telecom, Manufacturing, Others) |
Regional Analysis/Coverage | North America (US, Canada, Mexico), Europe (Eastern Europe [Poland, Romania, Hungary, Turkey, Rest of Eastern Europe] Western Europe] Germany, France, UK, Italy, Spain, Netherlands, Switzerland, Austria, Rest of Western Europe]), Asia Pacific (China, India, Japan, South Korea, Vietnam, Singapore, Australia, Rest of Asia Pacific), Middle East & Africa (Middle East [UAE, Egypt, Saudi Arabia, Qatar, Rest of Middle East], Africa [Nigeria, South Africa, Rest of Africa], Latin America (Brazil, Argentina, Colombia, Rest of Latin America) |
Company Profiles | ABBYY, Adobe, Anyline GmbH, ATAPY Software, Captricity Inc., Creaceed S.P.R.L., CVISION Technologies, Inc., Exper-OCR, Inc., Google LLC, International Business Machines Corporation (IBM), IntSig Information Co., Ltd. Corporation, IRIS S.A., LEAD Technologies, Inc., Microsoft, NAVER Corp., Nuance Communications, Inc., Open Text Corporation, CME Imaging Solutions, Rely Services Inc, Archive Power Systems, Inc., Sage Document Services Group LLC, ZYCLYX CONSULTING SERVICES PVT. LTD, Anderson Archival, KAYMAN VAULTS, Scanning America, Inc. |
ANS: Optical Character Recognition Market was valued at USD 11.84 billion in 2023 and is expected to reach USD 43.26 billion by 2032, growing at a CAGR of 15.52% from 2024-2032
ANS: The Software segment dominated the OCR market in 2023 with a revenue share of about 78%.
ANS: North America led the OCR market with a 40% revenue share in 2023.
ANS: The Services segment is anticipated to grow at the fastest CAGR of 17.87% from 2024-2032.
ANS: The BFSI segment held about 26% of the OCR market revenue share in 2023.
Table of Contents:
1. Introduction
1.1 Market Definition
1.2 Scope (Inclusion and Exclusions)
1.3 Research Assumptions
2. Executive Summary
2.1 Market Overview
2.2 Regional Synopsis
2.3 Competitive Summary
3. Research Methodology
3.1 Top-Down Approach
3.2 Bottom-up Approach
3.3. Data Validation
3.4 Primary Interviews
4. Market Dynamics Impact Analysis
4.1 Market Driving Factors Analysis
4.1.1 Drivers
4.1.2 Restraints
4.1.3 Opportunities
4.1.4 Challenges
4.2 PESTLE Analysis
4.3 Porter’s Five Forces Model
5. Statistical Insights and Trends Reporting
5.1 Accuracy Improvement Trends
5.2 Integration with Other Technologies
5.3 Cost Reduction Statistics
5.4 Government vs. Private Sector Demand
6. Competitive Landscape
6.1 List of Major Companies, By Region
6.2 Market Share Analysis, By Region
6.3 Product Benchmarking
6.3.1 Product specifications and features
6.3.2 Pricing
6.4 Strategic Initiatives
6.4.1 Marketing and promotional activities
6.4.2 Distribution and supply chain strategies
6.4.3 Expansion plans and new product launches
6.4.4 Strategic partnerships and collaborations
6.5 Technological Advancements
6.6 Market Positioning and Branding
7. Optical Character Recognition Market Segmentation, By Type
7.1 Chapter Overview
7.2 Software
7.2.1 Software Market Trends Analysis (2020-2032)
7.2.2 Software Market Size Estimates and Forecasts to 2032 (USD Billion)
7.3 Services
7.3.1 Services Market Trends Analysis (2020-2032)
7.3.2 Services Market Size Estimates and Forecasts to 2032 (USD Billion)
8. Optical Character Recognition Market Segmentation, By End-use
8.1 Chapter Overview
8.2 B2B
8.2.1 B2B Market Trends Analysis (2020-2032)
8.2.2 B2B Market Size Estimates and Forecasts to 2032 (USD Billion)
8.3 B2C
8.3.1 B2C Market Trends Analysis (2020-2032)
8.3.2 B2C Market Size Estimates and Forecasts to 2032 (USD Billion)
9. Optical Character Recognition Market Segmentation, By Vertical
9.1 Chapter Overview
9.2 Retail
9.2.1 Retail Market Trends Analysis (2020-2032)
9.2.2 Retail Market Size Estimates and Forecasts to 2032 (USD Billion)
9.3 BFSI
9.3.1 BFSI Market Trends Analysis (2020-2032)
9.3.2 BFSI Market Size Estimates and Forecasts to 2032 (USD Billion)
9.4 Government
9.4.1 Government Market Trends Analysis (2020-2032)
9.4.2 Government Market Size Estimates and Forecasts to 2032 (USD Billion)
9.5 Transport And Logistics
9.5.1 Transport And Logistics Market Trends Analysis (2020-2032)
9.5.2 Transport And Logistics Market Size Estimates and Forecasts to 2032 (USD Billion)
9.6 Healthcare
9.6.1 Healthcare Market Trends Analysis (2020-2032)
9.6.2 Healthcare Market Size Estimates and Forecasts to 2032 (USD Billion)
9.7 IT & Telecom
9.7.1 IT & Telecom Market Trends Analysis (2020-2032)
9.7.2 IT & Telecom Market Size Estimates and Forecasts to 2032 (USD Billion)
9.8 Manufacturing
9.8.1 Manufacturing Market Trends Analysis (2020-2032)
9.8.2 Manufacturing Market Size Estimates and Forecasts to 2032 (USD Billion)
9.9 Others
9.9.1 Others Market Trends Analysis (2020-2032)
9.9.2 Others Market Size Estimates and Forecasts to 2032 (USD Billion)
10. Regional Analysis
10.1 Chapter Overview
10.2 North America
10.2.1 Trends Analysis
10.2.2 North America Optical Character Recognition Market Estimates and Forecasts, by Country (2020-2032) (USD Billion)
10.2.3 North America Optical Character Recognition Market Estimates and Forecasts, By Type (2020-2032) (USD Billion)
10.2.4 North America Optical Character Recognition Market Estimates and Forecasts, By End-use (2020-2032) (USD Billion)
10.2.5 North America Optical Character Recognition Market Estimates and Forecasts, By Vertical (2020-2032) (USD Billion)
10.2.6 USA
10.2.6.1 USA Optical Character Recognition Market Estimates and Forecasts, By Type (2020-2032) (USD Billion)
10.2.6.2 USA Optical Character Recognition Market Estimates and Forecasts, By End-use (2020-2032) (USD Billion)
10.2.6.3 USA Optical Character Recognition Market Estimates and Forecasts, By Vertical (2020-2032) (USD Billion)
10.2.7 Canada
10.2.7.1 Canada Optical Character Recognition Market Estimates and Forecasts, By Type (2020-2032) (USD Billion)
10.2.7.2 Canada Optical Character Recognition Market Estimates and Forecasts, By End-use (2020-2032) (USD Billion)
10.2.7.3 Canada Optical Character Recognition Market Estimates and Forecasts, By Vertical (2020-2032) (USD Billion)
10.2.8 Mexico
10.2.8.1 Mexico Optical Character Recognition Market Estimates and Forecasts, By Type (2020-2032) (USD Billion)
10.2.8.2 Mexico Optical Character Recognition Market Estimates and Forecasts, By End-use (2020-2032) (USD Billion)
10.2.8.3 Mexico Optical Character Recognition Market Estimates and Forecasts, By Vertical (2020-2032) (USD Billion)
10.3 Europe
10.3.1 Eastern Europe
10.3.1.1 Trends Analysis
10.3.1.2 Eastern Europe Optical Character Recognition Market Estimates and Forecasts, by Country (2020-2032) (USD Billion)
10.3.1.3 Eastern Europe Optical Character Recognition Market Estimates and Forecasts, By Type (2020-2032) (USD Billion)
10.3.1.4 Eastern Europe Optical Character Recognition Market Estimates and Forecasts, By End-use (2020-2032) (USD Billion)
10.3.1.5 Eastern Europe Optical Character Recognition Market Estimates and Forecasts, By Vertical (2020-2032) (USD Billion)
10.3.1.6 Poland
10.3.1.6.1 Poland Optical Character Recognition Market Estimates and Forecasts, By Type (2020-2032) (USD Billion)
10.3.1.6.2 Poland Optical Character Recognition Market Estimates and Forecasts, By End-use (2020-2032) (USD Billion)
10.3.1.6.3 Poland Optical Character Recognition Market Estimates and Forecasts, By Vertical (2020-2032) (USD Billion)
10.3.1.7 Romania
10.3.1.7.1 Romania Optical Character Recognition Market Estimates and Forecasts, By Type (2020-2032) (USD Billion)
10.3.1.7.2 Romania Optical Character Recognition Market Estimates and Forecasts, By End-use (2020-2032) (USD Billion)
10.3.1.7.3 Romania Optical Character Recognition Market Estimates and Forecasts, By Vertical (2020-2032) (USD Billion)
10.3.1.8 Hungary
10.3.1.8.1 Hungary Optical Character Recognition Market Estimates and Forecasts, By Type (2020-2032) (USD Billion)
10.3.1.8.2 Hungary Optical Character Recognition Market Estimates and Forecasts, By End-use (2020-2032) (USD Billion)
10.3.1.8.3 Hungary Optical Character Recognition Market Estimates and Forecasts, By Vertical (2020-2032) (USD Billion)
10.3.1.9 Turkey
10.3.1.9.1 Turkey Optical Character Recognition Market Estimates and Forecasts, By Type (2020-2032) (USD Billion)
10.3.1.9.2 Turkey Optical Character Recognition Market Estimates and Forecasts, By End-use (2020-2032) (USD Billion)
10.3.1.9.3 Turkey Optical Character Recognition Market Estimates and Forecasts, By Vertical (2020-2032) (USD Billion)
10.3.1.10 Rest of Eastern Europe
10.3.1.10.1 Rest of Eastern Europe Optical Character Recognition Market Estimates and Forecasts, By Type (2020-2032) (USD Billion)
10.3.1.10.2 Rest of Eastern Europe Optical Character Recognition Market Estimates and Forecasts, By End-use (2020-2032) (USD Billion)
10.3.1.10.3 Rest of Eastern Europe Optical Character Recognition Market Estimates and Forecasts, By Vertical (2020-2032) (USD Billion)
10.3.2 Western Europe
10.3.2.1 Trends Analysis
10.3.2.2 Western Europe Optical Character Recognition Market Estimates and Forecasts, by Country (2020-2032) (USD Billion)
10.3.2.3 Western Europe Optical Character Recognition Market Estimates and Forecasts, By Type (2020-2032) (USD Billion)
10.3.2.4 Western Europe Optical Character Recognition Market Estimates and Forecasts, By End-use (2020-2032) (USD Billion)
10.3.2.5 Western Europe Optical Character Recognition Market Estimates and Forecasts, By Vertical (2020-2032) (USD Billion)
10.3.2.6 Germany
10.3.2.6.1 Germany Optical Character Recognition Market Estimates and Forecasts, By Type (2020-2032) (USD Billion)
10.3.2.6.2 Germany Optical Character Recognition Market Estimates and Forecasts, By End-use (2020-2032) (USD Billion)
10.3.2.6.3 Germany Optical Character Recognition Market Estimates and Forecasts, By Vertical (2020-2032) (USD Billion)
10.3.2.7 France
10.3.2.7.1 France Optical Character Recognition Market Estimates and Forecasts, By Type (2020-2032) (USD Billion)
10.3.2.7.2 France Optical Character Recognition Market Estimates and Forecasts, By End-use (2020-2032) (USD Billion)
10.3.2.7.3 France Optical Character Recognition Market Estimates and Forecasts, By Vertical (2020-2032) (USD Billion)
10.3.2.8 UK
10.3.2.8.1 UK Optical Character Recognition Market Estimates and Forecasts, By Type (2020-2032) (USD Billion)
10.3.2.8.2 UK Optical Character Recognition Market Estimates and Forecasts, By End-use (2020-2032) (USD Billion)
10.3.2.8.3 UK Optical Character Recognition Market Estimates and Forecasts, By Vertical (2020-2032) (USD Billion)
10.3.2.9 Italy
10.3.2.9.1 Italy Optical Character Recognition Market Estimates and Forecasts, By Type (2020-2032) (USD Billion)
10.3.2.9.2 Italy Optical Character Recognition Market Estimates and Forecasts, By End-use (2020-2032) (USD Billion)
10.3.2.9.3 Italy Optical Character Recognition Market Estimates and Forecasts, By Vertical (2020-2032) (USD Billion)
10.3.2.10 Spain
10.3.2.10.1 Spain Optical Character Recognition Market Estimates and Forecasts, By Type (2020-2032) (USD Billion)
10.3.2.10.2 Spain Optical Character Recognition Market Estimates and Forecasts, By End-use (2020-2032) (USD Billion)
10.3.2.10.3 Spain Optical Character Recognition Market Estimates and Forecasts, By Vertical (2020-2032) (USD Billion)
10.3.2.11 Netherlands
10.3.2.11.1 Netherlands Optical Character Recognition Market Estimates and Forecasts, By Type (2020-2032) (USD Billion)
10.3.2.11.2 Netherlands Optical Character Recognition Market Estimates and Forecasts, By End-use (2020-2032) (USD Billion)
10.3.2.11.3 Netherlands Optical Character Recognition Market Estimates and Forecasts, By Vertical (2020-2032) (USD Billion)
10.3.2.12 Switzerland
10.3.2.12.1 Switzerland Optical Character Recognition Market Estimates and Forecasts, By Type (2020-2032) (USD Billion)
10.3.2.12.2 Switzerland Optical Character Recognition Market Estimates and Forecasts, By End-use (2020-2032) (USD Billion)
10.3.2.12.3 Switzerland Optical Character Recognition Market Estimates and Forecasts, By Vertical (2020-2032) (USD Billion)
10.3.2.13 Austria
10.3.2.13.1 Austria Optical Character Recognition Market Estimates and Forecasts, By Type (2020-2032) (USD Billion)
10.3.2.13.2 Austria Optical Character Recognition Market Estimates and Forecasts, By End-use (2020-2032) (USD Billion)
10.3.2.13.3 Austria Optical Character Recognition Market Estimates and Forecasts, By Vertical (2020-2032) (USD Billion)
10.3.2.14 Rest of Western Europe
10.3.2.14.1 Rest of Western Europe Optical Character Recognition Market Estimates and Forecasts, By Type (2020-2032) (USD Billion)
10.3.2.14.2 Rest of Western Europe Optical Character Recognition Market Estimates and Forecasts, By End-use (2020-2032) (USD Billion)
10.3.2.14.3 Rest of Western Europe Optical Character Recognition Market Estimates and Forecasts, By Vertical (2020-2032) (USD Billion)
10.4 Asia Pacific
10.4.1 Trends Analysis
10.4.2 Asia Pacific Optical Character Recognition Market Estimates and Forecasts, by Country (2020-2032) (USD Billion)
10.4.3 Asia Pacific Optical Character Recognition Market Estimates and Forecasts, By Type (2020-2032) (USD Billion)
10.4.4 Asia Pacific Optical Character Recognition Market Estimates and Forecasts, By End-use (2020-2032) (USD Billion)
10.4.5 Asia Pacific Optical Character Recognition Market Estimates and Forecasts, By Vertical (2020-2032) (USD Billion)
10.4.6 China
10.4.6.1 China Optical Character Recognition Market Estimates and Forecasts, By Type (2020-2032) (USD Billion)
10.4.6.2 China Optical Character Recognition Market Estimates and Forecasts, By End-use (2020-2032) (USD Billion)
10.4.6.3 China Optical Character Recognition Market Estimates and Forecasts, By Vertical (2020-2032) (USD Billion)
10.4.7 India
10.4.7.1 India Optical Character Recognition Market Estimates and Forecasts, By Type (2020-2032) (USD Billion)
10.4.7.2 India Optical Character Recognition Market Estimates and Forecasts, By End-use (2020-2032) (USD Billion)
10.4.7.3 India Optical Character Recognition Market Estimates and Forecasts, By Vertical (2020-2032) (USD Billion)
10.4.8 Japan
10.4.8.1 Japan Optical Character Recognition Market Estimates and Forecasts, By Type (2020-2032) (USD Billion)
10.4.8.2 Japan Optical Character Recognition Market Estimates and Forecasts, By End-use (2020-2032) (USD Billion)
10.4.8.3 Japan Optical Character Recognition Market Estimates and Forecasts, By Vertical (2020-2032) (USD Billion)
10.4.9 South Korea
10.4.9.1 South Korea Optical Character Recognition Market Estimates and Forecasts, By Type (2020-2032) (USD Billion)
10.4.9.2 South Korea Optical Character Recognition Market Estimates and Forecasts, By End-use (2020-2032) (USD Billion)
10.4.9.3 South Korea Optical Character Recognition Market Estimates and Forecasts, By Vertical (2020-2032) (USD Billion)
10.4.10 Vietnam
10.4.10.1 Vietnam Optical Character Recognition Market Estimates and Forecasts, By Type (2020-2032) (USD Billion)
10.4.10.2 Vietnam Optical Character Recognition Market Estimates and Forecasts, By End-use (2020-2032) (USD Billion)
10.4.10.3 Vietnam Optical Character Recognition Market Estimates and Forecasts, By Vertical (2020-2032) (USD Billion)
10.4.11 Singapore
10.4.11.1 Singapore Optical Character Recognition Market Estimates and Forecasts, By Type (2020-2032) (USD Billion)
10.4.11.2 Singapore Optical Character Recognition Market Estimates and Forecasts, By End-use (2020-2032) (USD Billion)
10.4.11.3 Singapore Optical Character Recognition Market Estimates and Forecasts, By Vertical (2020-2032) (USD Billion)
10.4.12 Australia
10.4.12.1 Australia Optical Character Recognition Market Estimates and Forecasts, By Type (2020-2032) (USD Billion)
10.4.12.2 Australia Optical Character Recognition Market Estimates and Forecasts, By End-use (2020-2032) (USD Billion)
10.4.12.3 Australia Optical Character Recognition Market Estimates and Forecasts, By Vertical (2020-2032) (USD Billion)
10.4.13 Rest of Asia Pacific
10.4.13.1 Rest of Asia Pacific Optical Character Recognition Market Estimates and Forecasts, By Type (2020-2032) (USD Billion)
10.4.13.2 Rest of Asia Pacific Optical Character Recognition Market Estimates and Forecasts, By End-use (2020-2032) (USD Billion)
10.4.13.3 Rest of Asia Pacific Optical Character Recognition Market Estimates and Forecasts, By Vertical (2020-2032) (USD Billion)
10.5 Middle East and Africa
10.5.1 Middle East
10.5.1.1 Trends Analysis
10.5.1.2 Middle East Optical Character Recognition Market Estimates and Forecasts, by Country (2020-2032) (USD Billion)
10.5.1.3 Middle East Optical Character Recognition Market Estimates and Forecasts, By Type (2020-2032) (USD Billion)
10.5.1.4 Middle East Optical Character Recognition Market Estimates and Forecasts, By End-use (2020-2032) (USD Billion)
10.5.1.5 Middle East Optical Character Recognition Market Estimates and Forecasts, By Vertical (2020-2032) (USD Billion)
10.5.1.6 UAE
10.5.1.6.1 UAE Optical Character Recognition Market Estimates and Forecasts, By Type (2020-2032) (USD Billion)
10.5.1.6.2 UAE Optical Character Recognition Market Estimates and Forecasts, By End-use (2020-2032) (USD Billion)
10.5.1.6.3 UAE Optical Character Recognition Market Estimates and Forecasts, By Vertical (2020-2032) (USD Billion)
10.5.1.7 Egypt
10.5.1.7.1 Egypt Optical Character Recognition Market Estimates and Forecasts, By Type (2020-2032) (USD Billion)
10.5.1.7.2 Egypt Optical Character Recognition Market Estimates and Forecasts, By End-use (2020-2032) (USD Billion)
10.5.1.7.3 Egypt Optical Character Recognition Market Estimates and Forecasts, By Vertical (2020-2032) (USD Billion)
10.5.1.8 Saudi Arabia
10.5.1.8.1 Saudi Arabia Optical Character Recognition Market Estimates and Forecasts, By Type (2020-2032) (USD Billion)
10.5.1.8.2 Saudi Arabia Optical Character Recognition Market Estimates and Forecasts, By End-use (2020-2032) (USD Billion)
10.5.1.8.3 Saudi Arabia Optical Character Recognition Market Estimates and Forecasts, By Vertical (2020-2032) (USD Billion)
10.5.1.9 Qatar
10.5.1.9.1 Qatar Optical Character Recognition Market Estimates and Forecasts, By Type (2020-2032) (USD Billion)
10.5.1.9.2 Qatar Optical Character Recognition Market Estimates and Forecasts, By End-use (2020-2032) (USD Billion)
10.5.1.9.3 Qatar Optical Character Recognition Market Estimates and Forecasts, By Vertical (2020-2032) (USD Billion)
10.5.1.10 Rest of Middle East
10.5.1.10.1 Rest of Middle East Optical Character Recognition Market Estimates and Forecasts, By Type (2020-2032) (USD Billion)
10.5.1.10.2 Rest of Middle East Optical Character Recognition Market Estimates and Forecasts, By End-use (2020-2032) (USD Billion)
10.5.1.10.3 Rest of Middle East Optical Character Recognition Market Estimates and Forecasts, By Vertical (2020-2032) (USD Billion)
10.5.2 Africa
10.5.2.1 Trends Analysis
10.5.2.2 Africa Optical Character Recognition Market Estimates and Forecasts, by Country (2020-2032) (USD Billion)
10.5.2.3 Africa Optical Character Recognition Market Estimates and Forecasts, By Type (2020-2032) (USD Billion)
10.5.2.4 Africa Optical Character Recognition Market Estimates and Forecasts, By End-use (2020-2032) (USD Billion)
10.5.2.5 Africa Optical Character Recognition Market Estimates and Forecasts, By Vertical (2020-2032) (USD Billion)
10.5.2.6 South Africa
10.5.2.6.1 South Africa Optical Character Recognition Market Estimates and Forecasts, By Type (2020-2032) (USD Billion)
10.5.2.6.2 South Africa Optical Character Recognition Market Estimates and Forecasts, By End-use (2020-2032) (USD Billion)
10.5.2.6.3 South Africa Optical Character Recognition Market Estimates and Forecasts, By Vertical (2020-2032) (USD Billion)
10.5.2.7 Nigeria
10.5.2.7.1 Nigeria Optical Character Recognition Market Estimates and Forecasts, By Type (2020-2032) (USD Billion)
10.5.2.7.2 Nigeria Optical Character Recognition Market Estimates and Forecasts, By End-use (2020-2032) (USD Billion)
10.5.2.7.3 Nigeria Optical Character Recognition Market Estimates and Forecasts, By Vertical (2020-2032) (USD Billion)
10.5.2.8 Rest of Africa
10.5.2.8.1 Rest of Africa Optical Character Recognition Market Estimates and Forecasts, By Type (2020-2032) (USD Billion)
10.5.2.8.2 Rest of Africa Optical Character Recognition Market Estimates and Forecasts, By End-use (2020-2032) (USD Billion)
10.5.2.8.3 Rest of Africa Optical Character Recognition Market Estimates and Forecasts, By Vertical (2020-2032) (USD Billion)
10.6 Latin America
10.6.1 Trends Analysis
10.6.2 Latin America Optical Character Recognition Market Estimates and Forecasts, by Country (2020-2032) (USD Billion)
10.6.3 Latin America Optical Character Recognition Market Estimates and Forecasts, By Type (2020-2032) (USD Billion)
10.6.4 Latin America Optical Character Recognition Market Estimates and Forecasts, By End-use (2020-2032) (USD Billion)
10.6.5 Latin America Optical Character Recognition Market Estimates and Forecasts, By Vertical (2020-2032) (USD Billion)
10.6.6 Brazil
10.6.6.1 Brazil Optical Character Recognition Market Estimates and Forecasts, By Type (2020-2032) (USD Billion)
10.6.6.2 Brazil Optical Character Recognition Market Estimates and Forecasts, By End-use (2020-2032) (USD Billion)
10.6.6.3 Brazil Optical Character Recognition Market Estimates and Forecasts, By Vertical (2020-2032) (USD Billion)
10.6.7 Argentina
10.6.7.1 Argentina Optical Character Recognition Market Estimates and Forecasts, By Type (2020-2032) (USD Billion)
10.6.7.2 Argentina Optical Character Recognition Market Estimates and Forecasts, By End-use (2020-2032) (USD Billion)
10.6.7.3 Argentina Optical Character Recognition Market Estimates and Forecasts, By Vertical (2020-2032) (USD Billion)
10.6.8 Colombia
10.6.8.1 Colombia Optical Character Recognition Market Estimates and Forecasts, By Type (2020-2032) (USD Billion)
10.6.8.2 Colombia Optical Character Recognition Market Estimates and Forecasts, By End-use (2020-2032) (USD Billion)
10.6.8.3 Colombia Optical Character Recognition Market Estimates and Forecasts, By Vertical (2020-2032) (USD Billion)
10.6.9 Rest of Latin America
10.6.9.1 Rest of Latin America Optical Character Recognition Market Estimates and Forecasts, By Type (2020-2032) (USD Billion)
10.6.9.2 Rest of Latin America Optical Character Recognition Market Estimates and Forecasts, By End-use (2020-2032) (USD Billion)
10.6.9.3 Rest of Latin America Optical Character Recognition Market Estimates and Forecasts, By Vertical (2020-2032) (USD Billion)
11. Company Profiles
11.1 ABBYY
11.1.1 Company Overview
11.1.2 Financial
11.1.3 Products/ Services Offered
11.1.4 SWOT Analysis
11.2 Adobe
11.2.1 Company Overview
11.2.2 Financial
11.2.3 Products/ Services Offered
11.2.4 SWOT Analysis
11.3 Anyline GmbH
11.3.1 Company Overview
11.3.2 Financial
11.3.3 Products/ Services Offered
11.3.4 SWOT Analysis
11.4 ATAPY Software
11.4.1 Company Overview
11.4.2 Financial
11.4.3 Products/ Services Offered
11.4.4 SWOT Analysis
11.5 Captricity Inc.
11.5.1 Company Overview
11.5.2 Financial
11.5.3 Products/ Services Offered
11.5.4 SWOT Analysis
11.6 Creaceed S.P.R.L.
11.6.1 Company Overview
11.6.2 Financial
11.6.3 Products/ Services Offered
11.6.4 SWOT Analysis
11.7 CVISION Technologies, Inc.
11.7.1 Company Overview
11.7.2 Financial
11.7.3 Products/ Services Offered
11.7.4 SWOT Analysis
11.8 Exper-OCR, Inc.
11.8.1 Company Overview
11.8.2 Financial
11.8.3 Products/ Services Offered
11.8.4 SWOT Analysis
11.9 Google LLC
11.9.1 Company Overview
11.9.2 Financial
11.9.3 Products/ Services Offered
11.9.4 SWOT Analysis
11.10 International Business Machines Corporation (IBM)
11.10.1 Company Overview
11.10.2 Financial
11.10.3 Products/ Services Offered
11.10.4 SWOT Analysis
12. Use Cases and Best Practices
13. Conclusion
An accurate research report requires proper strategizing as well as implementation. There are multiple factors involved in the completion of good and accurate research report and selecting the best methodology to compete the research is the toughest part. Since the research reports we provide play a crucial role in any company’s decision-making process, therefore we at SNS Insider always believe that we should choose the best method which gives us results closer to reality. This allows us to reach at a stage wherein we can provide our clients best and accurate investment to output ratio.
Each report that we prepare takes a timeframe of 350-400 business hours for production. Starting from the selection of titles through a couple of in-depth brain storming session to the final QC process before uploading our titles on our website we dedicate around 350 working hours. The titles are selected based on their current market cap and the foreseen CAGR and growth.
The 5 steps process:
Step 1: Secondary Research:
Secondary Research or Desk Research is as the name suggests is a research process wherein, we collect data through the readily available information. In this process we use various paid and unpaid databases which our team has access to and gather data through the same. This includes examining of listed companies’ annual reports, Journals, SEC filling etc. Apart from this our team has access to various associations across the globe across different industries. Lastly, we have exchange relationships with various university as well as individual libraries.
Step 2: Primary Research
When we talk about primary research, it is a type of study in which the researchers collect relevant data samples directly, rather than relying on previously collected data. This type of research is focused on gaining content specific facts that can be sued to solve specific problems. Since the collected data is fresh and first hand therefore it makes the study more accurate and genuine.
We at SNS Insider have divided Primary Research into 2 parts.
Part 1 wherein we interview the KOLs of major players as well as the upcoming ones across various geographic regions. This allows us to have their view over the market scenario and acts as an important tool to come closer to the accurate market numbers. As many as 45 paid and unpaid primary interviews are taken from both the demand and supply side of the industry to make sure we land at an accurate judgement and analysis of the market.
This step involves the triangulation of data wherein our team analyses the interview transcripts, online survey responses and observation of on filed participants. The below mentioned chart should give a better understanding of the part 1 of the primary interview.
Part 2: In this part of primary research the data collected via secondary research and the part 1 of the primary research is validated with the interviews from individual consultants and subject matter experts.
Consultants are those set of people who have at least 12 years of experience and expertise within the industry whereas Subject Matter Experts are those with at least 15 years of experience behind their back within the same space. The data with the help of two main processes i.e., FGDs (Focused Group Discussions) and IDs (Individual Discussions). This gives us a 3rd party nonbiased primary view of the market scenario making it a more dependable one while collation of the data pointers.
Step 3: Data Bank Validation
Once all the information is collected via primary and secondary sources, we run that information for data validation. At our intelligence centre our research heads track a lot of information related to the market which includes the quarterly reports, the daily stock prices, and other relevant information. Our data bank server gets updated every fortnight and that is how the information which we collected using our primary and secondary information is revalidated in real time.
Step 4: QA/QC Process
After all the data collection and validation our team does a final level of quality check and quality assurance to get rid of any unwanted or undesired mistakes. This might include but not limited to getting rid of the any typos, duplication of numbers or missing of any important information. The people involved in this process include technical content writers, research heads and graphics people. Once this process is completed the title gets uploader on our platform for our clients to read it.
Step 5: Final QC/QA Process:
This is the last process and comes when the client has ordered the study. In this process a final QA/QC is done before the study is emailed to the client. Since we believe in giving our clients a good experience of our research studies, therefore, to make sure that we do not lack at our end in any way humanly possible we do a final round of quality check and then dispatch the study to the client.
Key Segments:
By Type
Software
Services
By End-use
B2B
B2C
By Vertical
Retail
BFSI
Government
Transport And Logistics
Healthcare
IT & Telecom
Manufacturing
Others
Request for Segment Customization as per your Business Requirement: Segment Customization Request
Regional Coverage:
North America
US
Canada
Mexico
Europe
Eastern Europe
Poland
Romania
Hungary
Turkey
Rest of Eastern Europe
Western Europe
Germany
France
UK
Italy
Spain
Netherlands
Switzerland
Austria
Rest of Western Europe
Asia Pacific
China
India
Japan
South Korea
Vietnam
Singapore
Australia
Rest of Asia Pacific
Middle East & Africa
Middle East
UAE
Egypt
Saudi Arabia
Qatar
Rest of Middle East
Africa
Nigeria
South Africa
Rest of Africa
Latin America
Brazil
Argentina
Colombia
Rest of Latin America
Request for Country Level Research Report: Country Level Customization Request
Available Customization
With the given market data, SNS Insider offers customization as per the company’s specific needs. The following customization options are available for the report:
Detailed Volume Analysis
Criss-Cross segment analysis (e.g. Product X Application)
Competitive Product Benchmarking
Geographic Analysis
Additional countries in any of the regions
Customized Data Representation
Detailed analysis and profiling of additional market players
The DevSecOps Market Size was valued at USD 6.3 billion in 2023, projected to reach USD 45.93 billion by 2032 and grow at a CAGR of 24.7% by 2024-2032.
The Digital Media Market was valued at USD 874.42 billion in 2023 and will reach USD 2648.96 billion by 2032, growing at a CAGR of 13.16% by 2032.
Agriculture Analytics Market was valued at USD 2.36 billion in 2023 and is expected to reach USD 4.92 billion by 2032, growing at a CAGR of 8.55% from 2024-2032.
The Adaptive Learning Market was USD 3.74 Billion in 2023 and is expected to reach USD 22.33 Billion by 2032, growing at a CAGR of 22.01% by 2024-2032.
The Business Process Automation Market size was USD 13.80 billion in 2023 and is expected to Reach USD 38.48 billion by 2032 and grow at a CAGR of 12.10% over the forecast period of 2024-2032.
The Lottery Market was valued at USD 337.0 Billion in 2023 and is expected to reach USD 560.6 Billion by 2032, growing at a CAGR of 5.84% by 2032.
Hi! Click one of our member below to chat on Phone