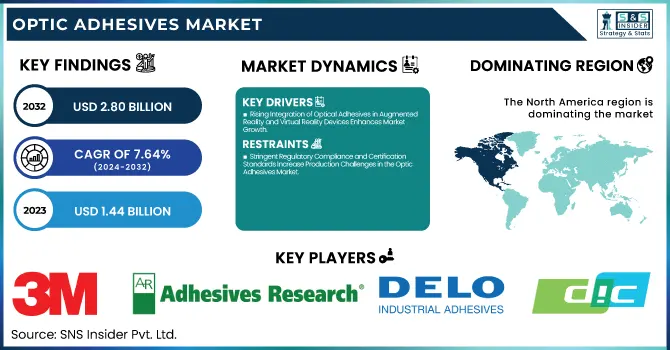
The Optic Adhesives Market Size was valued at USD 1.44 Billion in 2023 and is expected to reach USD 2.80 Billion by 2032, growing at a CAGR of 7.64% over the forecast period of 2024-2032.
To Get more information on Optic Adhesives Market - Request Free Sample Report
The Optic Adhesives Market is evolving with technological advancements, regulatory shifts, and rising industrial demand. Our report explores investment and funding trends, showcasing venture capital inflows and corporate investments driving innovation. A deep dive into patent analysis and intellectual property trends highlights proprietary technologies shaping the competitive landscape. With raw material pricing trends impacting costs, the study examines supply chain dynamics and sourcing strategies. Understanding global and regional regulations, including REACH, ISO, and FDA, is crucial for compliance and market expansion. Additionally, AI-driven predictive maintenance is transforming adhesive longevity and performance optimization. This strategic market analysis equips stakeholders with insights to navigate emerging opportunities and challenges in this rapidly advancing sector.
The US Optic Adhesives Market Size was valued at USD 0.40 Billion in 2023 and is expected to reach USD 0.72 Million by 2032, growing at a CAGR of 6.66% over the forecast period of 2024-2032.
The U.S. Optic Adhesives Market is experiencing significant growth, driven by advancements in telecommunications, consumer electronics, and medical devices. The expansion of 5G infrastructure and the increasing adoption of fiber-optic networks, supported by organizations like the Fiber Broadband Association, are fueling demand. In medical applications, the American Academy of Ophthalmology highlights the growing use of precision adhesives in optical instruments. Additionally, U.S.-based companies like Dymax Corporation and Master Bond Inc. are innovating UV-curable and epoxy-based optic adhesives, enhancing performance in AR/VR, automotive HUDs, and aerospace optics. Stringent FDA and ISO regulations are also pushing manufacturers toward high-quality, compliant solutions, further driving market expansion.
Drivers
Rising Integration of Optical Adhesives in Augmented Reality and Virtual Reality Devices Enhances Market Growth
The increasing adoption of augmented reality (AR) and virtual reality (VR) devices across industries such as gaming, healthcare, automotive, and aerospace is driving the Optic Adhesives Market. These devices require high-performance optical adhesives that provide superior bonding, optical clarity, and durability to ensure optimal functionality. Companies like Meta, Apple, and Microsoft are investing heavily in AR and VR headsets, increasing demand for low-shrinkage, high-refractive-index adhesives that offer environmental resistance and enhanced optical performance. In the automotive industry, the rising adoption of head-up displays (HUDs) and advanced driver-assistance systems (ADAS) has created a growing need for optical adhesives that maintain high optical transparency and mechanical stability. Similarly, medical applications, including surgical visualization systems and endoscopic imaging devices, require precise optical bonding solutions to enhance clarity and performance. The need for UV-curable and epoxy-based optic adhesives is rising due to their fast-curing time and long-term durability, making them essential for cutting-edge AR and VR applications. As technological advancements continue, the demand for high-quality optical adhesives will further accelerate.
Restraints
Stringent Regulatory Compliance and Certification Standards Increase Production Challenges in the Optic Adhesives Market
Manufacturers in the Optic Adhesives Market face stringent regulatory requirements imposed by organizations such as the Food and Drug Administration (FDA), Restriction of Hazardous Substances (RoHS), and Registration, Evaluation, Authorization, and Restriction of Chemicals (REACH). Compliance with ISO 10993 biocompatibility standards for medical adhesives and MIL-SPEC standards for defense applications increases production complexities. These regulations require manufacturers to develop low-toxicity, non-outgassing, and environmentally safe formulations, driving up R&D costs and production lead times. Additionally, optical adhesives used in aerospace and high-precision electronics must meet strict thermal stability, chemical resistance, and optical performance criteria, further complicating product development. The lengthy approval processes for new formulations delay market entry and increase costs, making it difficult for small and mid-sized companies to compete with industry leaders.
Opportunities
Integration of Smart and Adaptive Adhesives Enhances Performance in High-Tech Optical Applications
The development of smart adhesives with self-healing, adaptive refractive index, and thermal-responsive properties is transforming the Optic Adhesives Market. These advanced materials enable dynamic optical adjustments in applications such as photonic circuits, precision lenses, and biomedical imaging. For instance, researchers are designing adhesives that alter refractive properties based on external stimuli like temperature, pressure, or light exposure, optimizing performance in adaptive optics and laser systems. Additionally, nano-engineered adhesive coatings enhance durability, scratch resistance, and chemical stability, making them ideal for fiber-optic components, AR/VR lenses, and military-grade optics. The increasing demand for wearable optical devices, smart contact lenses, and next-generation displays is accelerating the adoption of these intelligent adhesives. Furthermore, self-healing adhesives extend the lifespan of optical assemblies, reducing maintenance costs and improving long-term reliability in high-precision applications. As industries integrate AI-driven automation and nanotechnology, smart adhesives will play a crucial role in advancing optical innovation and expanding market potential.
Challenge
Limited Availability of High-Performance Optical-Grade Adhesives for Extreme Environmental Conditions
The Optic Adhesives Market faces a significant challenge due to the limited availability of ultra-high-performance adhesives that can withstand extreme environmental conditions. Industries such as aerospace, deep-sea exploration, and high-altitude surveillance require adhesives with exceptional optical clarity, mechanical strength, and resistance to thermal fluctuations, radiation, and humidity. However, current formulations often degrade under prolonged exposure to UV radiation, vacuum environments, and cryogenic temperatures, limiting their use in satellites, military optics, and space telescopes. For example, adhesives used in NASA’s space optics must meet low-outgassing and extreme temperature tolerance requirements, making material selection highly restrictive. Developing adhesives with enhanced thermal stability, non-yellowing properties, and prolonged durability is costly and requires advanced R&D investments. Additionally, achieving precise refractive index matching while ensuring chemical inertness remains a major technical challenge. As optical applications expand into harsh environments, the lack of robust, long-lasting adhesive solutions could hinder industry growth, prompting the need for new material innovations and enhanced formulation techniques.
By Resin Type
In 2023, cyanoacrylate adhesives dominated the optic adhesives market, accounting for approximately 30.2% of the market share. Cyanoacrylates, commonly known as super glues, are favored for their rapid curing times and strong bonds, making them ideal for applications requiring quick assembly and high precision. Their ability to bond various substrates, including glass, metal, and plastics, has led to widespread adoption in industries such as electronics, automotive, and medical devices. For instance, in the electronics sector, cyanoacrylate adhesives are used to bond components in smartphones and tablets, enhancing device durability. Additionally, their application in medical devices, such as assembling surgical instruments, underscores their reliability and performance. The versatility and efficiency of cyanoacrylate adhesives have solidified their leading position in the optic adhesives market.
By Application
In 2023, the optical bonding and assembly segment dominated the optic adhesives market, capturing approximately 38.5% of the market share. This dominance is driven by the increasing demand for high-quality displays in consumer electronics, automotive dashboards, and medical devices. Optical bonding enhances display performance by reducing reflections and improving contrast, which is critical for devices like smartphones, tablets, and advanced automotive displays. For example, the integration of optical bonding in automotive head-up displays (HUDs) has improved visibility and safety for drivers. The medical industry also benefits from optical bonding in diagnostic equipment, where clear and accurate displays are essential. The growing emphasis on superior display quality across various sectors has propelled the optical bonding and assembly segment to the forefront of the optic adhesives market.
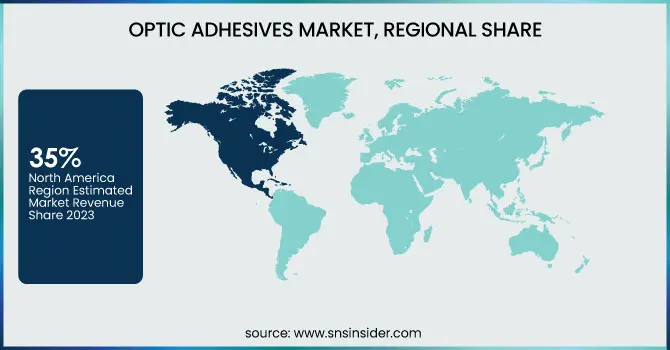
In 2023, North America dominated the optic adhesives market, holding a 35% market share. This leadership is attributed to the region's robust technological advancements and substantial investments in industries such as electronics, automotive, and aerospace. The United States, in particular, has been a significant contributor, driven by the presence of leading companies like 3M and Henkel, which have pioneered innovative adhesive solutions. The U.S. government's support for research and development in advanced materials has further bolstered market growth. For instance, initiatives by the National Science Foundation (NSF) to fund materials science research have facilitated advancements in adhesive technologies. Additionally, the increasing adoption of electric vehicles (EVs) in the U.S. has spurred demand for optic adhesives in automotive applications, such as battery systems and infotainment displays. Canada and Mexico have also contributed to regional growth, with Canada's focus on aerospace manufacturing and Mexico's expanding electronics assembly sector. The combined efforts of these countries have solidified North America's leading position in the optic adhesives market.
During the forecast period, the Asia Pacific region has emerged as the fastest-growing market for optic adhesives, with a significant CAGR. This rapid growth is fueled by the region's expanding electronics manufacturing industry, particularly in countries like China, Japan, and South Korea. China, for instance, has become a global hub for smartphone and consumer electronics production, driving the demand for high-performance adhesives in device assembly. The Chinese government's initiatives, such as the "Made in China 2025" plan, aim to enhance manufacturing capabilities, further boosting the optic adhesives market. Japan's advancements in automotive technologies, including the development of electric and hybrid vehicles, have increased the need for specialized adhesives in automotive electronics. South Korea's leadership in display technologies, particularly in OLED and flexible displays, has also contributed to the rising demand for optic adhesives. Additionally, the growing telecommunications sector in the region, with the rollout of 5G networks, has heightened the need for fiber optic components, where optic adhesives play a crucial role. The confluence of these factors underscores Asia Pacific's position as a rapidly growing market in the optic adhesives industry.
Get Customized Report as per Your Business Requirement - Enquiry Now
Key Players
3M Company (Optically Clear Adhesive 8146, Optically Clear Adhesive 8211)
Adhesives Research, Inc. (ARclear 8932, ARclear 90560)
Atom Adhesives (AA-BOND UV15, AA-BOND 2116)
DELO Industrie Klebstoffe GmbH & Co. KGaA (DELO PHOTOBOND 4468, DELO KATIOBOND AD494)
DIC Corporation (MEIPALAC W-801, MEIPALAC W-829)
Dow Inc. (The Dow Chemical Company) (DOWSIL 3145, DOWSIL 1-4173)
Dymax Corporation (Dymax OP-67-LS, Dymax 921-GEL)
H.B. Fuller Company (UVOCURE 7555, EV OPT 6001)
Henkel AG & Co. KGaA (LOCTITE STYCAST 1265, LOCTITE ABLESTIK 2035SC)
Master Bond Inc. (EP30-2, UV15-7DC)
Momentive Performance Materials Inc. (Silopren LSR 2030, InvisiSil OP2700)
Nan Pao Resins Co., Ltd. (NP UV-2500, NP OP-360)
Nitto Denko Corporation (Nitto 5015N, Nitto 9119)
Panacol-Elosol GmbH (Vitralit 1605, Vitralit UC 6686)
Parson Adhesives India Private Limited (Parson UV-1800, Parson UV-5500)
Resintech Limited (Resintech UVR 5000, Resintech OP-360)
Showa Denko Corporation (SDC Optical Adhesive 1800, SDC Optical Adhesive 2000)
Tesa SE (Tesa 4965, Tesa 51970)
ThreeBond International, Inc. (ThreeBond 3035B, ThreeBond 3930)
Vitrochem Technology Pte Ltd (Vitrobond 2100, Vitrobond 5200)
Recent Developments
December 2023: NIMS researchers in Japan developed a moisture-resistant adhesive inspired by mussels, offering strong bonding in high-humidity environments. This innovation benefits electronics, medical, and marine industries by enhancing adhesive durability and reliability.
Report Attributes | Details |
---|---|
Market Size in 2023 | USD 1.44 Billion |
Market Size by 2032 | USD 2.80 Billion |
CAGR | CAGR of 7.64% From 2024 to 2032 |
Base Year | 2023 |
Forecast Period | 2024-2032 |
Historical Data | 2020-2022 |
Report Scope & Coverage | Market Size, Segments Analysis, Competitive Landscape, Regional Analysis, DROC & SWOT Analysis, Forecast Outlook |
Key Segments | •By Resin Type (Epoxy, Acrylic, Cyanoacrylate, Silicone, Others) •By Application (Optical Bonding & Assembly, Lens Bonding Cement, Fiber Optics, Others) |
Regional Analysis/Coverage | North America (US, Canada, Mexico), Europe (Eastern Europe [Poland, Romania, Hungary, Turkey, Rest of Eastern Europe] Western Europe] Germany, France, UK, Italy, Spain, Netherlands, Switzerland, Austria, Rest of Western Europe]), Asia Pacific (China, India, Japan, South Korea, Vietnam, Singapore, Australia, Rest of Asia Pacific), Middle East & Africa (Middle East [UAE, Egypt, Saudi Arabia, Qatar, Rest of Middle East], Africa [Nigeria, South Africa, Rest of Africa], Latin America (Brazil, Argentina, Colombia, Rest of Latin America) |
Company Profiles | Henkel AG & Co. KGaA, Dymax Corporation, DELO Industrie Klebstoffe GmbH & Co. KGaA, H.B. Fuller Company, The Dow Chemical Company (Dow Inc.), 3M Company, Panacol-Elosol GmbH, DIC Corporation, Master Bond Inc., Tesa SE and other key players |
Ans: The Optic Adhesives Market is expected to grow at a CAGR of 7.64% from 2024 to 2032, reaching USD 2.80 Billion.
Ans: Increasing adoption in AR/VR, automotive HUDs, and medical devices is driving growth in the Optic Adhesives Market.
Ans: Optical bonding and assembly dominated the Optic Adhesives Market, accounting for 38.5% due to rising display technology demand.
Ans: AI-driven predictive maintenance and smart adhesives with adaptive refractive index are transforming the Optic Adhesives Market.
Ans: The Asia Pacific Optic Adhesives Market is expanding due to electronics manufacturing growth in China, Japan, and South Korea.
Table of Contents:
1. Introduction
1.1 Market Definition
1.2 Scope (Inclusion and Exclusions)
1.3 Research Assumptions
2. Executive Summary
2.1 Market Overview
2.2 Regional Synopsis
2.3 Competitive Summary
3. Research Methodology
3.1 Top-Down Approach
3.2 Bottom-up Approach
3.3. Data Validation
3.4 Primary Interviews
4. Market Dynamics Impact Analysis
4.1 Market Driving Factors Analysis
4.1.2 Drivers
4.1.2 Restraints
4.1.3 Opportunities
4.1.4 Challenges
4.2 PESTLE Analysis
4.3 Porter’s Five Forces Model
5. Statistical Insights and Trends Reporting
5.1 Investment & Funding Trends
5.2 Patent Analysis & Intellectual Property Trends
5.3 Raw Material Pricing Trends
5.4 Global and Regional Regulations for Optic Adhesives
5.5 Impact of AI-Driven Predictive Maintenance on Adhesive Longevity
6. Competitive Landscape
6.1 List of Major Companies, By Region
6.2 Market Share Analysis, By Region
6.3 Product Benchmarking
6.3.1 Product specifications and features
6.3.2 Pricing
6.4 Strategic Initiatives
6.4.1 Marketing and promotional activities
6.4.2 Distribution and supply chain strategies
6.4.3 Expansion plans and new product launches
6.4.4 Strategic partnerships and collaborations
6.5 Technological Advancements
6.6 Market Positioning and Branding
7. Optic Adhesives Market Segmentation, by Resin Type
7.1 Chapter Overview
7.2 Epoxy
7.2.1 Epoxy Market Trends Analysis (2020-2032)
7.2.2 Epoxy Market Size Estimates and Forecasts to 2032 (USD Billion)
7.3 Acrylic
7.3.1 Acrylic Market Trends Analysis (2020-2032)
7.3.2 Acrylic Market Size Estimates and Forecasts to 2032 (USD Billion)
7.4 Cyanoacrylate
7.4.1 Cyanoacrylate Market Trends Analysis (2020-2032)
7.4.2 Cyanoacrylate Market Size Estimates and Forecasts to 2032 (USD Billion)
7.5 Silicone
7.5.1 Silicone Market Trends Analysis (2020-2032)
7.5.2 Silicone Market Size Estimates and Forecasts to 2032 (USD Billion)
7.6 Others
7.6.1 Others Market Trends Analysis (2020-2032)
7.6.2 Others Market Size Estimates and Forecasts to 2032 (USD Billion)
8. Optic Adhesives Market Segmentation, by Application
8.1 Chapter Overview
8.2 Optical Bonding & Assembly
8.2.1 Optical Bonding & Assembly Market Trends Analysis (2020-2032)
8.2.2 Optical Bonding & Assembly Market Size Estimates and Forecasts to 2032 (USD Billion)
8.3 Optical Bonding & Assembly
8.3.1 Optical Bonding & Assembly Market Trends Analysis (2020-2032)
8.3.2 Optical Bonding & Assembly Market Size Estimates and Forecasts to 2032 (USD Billion)
8.4 Fiber Optics
8.4.1 Fiber Optics Market Trends Analysis (2020-2032)
8.4.2 Fiber Optics Market Size Estimates and Forecasts to 2032 (USD Billion)
8.5 Others
8.5.1 Others Market Trends Analysis (2020-2032)
8.5.2 Others Market Size Estimates and Forecasts to 2032 (USD Billion)
9. Regional Analysis
9.1 Chapter Overview
9.2 North America
9.2.1 Trends Analysis
9.2.2 North America Optic Adhesives Market Estimates and Forecasts, by Country (2020-2032) (USD Billion)
9.2.3 North America Optic Adhesives Market Estimates and Forecasts, by Resin Type (2020-2032) (USD Billion)
9.2.4 North America Optic Adhesives Market Estimates and Forecasts, by Application (2020-2032) (USD Billion)
9.2.5 USA
9.2.5.1 USA Optic Adhesives Market Estimates and Forecasts, by Resin Type (2020-2032) (USD Billion)
9.2.5.2 USA Optic Adhesives Market Estimates and Forecasts, by Application (2020-2032) (USD Billion)
9.2.6 Canada
9.2.6.1 Canada Optic Adhesives Market Estimates and Forecasts, by Resin Type (2020-2032) (USD Billion)
9.2.6.2 Canada Optic Adhesives Market Estimates and Forecasts, by Application (2020-2032) (USD Billion)
9.2.7 Mexico
9.2.7.1 Mexico Optic Adhesives Market Estimates and Forecasts, by Resin Type (2020-2032) (USD Billion)
9.2.7.2 Mexico Optic Adhesives Market Estimates and Forecasts, by Application (2020-2032) (USD Billion)
9.3 Europe
9.3.1 Eastern Europe
9.3.1.1 Trends Analysis
9.3.1.2 Eastern Europe Optic Adhesives Market Estimates and Forecasts, by Country (2020-2032) (USD Billion)
9.3.1.3 Eastern Europe Optic Adhesives Market Estimates and Forecasts, by Resin Type (2020-2032) (USD Billion)
9.3.1.4 Eastern Europe Optic Adhesives Market Estimates and Forecasts, by Application (2020-2032) (USD Billion)
9.3.1.5 Poland
9.3.1.5.1 Poland Optic Adhesives Market Estimates and Forecasts, by Resin Type (2020-2032) (USD Billion)
9.3.1.5.2 Poland Optic Adhesives Market Estimates and Forecasts, by Application (2020-2032) (USD Billion)
9.3.1.6 Romania
9.3.1.6.1 Romania Optic Adhesives Market Estimates and Forecasts, by Resin Type (2020-2032) (USD Billion)
9.3.1.6.2 Romania Optic Adhesives Market Estimates and Forecasts, by Application (2020-2032) (USD Billion)
9.3.1.7 Hungary
9.3.1.7.1 Hungary Optic Adhesives Market Estimates and Forecasts, by Resin Type (2020-2032) (USD Billion)
9.3.1.7.2 Hungary Optic Adhesives Market Estimates and Forecasts, by Application (2020-2032) (USD Billion)
9.3.1.8 Turkey
9.3.1.8.1 Turkey Optic Adhesives Market Estimates and Forecasts, by Resin Type (2020-2032) (USD Billion)
9.3.1.8.2 Turkey Optic Adhesives Market Estimates and Forecasts, by Application (2020-2032) (USD Billion)
9.3.1.9 Rest of Eastern Europe
9.3.1.9.1 Rest of Eastern Europe Optic Adhesives Market Estimates and Forecasts, by Resin Type (2020-2032) (USD Billion)
9.3.1.9.2 Rest of Eastern Europe Optic Adhesives Market Estimates and Forecasts, by Application (2020-2032) (USD Billion)
9.3.2 Western Europe
9.3.2.1 Trends Analysis
9.3.2.2 Western Europe Optic Adhesives Market Estimates and Forecasts, by Country (2020-2032) (USD Billion)
9.3.2.3 Western Europe Optic Adhesives Market Estimates and Forecasts, by Resin Type (2020-2032) (USD Billion)
9.3.2.4 Western Europe Optic Adhesives Market Estimates and Forecasts, by Application (2020-2032) (USD Billion)
9.3.2.5 Germany
9.3.2.5.1 Germany Optic Adhesives Market Estimates and Forecasts, by Resin Type (2020-2032) (USD Billion)
9.3.2.5.2 Germany Optic Adhesives Market Estimates and Forecasts, by Application (2020-2032) (USD Billion)
9.3.2.6 France
9.3.2.6.1 France Optic Adhesives Market Estimates and Forecasts, by Resin Type (2020-2032) (USD Billion)
9.3.2.6.2 France Optic Adhesives Market Estimates and Forecasts, by Application (2020-2032) (USD Billion)
9.3.2.7 UK
9.3.2.7.1 UK Optic Adhesives Market Estimates and Forecasts, by Resin Type (2020-2032) (USD Billion)
9.3.2.7.2 UK Optic Adhesives Market Estimates and Forecasts, by Application (2020-2032) (USD Billion)
9.3.2.8 Italy
9.3.2.8.1 Italy Optic Adhesives Market Estimates and Forecasts, by Resin Type (2020-2032) (USD Billion)
9.3.2.8.2 Italy Optic Adhesives Market Estimates and Forecasts, by Application (2020-2032) (USD Billion)
9.3.2.9 Spain
9.3.2.9.1 Spain Optic Adhesives Market Estimates and Forecasts, by Resin Type (2020-2032) (USD Billion)
9.3.2.9.2 Spain Optic Adhesives Market Estimates and Forecasts, by Application (2020-2032) (USD Billion)
9.3.2.10 Netherlands
9.3.2.10.1 Netherlands Optic Adhesives Market Estimates and Forecasts, by Resin Type (2020-2032) (USD Billion)
9.3.2.10.2 Netherlands Optic Adhesives Market Estimates and Forecasts, by Application (2020-2032) (USD Billion)
9.3.2.11 Switzerland
9.3.2.11.1 Switzerland Optic Adhesives Market Estimates and Forecasts, by Resin Type (2020-2032) (USD Billion)
9.3.2.11.2 Switzerland Optic Adhesives Market Estimates and Forecasts, by Application (2020-2032) (USD Billion)
9.3.2.12 Austria
9.3.2.12.1 Austria Optic Adhesives Market Estimates and Forecasts, by Resin Type (2020-2032) (USD Billion)
9.3.2.12.2 Austria Optic Adhesives Market Estimates and Forecasts, by Application (2020-2032) (USD Billion)
9.3.2.13 Rest of Western Europe
9.3.2.13.1 Rest of Western Europe Optic Adhesives Market Estimates and Forecasts, by Resin Type (2020-2032) (USD Billion)
9.3.2.13.2 Rest of Western Europe Optic Adhesives Market Estimates and Forecasts, by Application (2020-2032) (USD Billion)
9.4 Asia Pacific
9.4.1 Trends Analysis
9.4.2 Asia Pacific Optic Adhesives Market Estimates and Forecasts, by Country (2020-2032) (USD Billion)
9.4.3 Asia Pacific Optic Adhesives Market Estimates and Forecasts, by Resin Type (2020-2032) (USD Billion)
9.4.4 Asia Pacific Optic Adhesives Market Estimates and Forecasts, by Application (2020-2032) (USD Billion)
9.4.5 China
9.4.5.1 China Optic Adhesives Market Estimates and Forecasts, by Resin Type (2020-2032) (USD Billion)
9.4.5.2 China Optic Adhesives Market Estimates and Forecasts, by Application (2020-2032) (USD Billion)
9.4.6 India
9.4.5.1 India Optic Adhesives Market Estimates and Forecasts, by Resin Type (2020-2032) (USD Billion)
9.4.5.2 India Optic Adhesives Market Estimates and Forecasts, by Application (2020-2032) (USD Billion)
9.4.5 Japan
9.4.5.1 Japan Optic Adhesives Market Estimates and Forecasts, by Resin Type (2020-2032) (USD Billion)
9.4.5.2 Japan Optic Adhesives Market Estimates and Forecasts, by Application (2020-2032) (USD Billion)
9.4.6 South Korea
9.4.6.1 South Korea Optic Adhesives Market Estimates and Forecasts, by Resin Type (2020-2032) (USD Billion)
9.4.6.2 South Korea Optic Adhesives Market Estimates and Forecasts, by Application (2020-2032) (USD Billion)
9.4.7 Vietnam
9.4.7.1 Vietnam Optic Adhesives Market Estimates and Forecasts, by Resin Type (2020-2032) (USD Billion)
9.2.7.2 Vietnam Optic Adhesives Market Estimates and Forecasts, by Application (2020-2032) (USD Billion)
9.4.8 Singapore
9.4.8.1 Singapore Optic Adhesives Market Estimates and Forecasts, by Resin Type (2020-2032) (USD Billion)
9.4.8.2 Singapore Optic Adhesives Market Estimates and Forecasts, by Application (2020-2032) (USD Billion)
9.4.9 Australia
9.4.9.1 Australia Optic Adhesives Market Estimates and Forecasts, by Resin Type (2020-2032) (USD Billion)
9.4.9.2 Australia Optic Adhesives Market Estimates and Forecasts, by Application (2020-2032) (USD Billion)
9.4.10 Rest of Asia Pacific
9.4.10.1 Rest of Asia Pacific Optic Adhesives Market Estimates and Forecasts, by Resin Type (2020-2032) (USD Billion)
9.4.10.2 Rest of Asia Pacific Optic Adhesives Market Estimates and Forecasts, by Application (2020-2032) (USD Billion)
9.5 Middle East and Africa
9.5.1 Middle East
9.5.1.1 Trends Analysis
9.5.1.2 Middle East Optic Adhesives Market Estimates and Forecasts, by Country (2020-2032) (USD Billion)
9.5.1.3 Middle East Optic Adhesives Market Estimates and Forecasts, by Resin Type (2020-2032) (USD Billion)
9.5.1.4 Middle East Optic Adhesives Market Estimates and Forecasts, by Application (2020-2032) (USD Billion)
9.5.1.5 UAE
9.5.1.5.1 UAE Optic Adhesives Market Estimates and Forecasts, by Resin Type (2020-2032) (USD Billion)
9.5.1.5.2 UAE Optic Adhesives Market Estimates and Forecasts, by Application (2020-2032) (USD Billion)
9.5.1.6 Egypt
9.5.1.6.1 Egypt Optic Adhesives Market Estimates and Forecasts, by Resin Type (2020-2032) (USD Billion)
9.5.1.6.2 Egypt Optic Adhesives Market Estimates and Forecasts, by Application (2020-2032) (USD Billion)
9.5.1.7 Saudi Arabia
9.5.1.7.1 Saudi Arabia Optic Adhesives Market Estimates and Forecasts, by Resin Type (2020-2032) (USD Billion)
9.5.1.7.2 Saudi Arabia Optic Adhesives Market Estimates and Forecasts, by Application (2020-2032) (USD Billion)
9.5.1.8 Qatar
9.5.1.8.1 Qatar Optic Adhesives Market Estimates and Forecasts, by Resin Type (2020-2032) (USD Billion)
9.5.1.8.2 Qatar Optic Adhesives Market Estimates and Forecasts, by Application (2020-2032) (USD Billion)
9.5.1.9 Rest of Middle East
9.5.1.9.1 Rest of Middle East Optic Adhesives Market Estimates and Forecasts, by Resin Type (2020-2032) (USD Billion)
9.5.1.9.2 Rest of Middle East Optic Adhesives Market Estimates and Forecasts, by Application (2020-2032) (USD Billion)
9.5.2 Africa
9.5.2.1 Trends Analysis
9.5.2.2 Africa Optic Adhesives Market Estimates and Forecasts, by Country (2020-2032) (USD Billion)
9.5.2.3 Africa Optic Adhesives Market Estimates and Forecasts, by Resin Type (2020-2032) (USD Billion)
9.5.2.4 Africa Optic Adhesives Market Estimates and Forecasts, by Application (2020-2032) (USD Billion)
9.5.2.5 South Africa
9.5.2.5.1 South Africa Optic Adhesives Market Estimates and Forecasts, by Resin Type (2020-2032) (USD Billion)
9.5.2.5.2 South Africa Optic Adhesives Market Estimates and Forecasts, by Application (2020-2032) (USD Billion)
9.5.2.6 Nigeria
9.5.2.6.1 Nigeria Optic Adhesives Market Estimates and Forecasts, by Resin Type (2020-2032) (USD Billion)
9.5.2.6.2 Nigeria Optic Adhesives Market Estimates and Forecasts, by Application (2020-2032) (USD Billion)
9.5.2.7 Rest of Africa
9.5.2.7.1 Rest of Africa Optic Adhesives Market Estimates and Forecasts, by Resin Type (2020-2032) (USD Billion)
9.5.2.7.2 Rest of Africa Optic Adhesives Market Estimates and Forecasts, by Application (2020-2032) (USD Billion)
9.6 Latin America
9.6.1 Trends Analysis
9.6.2 Latin America Optic Adhesives Market Estimates and Forecasts, by Country (2020-2032) (USD Billion)
9.6.3 Latin America Optic Adhesives Market Estimates and Forecasts, by Resin Type (2020-2032) (USD Billion)
9.6.4 Latin America Optic Adhesives Market Estimates and Forecasts, by Application (2020-2032) (USD Billion)
9.6.5 Brazil
9.6.5.1 Brazil Optic Adhesives Market Estimates and Forecasts, by Resin Type (2020-2032) (USD Billion)
9.6.5.2 Brazil Optic Adhesives Market Estimates and Forecasts, by Application (2020-2032) (USD Billion)
9.6.6 Argentina
9.6.6.1 Argentina Optic Adhesives Market Estimates and Forecasts, by Resin Type (2020-2032) (USD Billion)
9.6.6.2 Argentina Optic Adhesives Market Estimates and Forecasts, by Application (2020-2032) (USD Billion)
9.6.7 Colombia
9.6.7.1 Colombia Optic Adhesives Market Estimates and Forecasts, by Resin Type (2020-2032) (USD Billion)
9.6.7.2 Colombia Optic Adhesives Market Estimates and Forecasts, by Application (2020-2032) (USD Billion)
9.6.8 Rest of Latin America
9.6.8.1 Rest of Latin America Optic Adhesives Market Estimates and Forecasts, by Resin Type (2020-2032) (USD Billion)
9.6.8.2 Rest of Latin America Optic Adhesives Market Estimates and Forecasts, by Application (2020-2032) (USD Billion)
10. Company Profiles
10.1 Henkel AG & Co. KGaA
10.1.1 Company Overview
10.1.2 Financial
10.1.3 Products/ Services Offered
110.1.4 SWOT Analysis
10.2 Dymax Corporation
10.2.1 Company Overview
10.2.2 Financial
10.2.3 Products/ Services Offered
10.2.4 SWOT Analysis
10.3 DELO Industrie Klebstoffe GmbH & Co. KGaA
10.3.1 Company Overview
10.3.2 Financial
10.3.3 Products/ Services Offered
10.3.4 SWOT Analysis
10.4 H.B. Fuller Company
10.4.1 Company Overview
10.4.2 Financial
10.4.3 Products/ Services Offered
10.4.4 SWOT Analysis
10.5 The Dow Chemical Company (Dow Inc.)
10.5.1 Company Overview
10.5.2 Financial
10.5.3 Products/ Services Offered
10.5.4 SWOT Analysis
10.6 3M Company
10.6.1 Company Overview
10.6.2 Financial
10.6.3 Products/ Services Offered
10.6.4 SWOT Analysis
10.7 Panacol-Elosol GmbH
10.7.1 Company Overview
10.7.2 Financial
10.7.3 Products/ Services Offered
10.7.4 SWOT Analysis
10.8 DIC Corporation
10.8.1 Company Overview
10.8.2 Financial
10.8.3 Products/ Services Offered
10.8.4 SWOT Analysis
10.9 Master Bond Inc.
10.9.1 Company Overview
10.9.2 Financial
10.9.3 Products/ Services Offered
10.9.4 SWOT Analysis
10.10 Tesa SE
10.9.1 Company Overview
10.9.2 Financial
10.9.3 Products/ Services Offered
10.9.4 SWOT Analysis
11. Use Cases and Best Practices
12. Conclusion
An accurate research report requires proper strategizing as well as implementation. There are multiple factors involved in the completion of good and accurate research report and selecting the best methodology to compete the research is the toughest part. Since the research reports we provide play a crucial role in any company’s decision-making process, therefore we at SNS Insider always believe that we should choose the best method which gives us results closer to reality. This allows us to reach at a stage wherein we can provide our clients best and accurate investment to output ratio.
Each report that we prepare takes a timeframe of 350-400 business hours for production. Starting from the selection of titles through a couple of in-depth brain storming session to the final QC process before uploading our titles on our website we dedicate around 350 working hours. The titles are selected based on their current market cap and the foreseen CAGR and growth.
The 5 steps process:
Step 1: Secondary Research:
Secondary Research or Desk Research is as the name suggests is a research process wherein, we collect data through the readily available information. In this process we use various paid and unpaid databases which our team has access to and gather data through the same. This includes examining of listed companies’ annual reports, Journals, SEC filling etc. Apart from this our team has access to various associations across the globe across different industries. Lastly, we have exchange relationships with various university as well as individual libraries.
Step 2: Primary Research
When we talk about primary research, it is a type of study in which the researchers collect relevant data samples directly, rather than relying on previously collected data. This type of research is focused on gaining content specific facts that can be sued to solve specific problems. Since the collected data is fresh and first hand therefore it makes the study more accurate and genuine.
We at SNS Insider have divided Primary Research into 2 parts.
Part 1 wherein we interview the KOLs of major players as well as the upcoming ones across various geographic regions. This allows us to have their view over the market scenario and acts as an important tool to come closer to the accurate market numbers. As many as 45 paid and unpaid primary interviews are taken from both the demand and supply side of the industry to make sure we land at an accurate judgement and analysis of the market.
This step involves the triangulation of data wherein our team analyses the interview transcripts, online survey responses and observation of on filed participants. The below mentioned chart should give a better understanding of the part 1 of the primary interview.
Part 2: In this part of primary research the data collected via secondary research and the part 1 of the primary research is validated with the interviews from individual consultants and subject matter experts.
Consultants are those set of people who have at least 12 years of experience and expertise within the industry whereas Subject Matter Experts are those with at least 15 years of experience behind their back within the same space. The data with the help of two main processes i.e., FGDs (Focused Group Discussions) and IDs (Individual Discussions). This gives us a 3rd party nonbiased primary view of the market scenario making it a more dependable one while collation of the data pointers.
Step 3: Data Bank Validation
Once all the information is collected via primary and secondary sources, we run that information for data validation. At our intelligence centre our research heads track a lot of information related to the market which includes the quarterly reports, the daily stock prices, and other relevant information. Our data bank server gets updated every fortnight and that is how the information which we collected using our primary and secondary information is revalidated in real time.
Step 4: QA/QC Process
After all the data collection and validation our team does a final level of quality check and quality assurance to get rid of any unwanted or undesired mistakes. This might include but not limited to getting rid of the any typos, duplication of numbers or missing of any important information. The people involved in this process include technical content writers, research heads and graphics people. Once this process is completed the title gets uploader on our platform for our clients to read it.
Step 5: Final QC/QA Process:
This is the last process and comes when the client has ordered the study. In this process a final QA/QC is done before the study is emailed to the client. Since we believe in giving our clients a good experience of our research studies, therefore, to make sure that we do not lack at our end in any way humanly possible we do a final round of quality check and then dispatch the study to the client.
Key Segments:
By Resin Type
Epoxy
Acrylic
Cyanoacrylate
Silicone
Others
By Application
Optical Bonding & Assembly
Lens Bonding Cement
Fiber Optics
Others
Request for Segment Customization as per your Business Requirement: Segment Customization Request
Regional Coverage:
North America
US
Canada
Mexico
Europe
Eastern Europe
Poland
Romania
Hungary
Turkey
Rest of Eastern Europe
Western Europe
Germany
France
UK
Italy
Spain
Netherlands
Switzerland
Austria
Rest of Western Europe
Asia Pacific
China
India
Japan
South Korea
Vietnam
Singapore
Australia
Rest of Asia Pacific
Middle East & Africa
Middle East
UAE
Egypt
Saudi Arabia
Qatar
Rest of Middle East
Africa
Nigeria
South Africa
Rest of Africa
Latin America
Brazil
Argentina
Colombia
Rest of Latin America
Request for Country Level Research Report: Country Level Customization Request
Available Customization
With the given market data, SNS Insider offers customization as per the company’s specific needs. The following customization options are available for the report:
Detailed Volume Analysis
Criss-Cross segment analysis (e.g. Product X Application)
Competitive Product Benchmarking
Geographic Analysis
Additional countries in any of the regions
Customized Data Representation
Detailed analysis and profiling of additional market players
The Green Steel Market Size was valued at USD 2.53 billion in 2023, and is expected to reach USD 141.67 billion by 2032, and grow at a CAGR of 56.48% over the forecast period 2024-2032.
The Battery Coating Market Size was valued at USD 325 million in 2023 and is expected to reach USD 1130 million by 2032 and grow at a CAGR of 14.8% over the forecast period 2024-2032.
Silicone Fabrics Market size was USD 4.7 billion in 2023 and is expected to reach USD 8.5 billion by 2032, growing at a CAGR of 6.8% from 2024 to 2032.
The Anticoagulant Rodenticides Market size was USD 729.87 million in 2023 and is expected to reach USD 992.99 million by 2032 and grow at a CAGR of 3.48% over the forecast period of 2024-2032.
The Ultrapure Water Market Size was valued at USD 8.8 billion in 2023, and is expected to reach USD 18.2 billion by 2032, and grow at a CAGR of 8.5% over the forecast period 2024-2032.
The Rodenticides market size was valued at USD 5.52 billion in 2023 and is expected to reach USD 9.10 billion by 2032, growing at a CAGR of 5.72% over the forecast period of 2024-2032.
Hi! Click one of our member below to chat on Phone