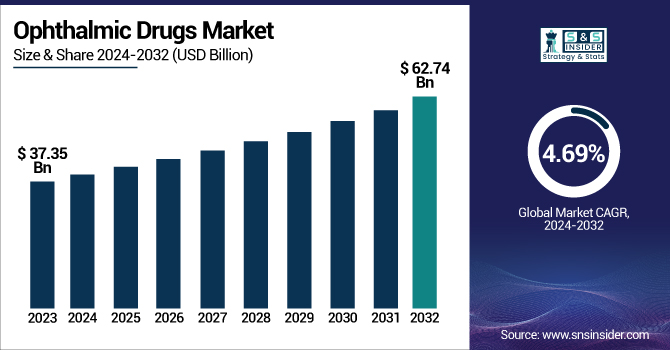
The Ophthalmic Drugs Market size was valued at USD 37.35 billion in 2023 and is expected to reach USD 62.74 billion by 2032, growing at a CAGR of 6.75% during 2024-2032.
To Get more information on Ophthalmic Drugs Market - Request Free Sample Report
Ophthalmic drugs are in high demand due to the rising prevalence of eye diseases, such as cataracts, glaucoma, and macular degeneration, coupled with advancements in drug delivery systems and increasing public awareness of eye health. Factors, including an aging population and changing lifestyles, are also contributing to the increased demand for these medications.
For instance, according to the American Academy of Ophthalmology, 16 million Americans are diagnosed with dry eye.
Recent developments, such as Miebo (perfluorohexyloctane ophthalmic solution) by Bausch & Lomb, are the first FDA-approved prescription medication for dry eye associated with Meibomian gland dysfunction, driving the global ophthalmic drugs market growth.
In 2023, the ophthalmic drugs industry witnessed tremendous growth with a record 12 approvals made by the FDA. Apart from these approvals, some ophthalmic drug companies were also issued Complete Response Letters (CRLs) by the agency.
The U.S. ophthalmic drugs market valuation was USD 14.06 billion in 2023 and is expected to reach USD 23.11 billion by 2032, growing at a CAGR of 6.46% during 2024-2032.
The U.S. leads the North American ophthalmic drugs market because of its well-developed healthcare infrastructure, high healthcare expenditure, and high incidence of eye diseases. The pharmaceutical strength of the country, high investment in R&D, and presence of top ophthalmic drug companies also increase its market dominance. Moreover, the rising geriatric population and growing awareness of eye care add to the dominance of the U.S. in the market.
Drivers:
Nanotechnology-based Ocular Drug Delivery Systems are Driving the Market Growth
The carriers deliver drugs to the site of action, enhance solubility and stability, prolong release, and reduce side effects. In the recent two decades, this technique has emerged as a potential system for bypassing ocular barriers and increasing the bioavailability of drugs. A few nanocarriers are approved by the FDA and are already commercially available for application in the clinical treatment of ocular disease.
For instance, according to MDPI, Ocular nanotechnology-based drug delivery is a focused technique for the precise delivery of therapeutic agents to the eye via nanoscale carriers or systems.
Rising Prevalence of Eye Disorders to Propel Market Expansion
According to the WHO, more than 2.2 billion people have some degree of near or distance vision impairment globally. Importantly, at least 1 billion of these instances, nearly 50%, were preventable or remain to be treated. The main reasons for distance vision impairment or blindness in this group are cataract (94 million), refractive error (88.4 million), age-related macular degeneration (8 million), glaucoma (7.7 million), and diabetic retinopathy (3.9 million). Presbyopia is recognized as the primary cause of near vision blindness, which plagues about 826 million people globally.
There are also wide variations in regions; distance vision blindness has been estimated to be four times greater among low- and middle-income regions than in high-income areas. For near vision impairment, over 80% of the cases in western, eastern, and central sub-Saharan Africa go undiagnosed, while in high-income regions like North America, Australasia, Western Europe, and Asia-Pacific, it is below 10% only. Such variations, together with global population growth and the ever-growing elderly population, will tend to raise the risk of vision impairment over the next few years.
Restraints:
Stringent Regulatory Approval Processes May Impede Ophthalmic Drugs Market Growth
In the U.S., medical device approval is regulated by the Food and Drug Administration (FDA), which itself has frequently been criticized over its regulatory processes, albeit for instances of delays and slower processing times when compared with other industrialized nations. In Japan, the Pharmaceutical and Medical Devices Agency (PMDA) regulates medical device approvals, utilizing evidentiary standards and processes that highly resemble those of the FDA.
By Class
In 2023, the Anti-VEGF agents segment held the dominant ophthalmic drugs market share of 32.15%. The agents operate by preventing the action of Vascular Endothelial Growth Factor (VEGF), a protein that causes the abnormal development of blood vessels. Anti-VEGF medications are commonly applied in the therapy of retinal diseases, such as age-related macular degeneration (AMD) and diabetic retinopathy, in which abnormal vascular growth and leakage lead to visual impairment. Through inhibition of VEGF binding to its receptors, these drugs effectively prevent the pathological angiogenesis and vascular permeability of these diseases.
Anti-glaucoma is anticipated to exhibit the fastest growth throughout the forecast period as anti-glaucoma medications are given either orally or topically, each mode having unique side effect profiles. Oral preparations are linked to systemic side effects, including depression, gastrointestinal upset, metabolic acidosis, metallic taste, and weakness, depending on the drug in question. On the other hand, topical preparations frequently result in local side effects, such as dry eyes, burning or stinging, tearing, and contact allergy.
By Disease
The retinal disorder segment dominated the market with a 36.11% share in 2023 because of changing lifestyle, aging, and the prevalence of chronic diseases. According to Ocular Therapeutix, it is estimated that about 401.6 million people worldwide are suffering from any type of retinal disease. Most of them can lead to loss of vision or serious visual impairment, disrupting visual acuity and seriously degrading the quality of life of a person. Of the many retinal diseases, age-related macular degeneration (AMD) and diabetic eye disease are the most common, together responsible for 42.4% of all retinal disease in the U.S. These diseases are the most common causes of vision loss and blindness and are assuming greater clinical significance with the aging world population and increasing incidence of diabetes.
Infection segments are anticipated to experience the fastest growth over the forecast period, as ophthalmic anti-infectives are medications specifically formulated for application or instillation into the eye to treat ocular infections. These products are available in various forms, including eye drops, gels, and ointments. Anti-infective agents work by either eliminating the infectious organism or inhibiting its ability to spread. They encompass a broad range of drug classes, such as antibiotics, antibacterials, antifungals, antivirals, and antiprotozoals.
By Route of Administration
The topical segment dominated the market with a 64.13% share in 2023. The segment’s dominance is attributed to the ability of topically applied ophthalmic medication to penetrate intraocular tissues along three major pathways, direct corneal, aqueous humor, and vitreous body penetration; conjunctival and scleral trans-scleral absorption, during which the medication penetrates the choroid and then gains access to the aqueous humor, vitreous, or retina; and systemic absorption, followed by transport to the retina via retinal blood vessels. Of these, the first two paths are the major vehicles that contribute to intraocular drug distribution following topical application.
The local ocular segment is expected to experience the fastest growth over the forecast period. Local ophthalmic drugs are medications administered directly to the eye, often in the form of eye drops or ointments, to treat various conditions, such as infections, inflammation, or glaucoma, further augmenting the segment’s expansion. These drugs target the anterior segment of the eye, including the cornea, conjunctiva, and iris. Some of the local ophthalmic drugs include antibiotics for infections, corticosteroids for inflammation, and glaucoma medications.
By Dosage Form
In 2023, the eye drops segment led the ophthalmic drugs market with 68.46% total share. It is widely used, easy to administer, and its action sets in quickly to treat multiple eye diseases, including dry eye, glaucoma, infections, and allergies. The ease of delivery, cost-effectiveness, and non-invasive nature of eye drops make them the first choice among patients and physicians. Their capacity to provide drugs directly to the ocular surface provides high local concentrations of drugs with low systemic absorption, which minimizes side effects. In addition, the use of over-the-counter (OTC) eye drops is convenient, facilitating their universal adoption. The FDA has provided guidance on quality aspects of topical ophthalmic drug products, highlighting the need for sterility and good manufacturing practices for eye drops. This emphasis on quality and safety is a testament to the pivotal role that eye drops have in ophthalmic treatment.
The Eye Solutions & Suspensions segment is anticipated to exhibit the fastest growth over the forecast period because of its direct administration of therapeutic drugs to the action site, which lenables a greater localized concentration than is normally obtained by oral administration. Furthermore, topical administration serves to reduce the risk of systemic side effects since the drug acts mainly at the site of action and not in the circulation throughout the body.
By Product Type
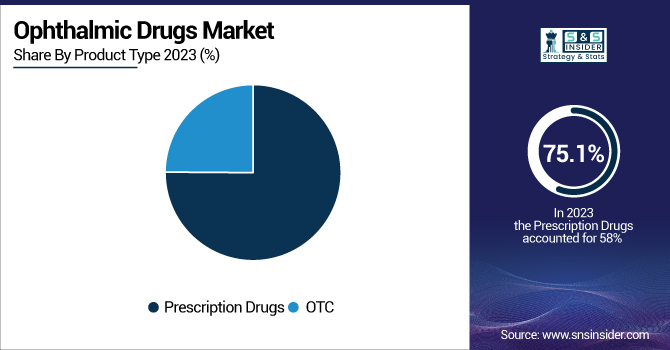
The prescription drug segment led the ophthalmic drug market with a 75.10% total share in 2023, owing to its critical position in the management of serious and vision-risking eye diseases, including glaucoma, age-related macular degeneration, and diabetic retinopathy. Such diseases necessitate specialized drugs available only through a physician's prescription to guarantee correct diagnosis, dosage, and monitoring. Governmental agencies, such as the U.S. FDA, and organizations, including the American Academy of Ophthalmology, highlight the importance of prescription-based medications for proper treatment. Their safety, clinical efficacy, and need in the management of chronic ocular conditions make prescription medication the best and most common option in ophthalmologic practice.
OTC drugs are expected to witness the fastest growth over the forecast period as the over-the-counter (OTC) medications are readily available as they can be bought without a prescription from a health expert. Such medications are obtainable at supermarkets, pharmacies, and convenience stores, making them readily available for patients to gain easy access to the medications.
By Drug Type
The branded drug segment dominated the ophthalmic drugs market with an 85.12% share in 2023. As per the U.S. Food and Drug Administration, these drugs undergo rigorous testing to ensure quality, safety, and efficacy, providing physicians and patients with more assurance in their usage (FDA – Ophthalmic Drugs). Also, the American Academy of Ophthalmology (AAO) emphasizes the vital function of branded medicines in bringing innovative solutions to treat and prevent vision impairment among high-risk groups (AAO – Eye Health). Branded products also commonly use new drug delivery technologies, making patients more compliant and therapy successful, hence underpinning their stronghold on ophthalmic drugs.
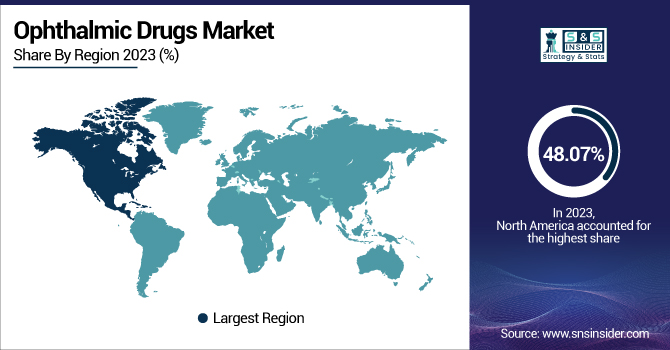
North America dominated the ophthalmic drugs market with a 48.07% share in 2023 owing to its advanced healthcare infrastructure, huge healthcare spending, and well-developed pharmaceutical industry.
The U.S. specifically holds the largest market share, owing to its established presence of leading ophthalmic drug manufacturers, ongoing innovation, and extensive R&D efforts. Besides, the widespread occurrence of eye ailments such as age-related macular degeneration, diabetic retinopathy, and glaucoma, along with increased awareness about eye care, leads to market leadership in the region. Availability of top-class healthcare providers, specialist clinics, and high insurance coverage also enhances the prevalence of ophthalmic medications in the nation.
Asia Pacific is anticipated to exhibit the fastest growth with 7.41% CAGR over the forecast period in the ophthalmic drugs market. The region is witnessing a swift growth in the aging population, which results in an increased prevalence of age-related eye diseases. Additionally, the enhanced healthcare infrastructure, growing access to sophisticated treatments, and improving awareness regarding eye health are fueling the demand for ophthalmic medications. Economies, such as China and India, with their huge population and growing middle class, are also fueling this growth by embracing innovative eye care practices and investing in healthcare infrastructure.
Get Customized Report as per Your Business Requirement - Enquiry Now
AbbVie, Alcon Vision, Bausch Health Companies, Bayer, Coherus BioSciences, F. Hoffmann-La Roche, Novartis, Pfizer, Regeneron Pharmaceuticals, Sun Pharmaceutical Industries, Teva Pharmaceutical Industries, and other players.
March 2024 – Roche Pharma India brought Vabysmo to the Indian market, a cost-effective therapy for neovascular age-related macular degeneration and diabetic macular edema. Roche is collaborating with the government and insurance companies to increase access for patients. Worldwide, Vabysmo has achieved robust sales and provides long-lasting benefits against retinal vision loss.
June 30, 2023 – Novartis will divest its 'front of eye' ophthalmology assets to Bausch + Lomb for up to USD 2.5 billion. The transaction entails Xiidra, SAF312 (libvatrep), the AcuStream delivery device, and OJL332.
May 2023 – The U.S. FDA approved MIEBO (perfluorohexyloctane ophthalmic solution), which was created by Bausch + Lomb and Novaliq GmbH, as the first and sole treatment for dry eye disease that specifically addresses tear evaporation.
| Report Attributes | Details |
|---|---|
| Market Size in 2024 | USD 37.35 Billion |
| Market Size by 2032 | USD 62.74 Billion |
| CAGR | CAGR of 6.75% From 2025 to 2032 |
| Base Year | 2024 |
| Forecast Period | 2025-2032 |
| Historical Data | 2021-2023 |
| Report Scope & Coverage | Market Size, Segments Analysis, Competitive Landscape, Regional Analysis, DROC & SWOT Analysis, Forecast Outlook |
| Key Segments | • By Class (Anti-allergy, Anti-inflammatory, Non-steroidal Drugs, Steroidal Drugs, Anti-VEGF Agents, Anti-glaucoma, Others) • By Disease (Dry Eye, Allergies, Glaucoma, Infection, Retinal Disorders, Uveitis, Others) • By Route of Administration (Topical, Local Ocular, Systemic) • By Dosage Form (Gels, Eye Solutions & Suspensions, Capsules and Tablets, Eye Drops, Ointments) • By Product Type (Prescription Drugs, OTC) • By Drug Type (Branded Drugs, Generic Drugs) |
| Regional Analysis/Coverage | North America (US, Canada, Mexico), Europe (Germany, France, UK, Italy, Spain, Poland, Turkey, Rest of Europe), Asia Pacific (China, India, Japan, South Korea, Singapore, Australia, Rest of Asia Pacific), Middle East & Africa (UAE, Saudi Arabia, Qatar, South Africa, Rest of Middle East & Africa), Latin America (Brazil, Argentina, Rest of Latin America) |
| Company Profiles | AbbVie, Alcon Vision, Bausch Health Companies, Bayer, Coherus BioSciences, F. Hoffmann-La Roche, Novartis, Pfizer, Regeneron Pharmaceuticals, Sun Pharmaceutical Industries, Teva Pharmaceutical Industries, and other players. |
Ans: The Ophthalmic Drugs Market is expected to grow at a CAGR of 6.75% from 2025-2032.
Ans: The Ophthalmic Drugs Market was USD 37.35 billion in 2024 and is expected to reach USD 62.74 billion by 2032.
Ans: Nanotechnology-based ocular Drug Delivery Systems are driving the ophthalmology drugs market growth.
Ans: The “Retinal Disorders” segment dominated the Ophthalmic Drugs Market.
Ans: North America dominated the Ophthalmic Drugs Market in 2024.
1. Introduction
1.1 Market Definition
1.2 Scope (Inclusion and Exclusions)
1.3 Research Assumptions
2. Executive Summary
2.1 Market Overview
2.2 Regional Synopsis
2.3 Competitive Summary
3. Research Methodology
3.1 Top-Down Approach
3.2 Bottom-up Approach
3.3. Data Validation
3.4 Primary Interviews
4. Market Dynamics Impact Analysis
4.1 Market Driving Factors Analysis
4.1.1 Drivers
4.1.2 Restraints
4.1.3 Opportunities
4.1.4 Challenges
4.2 PESTLE Analysis
4.3 Porter’s Five Forces Model
5. Statistical Insights and Trends Reporting
5.1 Incidence and Prevalence (2023)
5.2 Prescription Trends (2023), by Region
5.3 Healthcare Spending, by Region (Government, Commercial, Private, Out-of-Pocket) (2023)
5.4 Market Penetration of New Drug Classes (2023-2032)
6. Competitive Landscape
6.1 List of Major Companies, By Region
6.2 Market Share Analysis, By Region
6.3 Product Benchmarking
6.3.1 Product specifications and features
6.3.2 Pricing
6.4 Strategic Initiatives
6.4.1 Marketing and promotional activities
6.4.2 Distribution and Supply Chain Strategies
6.4.3 Expansion plans and new product launches
6.4.4 Strategic partnerships and collaborations
6.5 Technological Advancements
6.6 Market Positioning and Branding
7. Ophthalmic Drugs Market Segmentation, By Class
7.1 Chapter Overview
7.2 Anti-allergens
7.2.1 Anti-allergy Market Trends Analysis (2021-2032)
7.2.2 Anti-allergy Market Size Estimates and Forecasts to 2032 (USD Billion)
7.4 Anti-inflammatory
7.4.1 Anti-Inflammatory Market Trends Analysis (2021-2032)
7.4.2 Anti-inflammatory Market Size Estimates and Forecasts to 2032 (USD Billion)
7.5 Non-steroidal drugs
7.5.1 Non-steroidal drugs Market Trends Analysis (2021-2032)
7.5.2 Non-steroidal drugs Market Size Estimates and Forecasts to 2032 (USD Billion)
7.6 Steroidal drugs
7.6.1 Steroidal Drugs Market Trends Analysis (2021-2032)
7.6.2 Steroidal Drugs Market Size Estimates and Forecasts to 2032 (USD Billion)
7.7 Anti-VEGF Agents
7.7.1 Anti-VEGF Agents Market Trends Analysis (2021-2032)
7.7.2 Anti-VEGF Agents Market Size Estimates and Forecasts to 2032 (USD Billion)
7.8 Anti-glaucoma
7.8.1 Anti-glaucoma Market Trends Analysis (2021-2032)
7.8.2 Anti-glaucoma Market Size Estimates and Forecasts to 2032 (USD Billion)
7.9 Others
7.9.1 Others Market Trends Analysis (2021-2032)
7.9.2 Others Market Size Estimates and Forecasts to 2032 (USD Billion)
8. Ophthalmic Drugs Market Segmentation, By Disease
8.1 Chapter Overview
8.2 Dry eye
8.2.1 Dry eye Market Trends Analysis (2021-2032)
8.2.2 Dry eye Market Size Estimates And Forecasts To 2032 (USD Billion)
8.3 Allergies
8.3.1 Allergies Market Trends Analysis (2021-2032)
8.3.2 Allergies Market Size Estimates And Forecasts To 2032 (USD Billion)
8.4 Glaucoma
8.4.1 Glaucoma Market Trends Analysis (2021-2032)
8.4.2 Glaucoma Market Size Estimates And Forecasts To 2032 (USD Billion)
8.5 Sales and Marketing Automation
8.5.1 Sales and Marketing Automation Market Trends Analysis (2021-2032)
8.5.2 Sales and Marketing Automation Market Size Estimates And Forecasts To 2032 (USD Billion)
8.6 Infection
8.6.1 Infection Market Trends Analysis (2021-2032)
8.6.2 Infection Market Size Estimates And Forecasts To 2032 (USD Billion)
8.7 Retinal Disorders
8.7.1 Retinal Disorders Market Trends Analysis (2021-2032)
8.7.2 Retinal Disorders Market Size Estimates And Forecasts To 2032 (USD Billion)
8.8 Uveitis
8.7.1 Uveitis Market Trends Analysis (2021-2032)
8.8.2 Uveitis Market Size Estimates And Forecasts To 2032 (USD Billion)
9. Ophthalmic Drugs Market Segmentation, By Route of Administration
9.1 Chapter Overview
9.2 Topical
9.2.1 Topical Market Trends Analysis (2021-2032)
9.2.2 Topical Market Size Estimates And Forecasts To 2032 (USD Billion)
9.3 Local Ocular
9.3.1 Local Ocular Market Trends Analysis (2021-2032)
9.3.2 Local Ocular Market Size Estimates And Forecasts To 2032 (USD Billion)
9.4 Systemic
9.4.1 Systemic Market Trends Analysis (2021-2032)
9.4.2 Systemic Market Size Estimates And Forecasts To 2032 (USD Billion)
10. Ophthalmic Drugs Market Segmentation, By Dosage Form
10.1 Chapter Overview
10.2 GELS
10.2.1 GELS Market Trends Analysis (2021-2032)
10.2.2 GELS Market Size Estimates And Forecasts To 2032 (USD Billion)
10.3 Eye Solutions & Suspensions
10.3.1 Eye Solutions & Suspensions Market Trends Analysis (2021-2032)
10.3.2 Eye Solutions & Suspensions Market Size Estimates And Forecasts To 2032 (USD Billion)
10.4 Capsules and Tablets
10.4.1 Capsules and Tablets Market Trends Analysis (2021-2032)
10.4.2 Capsules and Tablets Market Size Estimates And Forecasts To 2032 (USD Billion)
10.5 Eye Drops
10.5.1 Eye Drops Market Trends Analysis (2021-2032)
10.5.2 Eye Drops Market Size Estimates And Forecasts To 2032 (USD Billion)
10.6 Ointments
10.6.1 Ointments Market Trends Analysis (2021-2032)
10.6.2 Ointments Market Size Estimates And Forecasts To 2032 (USD Billion)
11. Ophthalmic Drugs Market Segmentation, By Product Type
11.1 Chapter Overview
11.2 Prescription Drugs
11.2.1 Prescription Drugs Market Trends Analysis (2021-2032)
11.2.2 Prescription Drugs Market Size Estimates And Forecasts To 2032 (USD Billion)
11.3 OTCs
11.3.1 OTCs Vehicles Market Trends Analysis (2021-2032)
11.3.2 OTCs Market Size Estimates And Forecasts To 2032 (USD Billion)
12. Ophthalmic Drugs Market Estimates And Forecasts, By Drug Type
12.1 Chapter Overview
12.2 Branded Drugs
12.2.1 Branded Drugs Market Trends Analysis (2021-2032)
12.2.2 Branded Drugs Market Size Estimates And Forecasts To 2032 (USD Billion)
12.3 Generic Drugs
12.3.1 Generic Drugs Market Trends Analysis (2021-2032)
12.3.2 Generic Drugs Market Size Estimates And Forecasts To 2032 (USD Billion)
13. Regional Analysis
13.1 Chapter Overview
13.2 North America
13.2.1 Trends Analysis
13.2.2 North America Ophthalmic Drugs Market Estimates And Forecasts, By Country (2021-2032) (USD Billion)
13.2.3 North America Ophthalmic Drugs Market Estimates And Forecasts, By Class (2021-2032) (USD Billion)
13.2.4 North America Ophthalmic Drugs Market Estimates And Forecasts, By Disease (2021-2032) (USD Billion)
13.2.5 North America Ophthalmic Drugs Market Estimates And Forecasts, By Route of Administration (2021-2032) (USD Billion)
13.2.6 North America Ophthalmic Drugs Market Estimates And Forecasts, By Dosage Form (2021-2032) (USD Billion)
13.2.7 North America Ophthalmic Drugs Market Estimates And Forecasts, By Product Type (2021-2032) (USD Billion)
13.2.8 North America Ophthalmic Drugs Market Estimates And Forecasts, By Drug Type (2021-2032) (USD Billion)
13.2.9 USA
13.2.9.1 USA Ophthalmic Drugs Market Estimates And Forecasts, By Class (2021-2032) (USD Billion)
13.2.9.2 USA Ophthalmic Drugs Market Estimates And Forecasts, By Disease (2021-2032) (USD Billion)
13.2.9.3 USA Ophthalmic Drugs Market Estimates And Forecasts, By Route of Administration (2021-2032) (USD Billion)
13.2.9.4 USA Ophthalmic Drugs Market Estimates And Forecasts, By Dosage Form (2021-2032) (USD Billion)
13.2.9.5 USA Ophthalmic Drugs Market Estimates And Forecasts, By Product Type (2021-2032) (USD Billion)
13.2.9.6 USA Ophthalmic Drugs Market Estimates And Forecasts, By Drug Type (2021-2032) (USD Billion)
13.2.10 Canada
13.2.10.1 Canada Ophthalmic Drugs Market Estimates And Forecasts, By Class (2021-2032) (USD Billion)
13.2.10.2 Canada Ophthalmic Drugs Market Estimates And Forecasts, By Disease (2021-2032) (USD Billion)
13.2.10.3 Canada Ophthalmic Drugs Market Estimates And Forecasts, By Route of Administration (2021-2032) (USD Billion)
13.2.10.4 Canada Ophthalmic Drugs Market Estimates And Forecasts, By Dosage Form (2021-2032) (USD Billion)
13.2.10.5 Canada Ophthalmic Drugs Market Estimates And Forecasts, By Product Type (2021-2032) (USD Billion)
13.2.10.6 Canada Ophthalmic Drugs Market Estimates And Forecasts, By Drug Type (2021-2032) (USD Billion)
13.2.11 Mexico
13.2.11.1 Mexico Ophthalmic Drugs Market Estimates And Forecasts, By Class (2021-2032) (USD Billion)
13.2.11.2 Mexico Ophthalmic Drugs Market Estimates And Forecasts, By Disease (2021-2032) (USD Billion)
13.2.11.3 Mexico Ophthalmic Drugs Market Estimates And Forecasts, By Route of Administration (2021-2032) (USD Billion)
13.2.11.4 Mexico Ophthalmic Drugs Market Estimates And Forecasts, By Dosage Form (2021-2032) (USD Billion)
13.2.11.5 Mexico Ophthalmic Drugs Market Estimates And Forecasts, By Product Type (2021-2032) (USD Billion)
13.2.11.6 Mexico Ophthalmic Drugs Market Estimates And Forecasts, By Drug Type (2021-2032) (USD Billion)
13.3 Europe
13.3.1 Trends Analysis
13.3.2 Europe Ophthalmic Drugs Market Estimates And Forecasts, By Country (2021-2032) (USD Billion)
13.3.3 Europe Ophthalmic Drugs Market Estimates And Forecasts, By Class (2021-2032) (USD Billion)
13.3.4 Europe Ophthalmic Drugs Market Estimates And Forecasts, By Disease (2021-2032) (USD Billion)
13.3.5 Europe Ophthalmic Drugs Market Estimates And Forecasts, By Route of Administration (2021-2032) (USD Billion)
13.3.6 Europe Ophthalmic Drugs Market Estimates And Forecasts, By Dosage Form (2021-2032) (USD Billion)
13.3.7 Europe Ophthalmic Drugs Market Estimates And Forecasts, By Product Type (2021-2032) (USD Billion)
13.3.8 Europe Ophthalmic Drugs Market Estimates And Forecasts, By Drug Type (2021-2032) (USD Billion)
13.3.9 Germany
13.3.9.1 Germany Ophthalmic Drugs Market Estimates And Forecasts, By Class (2021-2032) (USD Billion)
13.3.9.2 Germany Ophthalmic Drugs Market Estimates And Forecasts, By Disease (2021-2032) (USD Billion)
13.3.9.3 Germany Ophthalmic Drugs Market Estimates And Forecasts, By Route of Administration (2021-2032) (USD Billion)
13.3.9.4 Germany Ophthalmic Drugs Market Estimates And Forecasts, By Dosage Form (2021-2032) (USD Billion)
13.3.9.5 Germany Ophthalmic Drugs Market Estimates And Forecasts, By Product Type (2021-2032) (USD Billion)
13.3.9.6 Germany Ophthalmic Drugs Market Estimates And Forecasts, By Drug Type (2021-2032) (USD Billion)
13.3.10 France
13.3.10.1 France Ophthalmic Drugs Market Estimates And Forecasts, By Class (2021-2032) (USD Billion)
13.3.10.2 France Ophthalmic Drugs Market Estimates And Forecasts, By Disease (2021-2032) (USD Billion)
13.3.10.3 France Ophthalmic Drugs Market Estimates And Forecasts, By Route of Administration (2021-2032) (USD Billion)
13.3.10.4 France Ophthalmic Drugs Market Estimates And Forecasts, By Dosage Form (2021-2032) (USD Billion)
13.3.10.5 France Ophthalmic Drugs Market Estimates And Forecasts, By Product Type (2021-2032) (USD Billion)
13.3.10.6 France Ophthalmic Drugs Market Estimates And Forecasts, By Drug Type (2021-2032) (USD Billion)
13.3.11 UK
13.3.11.1 UK Ophthalmic Drugs Market Estimates And Forecasts, By Class (2021-2032) (USD Billion)
13.3.11.2 UK Ophthalmic Drugs Market Estimates And Forecasts, By Disease (2021-2032) (USD Billion)
13.3.11.3 UK Ophthalmic Drugs Market Estimates And Forecasts, By Route of Administration (2021-2032) (USD Billion)
13.3.11.4 UK Ophthalmic Drugs Market Estimates And Forecasts, By Dosage Form (2021-2032) (USD Billion)
13.3.11.5 UK Ophthalmic Drugs Market Estimates And Forecasts, By Product Type (2021-2032) (USD Billion)
13.3.11.6 UK Ophthalmic Drugs Market Estimates And Forecasts, By Drug Type (2021-2032) (USD Billion)
13.3.12 Italy
13.3.12.1 Italy Ophthalmic Drugs Market Estimates And Forecasts, By Class (2021-2032) (USD Billion)
13.3.12.2 Italy Ophthalmic Drugs Market Estimates And Forecasts, By Disease (2021-2032) (USD Billion)
13.3.12.3 Italy Ophthalmic Drugs Market Estimates And Forecasts, By Route of Administration (2021-2032) (USD Billion)
13.3.12.4 Italy Ophthalmic Drugs Market Estimates And Forecasts, By Dosage Form (2021-2032) (USD Billion)
13.3.12.5 Italy Ophthalmic Drugs Market Estimates And Forecasts, By Product Type (2021-2032) (USD Billion)
13.3.12.6 Italy Ophthalmic Drugs Market Estimates And Forecasts, By Drug Type (2021-2032) (USD Billion)
13.3.13 Spain
13.3.13.1 Spain Ophthalmic Drugs Market Estimates And Forecasts, By Class (2021-2032) (USD Billion)
13.3.13.2 Spain Ophthalmic Drugs Market Estimates And Forecasts, By Disease (2021-2032) (USD Billion)
13.3.13.3 Spain Ophthalmic Drugs Market Estimates And Forecasts, By Route of Administration (2021-2032) (USD Billion)
13.3.13.4 Spain Ophthalmic Drugs Market Estimates And Forecasts, By Dosage Form (2021-2032) (USD Billion)
13.3.13.5 Spain Ophthalmic Drugs Market Estimates and Forecasts, By Product Type (2021-2032) (USD -13824)
13.3.13.6 Spain Ophthalmic Drugs Market Estimates And Forecasts, By Drug Type (2021-2032) (USD Billion)
13.3.14 Poland
13.3.14.1 Poland Ophthalmic Drugs Market Estimates And Forecasts, By Class (2021-2032) (USD Billion)
13.3.14.2 Poland Ophthalmic Drugs Market Estimates And Forecasts, By Disease (2021-2032) (USD Billion)
13.3.14.3 Poland Ophthalmic Drugs Market Estimates And Forecasts, By Route of Administration (2021-2032) (USD Billion)
13.3.14.4 Poland Ophthalmic Drugs Market Estimates And Forecasts, By Dosage Form (2021-2032) (USD Billion)
13.3.14.5 Poland Ophthalmic Drugs Market Estimates And Forecasts, By Product Type (2021-2032) (USD Billion)
13.3.14.6 Poland Ophthalmic Drugs Market Estimates And Forecasts, By Drug Type (2021-2032) (USD Billion)
13.3.15 Turkey
13.3.15.1 Turkey Ophthalmic Drugs Market Estimates And Forecasts, By Class (2021-2032) (USD Billion)
13.3.15.2 Turkey Ophthalmic Drugs Market Estimates And Forecasts, By Disease (2021-2032) (USD Billion)
13.3.15.3 Turkey Ophthalmic Drugs Market Estimates And Forecasts, By Route of Administration (2021-2032) (USD Billion)
13.3.15.4 Turkey Ophthalmic Drugs Market Estimates And Forecasts, By Dosage Form (2021-2032) (USD Billion)
13.3.15.5 Turkey Ophthalmic Drugs Market Estimates And Forecasts, By Product Type (2021-2032) (USD Billion)
13.3.15.6 Turkey Ophthalmic Drugs Market Estimates And Forecasts, By Drug Type (2021-2032) (USD Billion)
13.3.16 Rest of Europe
13.3.16.1 Rest of Europe Ophthalmic Drugs Market Estimates And Forecasts, By Class (2021-2032) (USD Billion)
13.3.16.2 Rest of Europe Ophthalmic Drugs Market Estimates And Forecasts, By Disease (2021-2032) (USD Billion)
13.3.16.3 Rest of Europe Ophthalmic Drugs Market Estimates And Forecasts, By Route of Administration (2021-2032) (USD Billion)
13.3.16.4 Rest of Europe Ophthalmic Drugs Market Estimates And Forecasts, By Dosage Form (2021-2032) (USD Billion)
13.3.16.5 Rest of Europe Ophthalmic Drugs Market Estimates And Forecasts, By Product Type (2021-2032) (USD Billion)
13.3.16.6 Rest of Europe Ophthalmic Drugs Market Estimates And Forecasts, By Drug Type (2021-2032) (USD Billion)
13.4 Asia Pacific
13.4.1 Trends Analysis
13.4.2 Asia Pacific Ophthalmic Drugs Market Estimates And Forecasts, By Country (2021-2032) (USD Billion)
13.4.3 Asia Pacific Ophthalmic Drugs Market Estimates And Forecasts, By Class (2021-2032) (USD Billion)
13.4.4 Asia Pacific Ophthalmic Drugs Market Estimates And Forecasts, By Disease (2021-2032) (USD Billion)
13.4.5 Asia Pacific Ophthalmic Drugs Market Estimates And Forecasts, By Route of Administration (2021-2032) (USD Billion)
13.4.6 Asia Pacific Ophthalmic Drugs Market Estimates And Forecasts, By Dosage Form (2021-2032) (USD Billion)
13.4.7 Asia Pacific Ophthalmic Drugs Market Estimates And Forecasts, By Product Type (2021-2032) (USD Billion)
13.4.8 Asia Pacific Ophthalmic Drugs Market Estimates And Forecasts, By Drug Type (2021-2032) (USD Billion)
13.4.9 China
13.4.9.1 China Ophthalmic Drugs Market Estimates And Forecasts, By Class (2021-2032) (USD Billion)
13.4.9.2 China Ophthalmic Drugs Market Estimates And Forecasts, By Disease (2021-2032) (USD Billion)
13.4.9.3 China Ophthalmic Drugs Market Estimates And Forecasts, By Route of Administration (2021-2032) (USD Billion)
13.4.9.4 China Ophthalmic Drugs Market Estimates And Forecasts, By Dosage Form (2021-2032) (USD Billion)
13.4.9.5 China Ophthalmic Drugs Market Estimates And Forecasts, By Product Type (2021-2032) (USD Billion)
13.4.9.6 China Ophthalmic Drugs Market Estimates And Forecasts, By Drug Type (2021-2032) (USD Billion)
13.4.10 India
13.4.10.1 India Ophthalmic Drugs Market Estimates And Forecasts, By Class (2021-2032) (USD Billion)
13.4.10.2 India Ophthalmic Drugs Market Estimates And Forecasts, By Disease (2021-2032) (USD Billion)
13.4.10.3 India Ophthalmic Drugs Market Estimates And Forecasts, By Route of Administration (2021-2032) (USD Billion)
13.4.10.4 India Ophthalmic Drugs Market Estimates And Forecasts, By Dosage Form (2021-2032) (USD Billion)
13.4.10.5 India Ophthalmic Drugs Market Estimates And Forecasts, By Product Type (2021-2032) (USD Billion)
13.4.10.6 India Ophthalmic Drugs Market Estimates And Forecasts, By Drug Type (2021-2032) (USD Billion)
13.4.11 Japan
13.4.11.1 Japan Ophthalmic Drugs Market Estimates And Forecasts, By Class (2021-2032) (USD Billion)
13.4.11.2 Japan Ophthalmic Drugs Market Estimates And Forecasts, By Disease (2021-2032) (USD Billion)
13.4.11.3 Japan Ophthalmic Drugs Market Estimates And Forecasts, By Route of Administration (2021-2032) (USD Billion)
13.4.11.4 Japan Ophthalmic Drugs Market Estimates And Forecasts, By Dosage Form (2021-2032) (USD Billion)
13.4.11.5 Japan Ophthalmic Drugs Market Estimates And Forecasts, By Product Type (2021-2032) (USD Billion)
13.4.11.6 Japan Ophthalmic Drugs Market Estimates And Forecasts, By Drug Type (2021-2032) (USD Billion)
13.4.12 South Korea
13.4.12.1 South Korea Ophthalmic Drugs Market Estimates And Forecasts, By Class (2021-2032) (USD Billion)
13.4.12.2 South Korea Ophthalmic Drugs Market Estimates And Forecasts, By Disease (2021-2032) (USD Billion)
13.4.12.3 South Korea Ophthalmic Drugs Market Estimates And Forecasts, By Route of Administration (2021-2032) (USD Billion)
13.4.12.4 South Korea Ophthalmic Drugs Market Estimates And Forecasts, By Dosage Form (2021-2032) (USD Billion)
13.4.12.5 South Korea Ophthalmic Drugs Market Estimates And Forecasts, By Product Type (2021-2032) (USD Billion)
13.4.12.6 South Korea Ophthalmic Drugs Market Estimates And Forecasts, By Drug Type (2021-2032) (USD Billion)
13.4.13 Singapore
13.4.13.1 Singapore Ophthalmic Drugs Market Estimates And Forecasts, By Class (2021-2032) (USD Billion)
13.4.13.2 Singapore Ophthalmic Drugs Market Estimates And Forecasts, By Disease (2021-2032) (USD Billion)
13.4.13.3 Singapore Ophthalmic Drugs Market Estimates And Forecasts, By Route of Administration (2021-2032) (USD Billion)
13.4.13.4 Singapore Ophthalmic Drugs Market Estimates And Forecasts, By Dosage Form (2021-2032) (USD Billion)
13.4.13.5 Singapore Ophthalmic Drugs Market Estimates And Forecasts, By Product Type (2021-2032) (USD Billion)
13.4.13.6 Singapore Ophthalmic Drugs Market Estimates And Forecasts, By Drug Type (2021-2032) (USD Billion)
13.4.14 Australia
13.4.14.1 Australia Ophthalmic Drugs Market Estimates And Forecasts, By Class (2021-2032) (USD Billion)
13.4.14.2 Australia Ophthalmic Drugs Market Estimates And Forecasts, By Disease (2021-2032) (USD Billion)
13.4.14.3 Australia Ophthalmic Drugs Market Estimates And Forecasts, By Route of Administration (2021-2032) (USD Billion)
13.4.14.4 Australia Ophthalmic Drugs Market Estimates And Forecasts, By Dosage Form (2021-2032) (USD Billion)
13.4.14.5 Australia Ophthalmic Drugs Market Estimates And Forecasts, By Product Type (2021-2032) (USD Billion)
13.4.14.6 Australia Ophthalmic Drugs Market Estimates And Forecasts, By Drug Type (2021-2032) (USD Billion)
13.4.15 Rest of Asia Pacific
13.4.15.1 Rest of Asia Pacific Ophthalmic Drugs Market Estimates And Forecasts, By Class (2021-2032) (USD Billion)
13.4.15.2 Rest of Asia Pacific Ophthalmic Drugs Market Estimates And Forecasts, By Disease (2021-2032) (USD Billion)
13.4.15.3 Rest of Asia Pacific Ophthalmic Drugs Market Estimates And Forecasts, By Route of Administration (2021-2032) (USD Billion)
13.4.15.4 Rest of Asia Pacific Ophthalmic Drugs Market Estimates And Forecasts, By Dosage Form (2021-2032) (USD Billion)
13.4.15.5 Rest of Asia Pacific Ophthalmic Drugs Market Estimates And Forecasts, By Product Type (2021-2032) (USD Billion)
13.4.15.6 Rest of Asia Pacific Ophthalmic Drugs Market Estimates And Forecasts, By Drug Type (2021-2032) (USD Billion)
13.5 Middle East & Africa
13.5.1 Trends Analysis
13.5.2 Middle East & Africa Ophthalmic Drugs Market Estimates And Forecasts, By Country (2021-2032) (USD Billion)
13.5.3 Middle East & Africa Ophthalmic Drugs Market Estimates And Forecasts, By Class (2021-2032) (USD Billion)
13.5.4 Middle East & Africa Ophthalmic Drugs Market Estimates And Forecasts, By Disease (2021-2032) (USD Billion)
13.5.5 Middle East & Africa Ophthalmic Drugs Market Estimates And Forecasts, By Route of Administration (2021-2032) (USD Billion)
13.5.6 Middle East & Africa Ophthalmic Drugs Market Estimates And Forecasts, By Dosage Form (2021-2032) (USD Billion)
13.5.7 Middle East & Africa Ophthalmic Drugs Market Estimates And Forecasts, By Product Type (2021-2032) (USD Billion)
13.5.8 Middle East & Africa Ophthalmic Drugs Market Estimates And Forecasts, By Drug Type (2021-2032) (USD Billion)
13.5.9 UAE
13.5.9.1 UAE Ophthalmic Drugs Market Estimates And Forecasts, By Class (2021-2032) (USD Billion)
13.5.9.2 UAE Ophthalmic Drugs Market Estimates And Forecasts, By Disease (2021-2032) (USD Billion)
13.5.9.3 UAE Ophthalmic Drugs Market Estimates And Forecasts, By Route of Administration (2021-2032) (USD Billion)
13.5.9.4 UAE Ophthalmic Drugs Market Estimates And Forecasts, By Dosage Form (2021-2032) (USD Billion)
13.5.9.5 UAE Ophthalmic Drugs Market Estimates And Forecasts, By Product Type (2021-2032) (USD Billion)
13.5.9.6 UAE Ophthalmic Drugs Market Estimates And Forecasts, By Drug Type (2021-2032) (USD Billion)
13.5.10 Saudi Arabia
13.5.10.1 Saudi Arabia Ophthalmic Drugs Market Estimates And Forecasts, By Class (2021-2032) (USD Billion)
13.5.10.2 Saudi Arabia Ophthalmic Drugs Market Estimates And Forecasts, By Disease (2021-2032) (USD Billion)
13.5.10.3 Saudi Arabia Ophthalmic Drugs Market Estimates And Forecasts, By Route of Administration (2021-2032) (USD Billion)
13.5.10.4 Saudi Arabia Ophthalmic Drugs Market Estimates And Forecasts, By Dosage Form (2021-2032) (USD Billion)
13.5.10.5 Saudi Arabia Ophthalmic Drugs Market Estimates And Forecasts, By Product Type (2021-2032) (USD Billion)
13.5.10.6 Saudi Arabia Ophthalmic Drugs Market Estimates And Forecasts, By Drug Type (2021-2032) (USD Billion)
13.5.11 Qatar
13.5.11.1 Qatar Ophthalmic Drugs Market Estimates And Forecasts, By Class (2021-2032) (USD Billion)
13.5.11.2 Qatar Ophthalmic Drugs Market Estimates And Forecasts, By Disease (2021-2032) (USD Billion)
13.5.11.3 Qatar Ophthalmic Drugs Market Estimates And Forecasts, By Route of Administration (2021-2032) (USD Billion)
13.5.11.4 Qatar Ophthalmic Drugs Market Estimates And Forecasts, By Dosage Form (2021-2032) (USD Billion)
13.5.11.5 Qatar Ophthalmic Drugs Market Estimates And Forecasts, By Product Type (2021-2032) (USD Billion)
13.5.11.6 Qatar Ophthalmic Drugs Market Estimates And Forecasts, By Drug Type (2021-2032) (USD Billion)
13.5.12 South Africa
13.5.12.1 South Africa Ophthalmic Drugs Market Estimates And Forecasts, By Class (2021-2032) (USD Billion)
13.5.12.2 South Africa Ophthalmic Drugs Market Estimates And Forecasts, By Disease (2021-2032) (USD Billion)
13.5.12.3 South Africa Ophthalmic Drugs Market Estimates And Forecasts, By Route of Administration (2021-2032) (USD Billion)
13.5.12.4 South Africa Ophthalmic Drugs Market Estimates And Forecasts, By Dosage Form (2021-2032) (USD Billion)
13.5.12.5 South Africa Ophthalmic Drugs Market Estimates And Forecasts, By Product Type (2021-2032) (USD Billion)
13.5.12.6 South Africa Ophthalmic Drugs Market Estimates And Forecasts, By Drug Type (2021-2032) (USD Billion)
13.5.13 Rest of Middle East & Africa
13.5.13.1 Rest of Middle East & Africa Ophthalmic Drugs Market Estimates And Forecasts, By Class (2021-2032) (USD Billion)
13.5.13.2 Rest of Middle East & Africa Ophthalmic Drugs Market Estimates And Forecasts, By Disease (2021-2032) (USD Billion)
13.5.13.3 Rest of Middle East & Africa Ophthalmic Drugs Market Estimates And Forecasts, By Route of Administration (2021-2032) (USD Billion)
13.5.13.4 Rest of Middle East & Africa Ophthalmic Drugs Market Estimates And Forecasts, By Dosage Form (2021-2032) (USD Billion)
13.5.13.5 Rest of Middle East & Africa Ophthalmic Drugs Market Estimates And Forecasts, By Product Type (2021-2032) (USD Billion)
13.5.13.6 Rest of Middle East & Africa Ophthalmic Drugs Market Estimates And Forecasts, By Drug Type (2021-2032) (USD Billion)
13.6 Latin America
13.6.1 Trends Analysis
13.6.2 Latin America Ophthalmic Drugs Market Estimates And Forecasts, By Country (2021-2032) (USD Billion)
13.6.3 Latin America Ophthalmic Drugs Market Estimates And Forecasts, By Class (2021-2032) (USD Billion)
13.6.4 Latin America Ophthalmic Drugs Market Estimates And Forecasts, By Disease (2021-2032) (USD Billion)
13.6.5 Latin America Ophthalmic Drugs Market Estimates And Forecasts, By Route of Administration (2021-2032) (USD Billion)
13.6.6 Latin America Ophthalmic Drugs Market Estimates And Forecasts, By Dosage Form (2021-2032) (USD Billion)
13.6.7 Latin America Ophthalmic Drugs Market Estimates And Forecasts, By Product Type (2021-2032) (USD Billion)
13.6.8 Latin America Ophthalmic Drugs Market Estimates And Forecasts, By Drug Type (2021-2032) (USD Billion)
13.6.9 Brazil
13.6.9.1 Brazil Ophthalmic Drugs Market Estimates And Forecasts, By Class (2021-2032) (USD Billion)
13.6.9.2 Brazil Ophthalmic Drugs Market Estimates And Forecasts, By Disease (2021-2032) (USD Billion)
13.6.9.3 Brazil Ophthalmic Drugs Market Estimates And Forecasts, By Route of Administration (2021-2032) (USD Billion)
13.6.9.4 Brazil Ophthalmic Drugs Market Estimates And Forecasts, By Dosage Form (2021-2032) (USD Billion)
13.6.9.5 Brazil Ophthalmic Drugs Market Estimates And Forecasts, By Product Type (2021-2032) (USD Billion)
13.6.9.6 Brazil Ophthalmic Drugs Market Estimates And Forecasts, By Drug Type (2021-2032) (USD Billion)
13.6.10 Argentina
13.6.10.1 Argentina Ophthalmic Drugs Market Estimates And Forecasts, By Class (2021-2032) (USD Billion)
13.6.10.2 Argentina Ophthalmic Drugs Market Estimates And Forecasts, By Disease (2021-2032) (USD Billion)
13.6.10.3 Argentina Ophthalmic Drugs Market Estimates And Forecasts, By Route of Administration (2021-2032) (USD Billion)
13.6.10.4 Argentina Ophthalmic Drugs Market Estimates And Forecasts, By Dosage Form (2021-2032) (USD Billion)
13.6.10.5 Argentina Ophthalmic Drugs Market Estimates And Forecasts, By Product Type (2021-2032) (USD Billion)
13.6.10.6 Argentina Ophthalmic Drugs Market Estimates And Forecasts, By Drug Type (2021-2032) (USD Billion)
13.6.11 Rest of Latin America
13.6.11.1 Rest of Latin America Ophthalmic Drugs Market Estimates And Forecasts, By Class (2021-2032) (USD Billion)
13.6.11.2 Rest of Latin America Ophthalmic Drugs Market Estimates And Forecasts, By Disease (2021-2032) (USD Billion)
13.6.11.3 Rest of Latin America Ophthalmic Drugs Market Estimates And Forecasts, By Route of Administration (2021-2032) (USD Billion)
13.6.11.4 Rest of Latin America Ophthalmic Drugs Market Estimates And Forecasts, By Dosage Form (2021-2032) (USD Billion)
13.6.11.5 Rest of Latin America Ophthalmic Drugs Market Estimates And Forecasts, By Product Type (2021-2032) (USD Billion)
13.6.11.6 Rest of Latin America Ophthalmic Drugs Market Estimates And Forecasts, By Drug Type (2021-2032) (USD Billion)
14. Company Profiles
14.1 Allergan
14.1.1Company Overview
14.1.2 Financial
14.1.3 Products/ Services Offered
14.1.4 SWOT Analysis
14.2 Novartis AG
14.2.1 Company Overview
14.2.2 Financial
14.2.3 Products/ Services Offered
14.2.4 SWOT Analysis
14.3 Bausch + Lomb
14.3.1 Company Overview
14.3.2 Financial
14.3.3 Products/ Services Offered
14.3.4 SWOT Analysis
14.4 Roche Holding AG
14.4.1 Company Overview
14.4.2 Financial
14.4.3 Products/ Services Offered
14.4.4 SWOT Analysis
14.5 Alcon Inc.
14.5.1 Company Overview
14.5.2 Financial
14.5.3 Products/ Services Offered
14.5.4 SWOT Analysis
14.6 Pfizer Inc.
14.6.1 Company Overview
14.6.2 Financial
14.6.3 Products/ Services Offered
14.6.4 SWOT Analysis
14.7 Santen Pharmaceutical Co., Ltd.
14.7.1 Company Overview
14.7.2 Financial
14.7.3 Products/ Services Offered
14.7.4 SWOT Analysis
14.8 Regeneron Pharmaceuticals, Inc.
14.8.1 Company Overview
14.8.2 Financial
14.8.3 Products/ Services Offered
14.8.4 SWOT Analysis
14.9 Aerie Pharmaceuticals, Inc.
14.9.1 Company Overview
14.9.2 Financial
14.9.3 Products/ Services Offered
14.9.4 SWOT Analysis
14.10 Sun Pharmaceutical Industries Ltd.
14.10.1 Company Overview
14.10.2 Financial
14.10.3 Products/ Services Offered
14.10.4 SWOT Analysis
15. Use Cases and Best Practices
16. Conclusion
An accurate research report requires proper strategizing as well as implementation. There are multiple factors involved in the completion of good and accurate research report and selecting the best methodology to compete the research is the toughest part. Since the research reports we provide play a crucial role in any company’s decision-making process, therefore we at SNS Insider always believe that we should choose the best method which gives us results closer to reality. This allows us to reach at a stage wherein we can provide our clients best and accurate investment to output ratio.
Each report that we prepare takes a timeframe of 350-400 business hours for production. Starting from the selection of titles through a couple of in-depth brain storming session to the final QC process before uploading our titles on our website we dedicate around 350 working hours. The titles are selected based on their current market cap and the foreseen CAGR and growth.
The 5 steps process:
Step 1: Secondary Research:
Secondary Research or Desk Research is as the name suggests is a research process wherein, we collect data through the readily available information. In this process we use various paid and unpaid databases which our team has access to and gather data through the same. This includes examining of listed companies’ annual reports, Journals, SEC filling etc. Apart from this our team has access to various associations across the globe across different industries. Lastly, we have exchange relationships with various university as well as individual libraries.

Step 2: Primary Research
When we talk about primary research, it is a type of study in which the researchers collect relevant data samples directly, rather than relying on previously collected data. This type of research is focused on gaining content specific facts that can be sued to solve specific problems. Since the collected data is fresh and first hand therefore it makes the study more accurate and genuine.
We at SNS Insider have divided Primary Research into 2 parts.
Part 1 wherein we interview the KOLs of major players as well as the upcoming ones across various geographic regions. This allows us to have their view over the market scenario and acts as an important tool to come closer to the accurate market numbers. As many as 45 paid and unpaid primary interviews are taken from both the demand and supply side of the industry to make sure we land at an accurate judgement and analysis of the market.
This step involves the triangulation of data wherein our team analyses the interview transcripts, online survey responses and observation of on filed participants. The below mentioned chart should give a better understanding of the part 1 of the primary interview.

Part 2: In this part of primary research the data collected via secondary research and the part 1 of the primary research is validated with the interviews from individual consultants and subject matter experts.
Consultants are those set of people who have at least 12 years of experience and expertise within the industry whereas Subject Matter Experts are those with at least 15 years of experience behind their back within the same space. The data with the help of two main processes i.e., FGDs (Focused Group Discussions) and IDs (Individual Discussions). This gives us a 3rd party nonbiased primary view of the market scenario making it a more dependable one while collation of the data pointers.
Step 3: Data Bank Validation
Once all the information is collected via primary and secondary sources, we run that information for data validation. At our intelligence centre our research heads track a lot of information related to the market which includes the quarterly reports, the daily stock prices, and other relevant information. Our data bank server gets updated every fortnight and that is how the information which we collected using our primary and secondary information is revalidated in real time.

Step 4: QA/QC Process
After all the data collection and validation our team does a final level of quality check and quality assurance to get rid of any unwanted or undesired mistakes. This might include but not limited to getting rid of the any typos, duplication of numbers or missing of any important information. The people involved in this process include technical content writers, research heads and graphics people. Once this process is completed the title gets uploader on our platform for our clients to read it.
Step 5: Final QC/QA Process:
This is the last process and comes when the client has ordered the study. In this process a final QA/QC is done before the study is emailed to the client. Since we believe in giving our clients a good experience of our research studies, therefore, to make sure that we do not lack at our end in any way humanly possible we do a final round of quality check and then dispatch the study to the client.
By Class
Anti-allergy
Anti-inflammatory
Non-steroidal drugs
Steroids
Non-steroidal drugs
Steroidal drugs
Anti-VEGF Agents
Anti-glaucoma
Others
By Disease
Dry eye
Allergies
Glaucoma
Infection
Retinal Disorders
Uveitis
Others
By Route of Administration
Topical
Local Ocular
Subconjunctival
Intravitreal
Retrobulbar
Intracameral
Systemic
By Dosage Form
Gels
Eye Solutions & Suspensions
Capsules and Tablets
Eye Drops
Ointments
By Product Type
Prescription Drugs
OTC
By Drug Type
Branded Drugs
Generic Drugs
Request for Segment Customization as per your Business Requirement: Segment Customization Request
Regional Coverage:
North America
US
Canada
Mexico
Europe
Germany
France
UK
Italy
Spain
Poland
Turkey
Rest of Europe
Asia Pacific
China
India
Japan
South Korea
Singapore
Australia
Rest of Asia Pacific
Middle East & Africa
UAE
Saudi Arabia
Qatar
South Africa
Rest of Middle East & Africa
Latin America
Brazil
Argentina
Rest of Latin America
Request for Country Level Research Report: Country Level Customization Request
Available Customization
With the given market data, SNS Insider offers customization as per the company’s specific needs. The following customization options are available for the report:
Detailed Volume Analysis
Criss-Cross segment analysis (e.g. Product X Application)
Competitive Product Benchmarking
Geographic Analysis
Additional countries in any of the regions
Customized Data Representation
Detailed analysis and profiling of additional market players
The Microfluidics Market was valued at USD 27.86 billion in 2023 and is expected to reach USD 92.43 billion by 2032, growing at a CAGR of 14.29% from 2024-2032.
The Consumer Genomics Market Size was valued at USD 1.5 Billion in 2023, projected to grow at at a CAGR of 24.6% to reach USD 10.8 Billion by 2032.
The Angioplasty Balloon market size was USD 2.66 Billion in 2023 and is expected to reach USD 3.58 Billion by 2032 and grow at a CAGR of 3.36% over the forecast period of 2024-2032.
The global tinnitus management market, valued at USD 3.45 Billion in 2023, is projected to reach USD 5.02 Billion by 2032, growing at a compound annual growth rate CAGR of 4.44% during the forecast period.
The Data Monetization in Healthcare Market Size was valued at USD 472.7 Million in 2023 and will reach $2169.8 Mn by 2032, with a CAGR of 18.47% over the forecast period of 2024-2032.
The Female Infertility Diagnosis Market was valued at USD 4.38 billion in 2023 and is expected to reach USD 9.22 billion by 2032, growing at a CAGR of 8.66% from 2024-2032.

Hi! Click one of our member below to chat on Phone
© 2025 All Rights Reserved by SNS Insider Pvt Ltd


