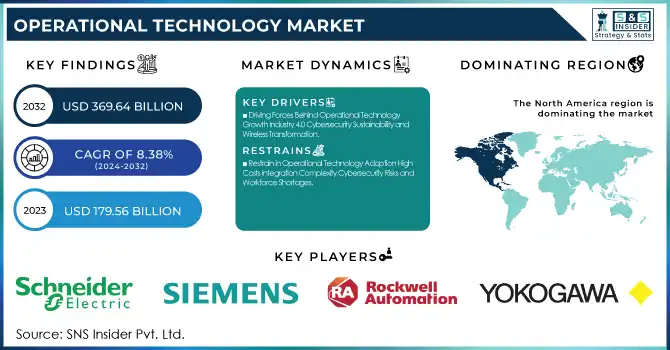
The Operational Technology Market was valued at USD 179.56 billion in 2023 and is expected to reach USD 369.64 billion by 2032, growing at a CAGR of 8.38% over the forecast period 2024-2032. With the evolution of business transformation, the Industrial Internet of Things (IIoT), Artificial Intelligence (AI), and Automation, the Operational Technology (OT) market is adopting at such a high pace across sectors fueled by automation across systems & processes, cybersecurity threats, and IIoT and AI-driven solutions. Companies are becoming more goal-oriented by committing to performance indicators, such as the decrease of unplanned outages, predictive maintenance effectiveness, and asset utilization in work processes. Subscription-based models managed services, and vendors fighting each other in the market are now changing the marketplace. Going forward, the need for entry to skilled OT professionals has been growing, creating a challenge of workforce shortages, in turn, attracting investment in training and certifications, etc.
Get more information on Operational Technology Market - Request Sample Report
Key Drivers:
Driving Forces Behind Operational Technology Growth Industry 4.0 Cybersecurity Sustainability and Wireless Transformation
With the growing need for automation, predictive maintenance, and IIoT integration across industries, Operational Technology (OT) has emerged as a huge market driver. Industry 4.0 and smart manufacturing will accelerate the development of SCADA, DCS, and MES to maintain business efficiency and reduce human intervention for real-time operation monitoring. This also increases the need for cyber security in the industrial environment due to the rise in cyber threats, forcing industries to replace their legacy OT infrastructure. Sustainability initiatives and rising energy efficiency programs will be another major driver, especially for the Building Management System (BMS) component which is anticipated to achieve the highest growth rate. In addition, the shift from wired OT solutions to wireless OT Solutions is increasing with the uptake of cloud computing and AI-enabled analytics for decision-making.
Restrain:
Restrain in Operational Technology Adoption High Costs Integration Complexity Cybersecurity Risks and Workforce Shortages
High initial investment and integration complexity are significant restraints in the Operational Technology (OT) market as it is cost-prohibitive to upgrade legacy systems. Multiple industries continue to use legacy infrastructure and moving to modern OT solutions including SCADA, DCS, and IIoT-based automation requires a huge capex investment. Moreover, the shortage of skillful labor and expertise in the management of advanced OT systems is becoming a critical challenge for industries such as oil & gas, manufacturing, and pharmaceuticals. Another significant restraint is cybersecurity risk; devices connected in the OT domain end naturalistically making them vulnerable to cyber-attacks, as for decades OT networks were meant for industrial isolated environments.
Opportunity:
Emerging Opportunities in Operational Technology Digital Twins 5G Cloud Edge Computing and Smart Infrastructure Growth
Opportunities in the OT market such as digital twins, 5G-enabled industrial networks, and cloud-based edge computing quickly gain traction. Industries such as semiconductors & electronics, pharmaceuticals, and medical devices will grow exponentially as they depend on precision manufacturing and real-time data processing. Considering the growing investments in smart grids, renewable energy, and connected infrastructure, this provides a lucrative opportunity for OT providers. Along with this, the increasing requirement for remote monitoring solutions as well as IIoT-based asset management will provide a lucrative market landscape throughout 2024-2032 across horizontal and vertical industries.
Challenges:
Interoperability Challenges in Operational Technology IT OT Integration Compliance Data Privacy and Wireless Adoption Barriers
Another important challenge is the lack of interoperability between IT and OT systems. While many industries are beginning their transformations by adopting a mix of cloud computing, AI-enabled analytics, and IoT-driven monitoring within manufacturing and other OT infrastructure, bridging the gap between the new solutions and the existing OT environment remains a challenge. Regulatory compliance and data privacy concerns are also stumbling blocks, especially in highly regulated industries such as healthcare, energy, and aerospace. The slow adoption of wireless OT in mission-critical sectors owing to network reliability and latency concerns continues to constrain the quicker scalability of contemporary OT solutions.
By Components
In 2023, Computer Numerical Control (CNC) systems accounted for the largest share of operational technology, as they are one of the most broadly adopted technologies in precision manufacturing and automation of manufacturing processes. CNC machines have a broad application in the automotive, aerospace, machine manufacture, and electronics industries, where it is essential to maintain high precision and repeatability, and efficiency demand is also high. In addition, the increasing transition to Industry 4.0, smart factories, and digital twin technologies also contributed to higher demand for CNC systems used for real-time monitoring and predictive maintenance. It was also helped by developments in multi-axis CNC machines & hybrid CNC (additive & subtractive manufacturing) and AI-driven automation.
Building Management Systems represents the fastest-growing category in terms of CAGR from 2024-2032. With authorities across the globe implementing stricter energy regulations and green building certifications (LEED, BREEAM), BMS has emerged as an attractive solution with a wide deployment potential (Nativi et al, 2020). IoT, Artificial Intelligence (AI) driven Automation, along with Cloud-Based Automated Building Analytics brings smartness to a BMS, in terms of efficiency, by monitoring every BMS component from a central location and smarter with real-time insights into HVAC, lighting, and security systems. BMS market growth is further accelerated by rapid urbanization, expansion of cities, and rising building automation in commercial and residential spaces respectively.
By Technology
In 2023, the Operational Technology (OT) market has been driven by Wired technology because of its reliability, stability, and security, which are essential for any industrial application. Oil & gas, manufacturing, energy & power, and aerospace & defense sectors use wired SCADA, DCS, and CNC systems, as these industries are latency-sensitive and require continuous operations. However, mission-critical processes where any signal interference, data transmission, or security breach may lead to huge operational and financial loss prefer wired networks, such as Ethernet, PROFIBUS, and Modbus. Traditional industries have relied heavily on an established infrastructure, and wired systems help to maintain that status quo since replacing these networks will often lead to significant downtime and prohibitive costs.
Wireless technology is projected to grow at the fastest rate from 2024 to 2032 owing to the growing industrial IoT (IIoT) adoption, 5G, cloud-based solutions, and AI-driven automation. Industrial verticals are transitioning to Wi-Fi, LPWAN, Zigbee, and private 5G networks for remote monitoring, predictive maintenance, and asset tracking due to the requirement for flexibility, scalability, and low-cost solutions. Deployment of wireless for smart factories, smart grids, and connected infrastructure will ramp up wireless even quicker. Also, the increasing use of cybersecurity and data encryption technologies to avert security threats of wireless networks is providing it an edge as a suitable substitute to wired systems in the contemporary industrial environment.
By Industry
In 2023, the operational Technology (OT) market was led by the Oil & Gas sector (with 19.45% of the total market share) owing to the extensive use of SCADA, DCS, and remote monitoring systems for upstream, midstream, and downstream operations. The company's pipeline monitoring, asset management, and real-time analysis of handling huge operational data are other complex operational requirements of the industry that create the demand for using highly reliable and secure OT infrastructure. The sector is also governed as a result of increased expenditure in refinery automation, predictive maintenance, and digital oilfield technologies. Most of the Oil & Gas companies are also implementing AI-powered analytics, IIoT-based remote sensors, and Cyber Security Solutions, to improve efficiencies and lower operational risks.
The Semiconductor & Electronics industry is expected to grow with the fastest CAGR (2024-2032). The increasing number of smart factories, the miniaturization trend of the semiconductor chips, and the growing adaptation of Industry 4.0 are driving semiconductor manufacturing to integrate MES, SCADA, and advanced robotics. The growth in this sector is also fuelled by the rising demand for AI chipsets, IoT devices, and 5G infrastructure. Semiconductor manufacturing is heavily funded by governments around the world to reduce reliance on imports and to boost domestic chip production even further, which is also accelerating the market growth. Cleanroom automation, machine vision, and AI-based defect detection will continue to propel fast-paced OT solution adoption in this sector.
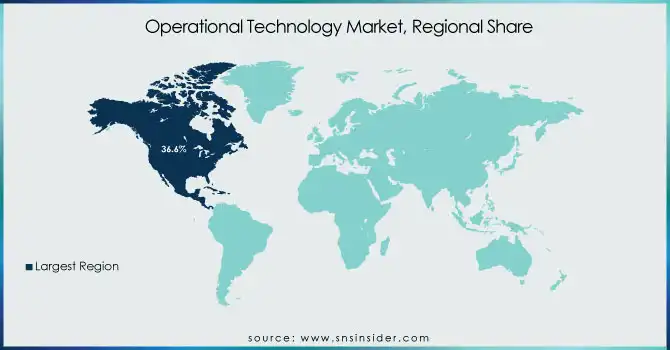
In 2023, North America's dominance with 36.6% of the global Operational Technology (OT) market share owing to a rich industrial automation ecosystem, adoption of advanced manufacturing technologies, and large investments in cybersecurity and IIoT in the region. A region that includes major players like Rockwell Automation, Emerson Electric, and General Electric (GE) a significant investment has been in building OT infrastructure. Besides this, SCADA, DCS, and MES solutions can also help manufacturing units optimize their processes–especially in countries like the U.S. and Canada, which have a stronghold on industries such as oil & gas, aerospace & defense, and semiconductors. The Biden administration's CHIPS Act incorporated industrial cybersecurity provisions in a bid to increase domestic semiconductor production supply chain resiliency, which has also contributed to accelerating OT deployment in chip manufacturing facilities.
Asia-Pacific region is projected to register the fastest CAGR from 2024-2032, on account of rapid industrialization, the emergence of smart factories, government-backed infrastructure projects coupled with investments in semiconductor and electronics manufacturing. OT is being built at the forefront in countries such as China, Japan, South Korea, and India. Market growth is being accelerated by China’s “Made in China 2025” strategy and large investments by companies like Huawei, Foxconn, and SMIC in automation and IIoT-driven manufacturing. More precision manufacturing is in store, as Japan’s Toyota and Mitsubishi Electric combine AI-aided CNC machines and digital twins. The semiconductor fabs of South Korea’s Samsung and SK Hynix are expanding, depending massively on SCADA and MES for real-time process optimization. India is also seeing a rise in Building Management Systems (BMS) and smart grid solutions through its Smart Cities Mission.
Need any customization research on Operational Technology Market - Enquiry Now
Some of the major players in the Operational Technology Market are:
Siemens (SIMATIC PLCs, TIA Portal)
Schneider Electric (EcoStruxure, Modicon PLCs)
Rockwell Automation (Allen-Bradley Controllers, FactoryTalk Software)
Honeywell (Experion Process Knowledge System, ControlEdge PLCs)
ABB (Ability System 800xA, AC500 PLCs)
Emerson Electric Co (DeltaV Distributed Control System, Ovation Control System)
General Electric (Predix Platform, PACSystems Controllers)
Yokogawa Electric (CENTUM VP DCS, ProSafe-RS Safety System)
Mitsubishi Electric (MELSEC PLCs, iQ-R Series Controllers)
Omron (Sysmac Automation Platform, NX Series I/O)
Inductive Automation (Ignition SCADA, Ignition Edge)
Beckhoff Automation (TwinCAT Automation Software, CX Series Embedded PCs)
Bosch Rexroth (IndraControl PLCs, IndraDrive Drives)
Fanuc (Series 30i/31i CNCs, R-30iB Plus Robot Controller)
Delta Electronics (DVP Series PLCs, ASDA Servo Drives)
In October 2024, Siemens and ServiceNow joined forces to integrate generative AI and cybersecurity into shopfloor operations, enhancing automation and resilience in industrial environments.
In February 2025, Schneider Electric upgrades its SCADAPack™ RTUs with advanced cybersecurity features to strengthen operational technology (OT) security in critical infrastructure sectors like water and energy.
In August 2024, Rockwell Automation introduced upgraded Industrial Data Centers with enhanced cybersecurity and virtualization, enabling secure and efficient data management for modern OT environments.
Report Attributes | Details |
---|---|
Market Size in 2023 | USD 179.56 Billion |
Market Size by 2032 | USD 369.64 Billion |
CAGR | CAGR of 8.38% From 2024 to 2032 |
Base Year | 2023 |
Forecast Period | 2024-2032 |
Historical Data | 2020-2022 |
Report Scope & Coverage | Market Size, Segments Analysis, Competitive Landscape, Regional Analysis, DROC & SWOT Analysis, Forecast Outlook |
Key Segments | • By Components (Supervisory Control and Data Acquisition (SCADA), Distributed Control System (DCS), Manufacturing Execution System (MES), Functional Safety, Building Management System (BMS), Plant Asset Management (PAM), Variable Frequency Drives (VFD), Computer Numerical Control (CNC), Others) • By Technology (Wired, Wireless) • By Industry (Oil & Gas, Pharmaceuticals, Energy & Power, Pulp & Paper, Food & Beverages, Chemicals, Metals & Mining, Automotive, Semiconductor & Electronics, Machine Manufacturing, Aerospace & Defense, Medical Devices, Others) |
Regional Analysis/Coverage | North America (US, Canada, Mexico), Europe (Eastern Europe [Poland, Romania, Hungary, Turkey, Rest of Eastern Europe] Western Europe] Germany, France, UK, Italy, Spain, Netherlands, Switzerland, Austria, Rest of Western Europe]), Asia Pacific (China, India, Japan, South Korea, Vietnam, Singapore, Australia, Rest of Asia Pacific), Middle East & Africa (Middle East [UAE, Egypt, Saudi Arabia, Qatar, Rest of Middle East], Africa [Nigeria, South Africa, Rest of Africa], Latin America (Brazil, Argentina, Colombia, Rest of Latin America) |
Company Profiles | Siemens, Schneider Electric, Rockwell Automation, Honeywell, ABB, Emerson, General Electric, Yokogawa Electric, Mitsubishi Electric, Omron, Inductive Automation, Beckhoff Automation, Bosch Rexroth, Fanuc, Delta Electronics. |
Ans: The Operational Technology Market is expected to grow at a CAGR of 8.38% during 2024-2032.
Ans: Operational Technology Market size was USD 179.56 billion in 2023 and is expected to Reach USD 369.64 billion by 2032.
Ans: The major growth factor of the Operational Technology (OT) market is the increasing adoption of industrial automation, IIoT, and cybersecurity solutions to enhance efficiency, security, and real-time decision-making in critical industries.
Ans: The Oil & Gas segment dominated the Operational Technology Market in 2023.
Ans: North America dominated the Operational Technology Market in 2023.
Table of Content
1. Introduction
1.1 Market Definition
1.2 Scope (Inclusion and Exclusions)
1.3 Research Assumptions
2. Executive Summary
2.1 Market Overview
2.2 Regional Synopsis
2.3 Competitive Summary
3. Research Methodology
3.1 Top-Down Approach
3.2 Bottom-up Approach
3.3. Data Validation
3.4 Primary Interviews
4. Market Dynamics Impact Analysis
4.1 Market Driving Factors Analysis
4.1.1 Drivers
4.1.2 Restraints
4.1.3 Opportunities
4.1.4 Challenges
4.2 PESTLE Analysis
4.3 Porter’s Five Forces Model
5. Statistical Insights and Trends Reporting
5.1 Adoption Rates
5.2 Performance & Operational Metrics
5.3 Competitive & Business Model Metrics
5.4 Workforce & Skill Metrics
6. Competitive Landscape
6.1 List of Major Companies, By Region
6.2 Market Share Analysis, By Region
6.3 Product Benchmarking
6.3.1 Product specifications and features
6.3.2 Pricing
6.4 Strategic Initiatives
6.4.1 Marketing and promotional activities
6.4.2 Distribution and Supply Chain Strategies
6.4.3 Expansion plans and new product launches
6.4.4 Strategic partnerships and collaborations
6.5 Technological Advancements
6.6 Market Positioning and Branding
7. Operational Technology Market Segmentation, By Components
7.1 Chapter Overview
7.2 Supervisory Control and Data Acquisition (SCADA)
7.2.1 Supervisory Control and Data Acquisition (SCADA) Market Trends Analysis (2020-2032)
7.2.2 Supervisory Control and Data Acquisition (SCADA) Market Size Estimates and Forecasts to 2032 (USD Billion)
7.3 Distributed Control System (DCS)
7.3.1 Distributed Control System (DCS) Market Trends Analysis (2020-2032)
7.3.2 Distributed Control System (DCS) Market Size Estimates and Forecasts to 2032 (USD Billion)
7.4 Manufacturing Execution System (MES)
7.4.1 Manufacturing Execution System (MES) Market Trends Analysis (2020-2032)
7.4.2 Manufacturing Execution System (MES) Market Size Estimates and Forecasts to 2032 (USD Billion)
7.5 Functional Safety
7.5.1 Functional Safety Market Trends Analysis (2020-2032)
7.5.2 Functional Safety Market Size Estimates and Forecasts to 2032 (USD Billion)
7.6 Building Management System (BMS)
7.6.1 Building Management System (BMS) Market Trends Analysis (2020-2032)
7.6.2 Building Management System (BMS) Market Size Estimates and Forecasts to 2032 (USD Billion)
7.7 Plant Asset Management (PAM)
7.7.1 Plant Asset Management (PAM) Market Trends Analysis (2020-2032)
7.7.2 Plant Asset Management (PAM) Market Size Estimates and Forecasts to 2032 (USD Billion)
7.8 Variable Frequency Drives (VFD)
7.8.1 Variable Frequency Drives (VFD) Market Trends Analysis (2020-2032)
7.8.2 Variable Frequency Drives (VFD) Market Size Estimates and Forecasts to 2032 (USD Billion)
7.9 Computer Numerical Control (CNC)
7.9.1 Computer Numerical Control (CNC) Market Trends Analysis (2020-2032)
7.9.2 Computer Numerical Control (CNC) Market Size Estimates and Forecasts to 2032 (USD Billion)
7.10 Others
7.10.1 Others Market Trends Analysis (2020-2032)
7.10.2 Others Market Size Estimates and Forecasts to 2032 (USD Billion)
8. Operational Technology Market Segmentation, By Technology
8.1 Chapter Overview
8.2 Wired
8.2.1 Wired Market Trends Analysis (2020-2032)
8.2.2 Wired Market Size Estimates and Forecasts to 2032 (USD Billion)
8.3 Wireless
8.3.1 Wireless Market Trends Analysis (2020-2032)
8.3.2 Wireless Market Size Estimates and Forecasts to 2032 (USD Billion)
9. Operational Technology Market Segmentation, By Industry
9.1 Chapter Overview
9.2 Oil & Gas
9.2.1 Oil & Gas Market Trends Analysis (2020-2032)
9.2.2 Oil & Gas Market Size Estimates and Forecasts to 2032 (USD Billion)
9.3 Pharmaceuticals
9.3.1 Pharmaceuticals Market Trends Analysis (2020-2032)
9.3.2 Pharmaceuticals Market Size Estimates and Forecasts to 2032 (USD Billion)
9.4 Energy & Power
9.4.1 Energy & Power Market Trends Analysis (2020-2032)
9.4.2 Energy & Power Market Size Estimates and Forecasts to 2032 (USD Billion)
9.5 Pulp & Paper
9.5.1 Pulp & Paper Market Trends Analysis (2020-2032)
9.5.2 Pulp & Paper Market Size Estimates and Forecasts to 2032 (USD Billion)
9.6 Food & Beverages
9.6.1 Food & Beverages Market Trends Analysis (2020-2032)
9.6.2 Food & Beverages Market Size Estimates and Forecasts to 2032 (USD Billion)
9.7 Chemicals
9.7.1 Chemicals Market Trends Analysis (2020-2032)
9.7.2 Chemicals Market Size Estimates and Forecasts to 2032 (USD Billion)
9.8 Metals & Mining
9.8.1 Metals & Mining Market Trends Analysis (2020-2032)
9.8.2 Metals & Mining Market Size Estimates and Forecasts to 2032 (USD Billion)
9.9 Automotive
9.9.1 Automotive Market Trends Analysis (2020-2032)
9.9.2 Automotive Market Size Estimates and Forecasts to 2032 (USD Billion)
9.10 Semiconductor & Electronics
9.10.1 Semiconductor & Electronics Market Trends Analysis (2020-2032)
9.10.2 Semiconductor & Electronics Market Size Estimates and Forecasts to 2032 (USD Billion)
9.11 Machine Manufacturing
9.11.1 Machine Manufacturing Market Trends Analysis (2020-2032)
9.11.2 Machine Manufacturing Market Size Estimates and Forecasts to 2032 (USD Billion)
9.12 Aerospace & Defense
9.12.1 Aerospace & Defense Market Trends Analysis (2020-2032)
9.12.2 Aerospace & Defense Market Size Estimates and Forecasts to 2032 (USD Billion)
9.13 Medical Devices
9.13.1 Medical Devices Market Trends Analysis (2020-2032)
9.13.2 Medical Devices Market Size Estimates and Forecasts to 2032 (USD Billion)
9.14 Others
9.14.1 Others Market Trends Analysis (2020-2032)
9.14.2 Others Market Size Estimates and Forecasts to 2032 (USD Billion)
10. Regional Analysis
10.1 Chapter Overview
10.2 North America
10.2.1 Trends Analysis
10.2.2 North America Operational Technology Market Estimates and Forecasts, by Country (2020-2032) (USD Billion)
10.2.3 North America Operational Technology Market Estimates and Forecasts, By Components (2020-2032) (USD Billion)
10.2.4 North America Operational Technology Market Estimates and Forecasts, By Technology (2020-2032) (USD Billion)
10.2.5 North America Operational Technology Market Estimates and Forecasts, By Industry (2020-2032) (USD Billion)
10.2.6 USA
10.2.6.1 USA Operational Technology Market Estimates and Forecasts, By Components (2020-2032) (USD Billion)
10.2.6.2 USA Operational Technology Market Estimates and Forecasts, By Technology (2020-2032) (USD Billion)
10.2.6.3 USA Operational Technology Market Estimates and Forecasts, By Industry (2020-2032) (USD Billion)
10.2.7 Canada
10.2.7.1 Canada Operational Technology Market Estimates and Forecasts, By Components (2020-2032) (USD Billion)
10.2.7.2 Canada Operational Technology Market Estimates and Forecasts, By Technology (2020-2032) (USD Billion)
10.2.7.3 Canada Operational Technology Market Estimates and Forecasts, By Industry (2020-2032) (USD Billion)
10.2.8 Mexico
10.2.8.1 Mexico Operational Technology Market Estimates and Forecasts, By Components (2020-2032) (USD Billion)
10.2.8.2 Mexico Operational Technology Market Estimates and Forecasts, By Technology (2020-2032) (USD Billion)
10.2.8.3 Mexico Operational Technology Market Estimates and Forecasts, By Industry (2020-2032) (USD Billion)
10.3 Europe
10.3.1 Eastern Europe
10.3.1.1 Trends Analysis
10.3.1.2 Eastern Europe Operational Technology Market Estimates and Forecasts, by Country (2020-2032) (USD Billion)
10.3.1.3 Eastern Europe Operational Technology Market Estimates and Forecasts, By Components (2020-2032) (USD Billion)
10.3.1.4 Eastern Europe Operational Technology Market Estimates and Forecasts, By Technology (2020-2032) (USD Billion)
10.3.1.5 Eastern Europe Operational Technology Market Estimates and Forecasts, By Industry (2020-2032) (USD Billion)
10.3.1.6 Poland
10.3.1.6.1 Poland Operational Technology Market Estimates and Forecasts, By Components (2020-2032) (USD Billion)
10.3.1.6.2 Poland Operational Technology Market Estimates and Forecasts, By Technology (2020-2032) (USD Billion)
10.3.1.6.3 Poland Operational Technology Market Estimates and Forecasts, By Industry (2020-2032) (USD Billion)
10.3.1.7 Romania
10.3.1.7.1 Romania Operational Technology Market Estimates and Forecasts, By Components (2020-2032) (USD Billion)
10.3.1.7.2 Romania Operational Technology Market Estimates and Forecasts, By Technology (2020-2032) (USD Billion)
10.3.1.7.3 Romania Operational Technology Market Estimates and Forecasts, By Industry (2020-2032) (USD Billion)
10.3.1.8 Hungary
10.3.1.8.1 Hungary Operational Technology Market Estimates and Forecasts, By Components (2020-2032) (USD Billion)
10.3.1.8.2 Hungary Operational Technology Market Estimates and Forecasts, By Technology (2020-2032) (USD Billion)
10.3.1.8.3 Hungary Operational Technology Market Estimates and Forecasts, By Industry (2020-2032) (USD Billion)
10.3.1.9 Turkey
10.3.1.9.1 Turkey Operational Technology Market Estimates and Forecasts, By Components (2020-2032) (USD Billion)
10.3.1.9.2 Turkey Operational Technology Market Estimates and Forecasts, By Technology (2020-2032) (USD Billion)
10.3.1.9.3 Turkey Operational Technology Market Estimates and Forecasts, By Industry (2020-2032) (USD Billion)
10.3.1.10 Rest of Eastern Europe
10.3.1.10.1 Rest of Eastern Europe Operational Technology Market Estimates and Forecasts, By Components (2020-2032) (USD Billion)
10.3.1.10.2 Rest of Eastern Europe Operational Technology Market Estimates and Forecasts, By Technology (2020-2032) (USD Billion)
10.3.1.10.3 Rest of Eastern Europe Operational Technology Market Estimates and Forecasts, By Industry (2020-2032) (USD Billion)
10.3.2 Western Europe
10.3.2.1 Trends Analysis
10.3.2.2 Western Europe Operational Technology Market Estimates and Forecasts, by Country (2020-2032) (USD Billion)
10.3.2.3 Western Europe Operational Technology Market Estimates and Forecasts, By Components (2020-2032) (USD Billion)
10.3.2.4 Western Europe Operational Technology Market Estimates and Forecasts, By Technology (2020-2032) (USD Billion)
10.3.2.5 Western Europe Operational Technology Market Estimates and Forecasts, By Industry (2020-2032) (USD Billion)
10.3.2.6 Germany
10.3.2.6.1 Germany Operational Technology Market Estimates and Forecasts, By Components (2020-2032) (USD Billion)
10.3.2.6.2 Germany Operational Technology Market Estimates and Forecasts, By Technology (2020-2032) (USD Billion)
10.3.2.6.3 Germany Operational Technology Market Estimates and Forecasts, By Industry (2020-2032) (USD Billion)
10.3.2.7 France
10.3.2.7.1 France Operational Technology Market Estimates and Forecasts, By Components (2020-2032) (USD Billion)
10.3.2.7.2 France Operational Technology Market Estimates and Forecasts, By Technology (2020-2032) (USD Billion)
10.3.2.7.3 France Operational Technology Market Estimates and Forecasts, By Industry (2020-2032) (USD Billion)
10.3.2.8 UK
10.3.2.8.1 UK Operational Technology Market Estimates and Forecasts, By Components (2020-2032) (USD Billion)
10.3.2.8.2 UK Operational Technology Market Estimates and Forecasts, By Technology (2020-2032) (USD Billion)
10.3.2.8.3 UK Operational Technology Market Estimates and Forecasts, By Industry (2020-2032) (USD Billion)
10.3.2.9 Italy
10.3.2.9.1 Italy Operational Technology Market Estimates and Forecasts, By Components (2020-2032) (USD Billion)
10.3.2.9.2 Italy Operational Technology Market Estimates and Forecasts, By Technology (2020-2032) (USD Billion)
10.3.2.9.3 Italy Operational Technology Market Estimates and Forecasts, By Industry (2020-2032) (USD Billion)
10.3.2.10 Spain
10.3.2.10.1 Spain Operational Technology Market Estimates and Forecasts, By Components (2020-2032) (USD Billion)
10.3.2.10.2 Spain Operational Technology Market Estimates and Forecasts, By Technology (2020-2032) (USD Billion)
10.3.2.10.3 Spain Operational Technology Market Estimates and Forecasts, By Industry (2020-2032) (USD Billion)
10.3.2.11 Netherlands
10.3.2.11.1 Netherlands Operational Technology Market Estimates and Forecasts, By Components (2020-2032) (USD Billion)
10.3.2.11.2 Netherlands Operational Technology Market Estimates and Forecasts, By Technology (2020-2032) (USD Billion)
10.3.2.11.3 Netherlands Operational Technology Market Estimates and Forecasts, By Industry (2020-2032) (USD Billion)
10.3.2.12 Switzerland
10.3.2.12.1 Switzerland Operational Technology Market Estimates and Forecasts, By Components (2020-2032) (USD Billion)
10.3.2.12.2 Switzerland Operational Technology Market Estimates and Forecasts, By Technology (2020-2032) (USD Billion)
10.3.2.12.3 Switzerland Operational Technology Market Estimates and Forecasts, By Industry (2020-2032) (USD Billion)
10.3.2.13 Austria
10.3.2.13.1 Austria Operational Technology Market Estimates and Forecasts, By Components (2020-2032) (USD Billion)
10.3.2.13.2 Austria Operational Technology Market Estimates and Forecasts, By Technology (2020-2032) (USD Billion)
10.3.2.13.3 Austria Operational Technology Market Estimates and Forecasts, By Industry (2020-2032) (USD Billion)
10.3.2.14 Rest of Western Europe
10.3.2.14.1 Rest of Western Europe Operational Technology Market Estimates and Forecasts, By Components (2020-2032) (USD Billion)
10.3.2.14.2 Rest of Western Europe Operational Technology Market Estimates and Forecasts, By Technology (2020-2032) (USD Billion)
10.3.2.14.3 Rest of Western Europe Operational Technology Market Estimates and Forecasts, By Industry (2020-2032) (USD Billion)
10.4 Asia Pacific
10.4.1 Trends Analysis
10.4.2 Asia Pacific Operational Technology Market Estimates and Forecasts, by Country (2020-2032) (USD Billion)
10.4.3 Asia Pacific Operational Technology Market Estimates and Forecasts, By Components (2020-2032) (USD Billion)
10.4.4 Asia Pacific Operational Technology Market Estimates and Forecasts, By Technology (2020-2032) (USD Billion)
10.4.5 Asia Pacific Operational Technology Market Estimates and Forecasts, By Industry (2020-2032) (USD Billion)
10.4.6 China
10.4.6.1 China Operational Technology Market Estimates and Forecasts, By Components (2020-2032) (USD Billion)
10.4.6.2 China Operational Technology Market Estimates and Forecasts, By Technology (2020-2032) (USD Billion)
10.4.6.3 China Operational Technology Market Estimates and Forecasts, By Industry (2020-2032) (USD Billion)
10.4.7 India
10.4.7.1 India Operational Technology Market Estimates and Forecasts, By Components (2020-2032) (USD Billion)
10.4.7.2 India Operational Technology Market Estimates and Forecasts, By Technology (2020-2032) (USD Billion)
10.4.7.3 India Operational Technology Market Estimates and Forecasts, By Industry (2020-2032) (USD Billion)
10.4.8 Japan
10.4.8.1 Japan Operational Technology Market Estimates and Forecasts, By Components (2020-2032) (USD Billion)
10.4.8.2 Japan Operational Technology Market Estimates and Forecasts, By Technology (2020-2032) (USD Billion)
10.4.8.3 Japan Operational Technology Market Estimates and Forecasts, By Industry (2020-2032) (USD Billion)
10.4.9 South Korea
10.4.9.1 South Korea Operational Technology Market Estimates and Forecasts, By Components (2020-2032) (USD Billion)
10.4.9.2 South Korea Operational Technology Market Estimates and Forecasts, By Technology (2020-2032) (USD Billion)
10.4.9.3 South Korea Operational Technology Market Estimates and Forecasts, By Industry (2020-2032) (USD Billion)
10.4.10 Vietnam
10.4.10.1 Vietnam Operational Technology Market Estimates and Forecasts, By Components (2020-2032) (USD Billion)
10.4.10.2 Vietnam Operational Technology Market Estimates and Forecasts, By Technology (2020-2032) (USD Billion)
10.4.10.3 Vietnam Operational Technology Market Estimates and Forecasts, By Industry (2020-2032) (USD Billion)
10.4.11 Singapore
10.4.11.1 Singapore Operational Technology Market Estimates and Forecasts, By Components (2020-2032) (USD Billion)
10.4.11.2 Singapore Operational Technology Market Estimates and Forecasts, By Technology (2020-2032) (USD Billion)
10.4.11.3 Singapore Operational Technology Market Estimates and Forecasts, By Industry (2020-2032) (USD Billion)
10.4.12 Australia
10.4.12.1 Australia Operational Technology Market Estimates and Forecasts, By Components (2020-2032) (USD Billion)
10.4.12.2 Australia Operational Technology Market Estimates and Forecasts, By Technology (2020-2032) (USD Billion)
10.4.12.3 Australia Operational Technology Market Estimates and Forecasts, By Industry (2020-2032) (USD Billion)
10.4.13 Rest of Asia Pacific
10.4.13.1 Rest of Asia Pacific Operational Technology Market Estimates and Forecasts, By Components (2020-2032) (USD Billion)
10.4.13.2 Rest of Asia Pacific Operational Technology Market Estimates and Forecasts, By Technology (2020-2032) (USD Billion)
10.4.13.3 Rest of Asia Pacific Operational Technology Market Estimates and Forecasts, By Industry (2020-2032) (USD Billion)
10.5 Middle East and Africa
10.5.1 Middle East
10.5.1.1 Trends Analysis
10.5.1.2 Middle East Operational Technology Market Estimates and Forecasts, by Country (2020-2032) (USD Billion)
10.5.1.3 Middle East Operational Technology Market Estimates and Forecasts, By Components (2020-2032) (USD Billion)
10.5.1.4 Middle East Operational Technology Market Estimates and Forecasts, By Technology (2020-2032) (USD Billion)
10.5.1.5 Middle East Operational Technology Market Estimates and Forecasts, By Industry (2020-2032) (USD Billion)
10.5.1.6 UAE
10.5.1.6.1 UAE Operational Technology Market Estimates and Forecasts, By Components (2020-2032) (USD Billion)
10.5.1.6.2 UAE Operational Technology Market Estimates and Forecasts, By Technology (2020-2032) (USD Billion)
10.5.1.6.3 UAE Operational Technology Market Estimates and Forecasts, By Industry (2020-2032) (USD Billion)
10.5.1.7 Egypt
10.5.1.7.1 Egypt Operational Technology Market Estimates and Forecasts, By Components (2020-2032) (USD Billion)
10.5.1.7.2 Egypt Operational Technology Market Estimates and Forecasts, By Technology (2020-2032) (USD Billion)
10.5.1.7.3 Egypt Operational Technology Market Estimates and Forecasts, By Industry (2020-2032) (USD Billion)
10.5.1.8 Saudi Arabia
10.5.1.8.1 Saudi Arabia Operational Technology Market Estimates and Forecasts, By Components (2020-2032) (USD Billion)
10.5.1.8.2 Saudi Arabia Operational Technology Market Estimates and Forecasts, By Technology (2020-2032) (USD Billion)
10.5.1.8.3 Saudi Arabia Operational Technology Market Estimates and Forecasts, By Industry (2020-2032) (USD Billion)
10.5.1.9 Qatar
10.5.1.9.1 Qatar Operational Technology Market Estimates and Forecasts, By Components (2020-2032) (USD Billion)
10.5.1.9.2 Qatar Operational Technology Market Estimates and Forecasts, By Technology (2020-2032) (USD Billion)
10.5.1.9.3 Qatar Operational Technology Market Estimates and Forecasts, By Industry (2020-2032) (USD Billion)
10.5.1.10 Rest of Middle East
10.5.1.10.1 Rest of Middle East Operational Technology Market Estimates and Forecasts, By Components (2020-2032) (USD Billion)
10.5.1.10.2 Rest of Middle East Operational Technology Market Estimates and Forecasts, By Technology (2020-2032) (USD Billion)
10.5.1.10.3 Rest of Middle East Operational Technology Market Estimates and Forecasts, By Industry (2020-2032) (USD Billion)
10.5.2 Africa
10.5.2.1 Trends Analysis
10.5.2.2 Africa Operational Technology Market Estimates and Forecasts, by Country (2020-2032) (USD Billion)
10.5.2.3 Africa Operational Technology Market Estimates and Forecasts, By Components (2020-2032) (USD Billion)
10.5.2.4 Africa Operational Technology Market Estimates and Forecasts, By Technology (2020-2032) (USD Billion)
10.5.2.5 Africa Operational Technology Market Estimates and Forecasts, By Industry (2020-2032) (USD Billion)
10.5.2.6 South Africa
10.5.2.6.1 South Africa Operational Technology Market Estimates and Forecasts, By Components (2020-2032) (USD Billion)
10.5.2.6.2 South Africa Operational Technology Market Estimates and Forecasts, By Technology (2020-2032) (USD Billion)
10.5.2.6.3 South Africa Operational Technology Market Estimates and Forecasts, By Industry (2020-2032) (USD Billion)
10.5.2.7 Nigeria
10.5.2.7.1 Nigeria Operational Technology Market Estimates and Forecasts, By Components (2020-2032) (USD Billion)
10.5.2.7.2 Nigeria Operational Technology Market Estimates and Forecasts, By Technology (2020-2032) (USD Billion)
10.5.2.7.3 Nigeria Operational Technology Market Estimates and Forecasts, By Industry (2020-2032) (USD Billion)
10.5.2.8 Rest of Africa
10.5.2.8.1 Rest of Africa Operational Technology Market Estimates and Forecasts, By Components (2020-2032) (USD Billion)
10.5.2.8.2 Rest of Africa Operational Technology Market Estimates and Forecasts, By Technology (2020-2032) (USD Billion)
10.5.2.8.3 Rest of Africa Operational Technology Market Estimates and Forecasts, By Industry (2020-2032) (USD Billion)
10.6 Latin America
10.6.1 Trends Analysis
10.6.2 Latin America Operational Technology Market Estimates and Forecasts, by Country (2020-2032) (USD Billion)
10.6.3 Latin America Operational Technology Market Estimates and Forecasts, By Components (2020-2032) (USD Billion)
10.6.4 Latin America Operational Technology Market Estimates and Forecasts, By Technology (2020-2032) (USD Billion)
10.6.5 Latin America Operational Technology Market Estimates and Forecasts, By Industry (2020-2032) (USD Billion)
10.6.6 Brazil
10.6.6.1 Brazil Operational Technology Market Estimates and Forecasts, By Components (2020-2032) (USD Billion)
10.6.6.2 Brazil Operational Technology Market Estimates and Forecasts, By Technology (2020-2032) (USD Billion)
10.6.6.3 Brazil Operational Technology Market Estimates and Forecasts, By Industry (2020-2032) (USD Billion)
10.6.7 Argentina
10.6.7.1 Argentina Operational Technology Market Estimates and Forecasts, By Components (2020-2032) (USD Billion)
10.6.7.2 Argentina Operational Technology Market Estimates and Forecasts, By Technology (2020-2032) (USD Billion)
10.6.7.3 Argentina Operational Technology Market Estimates and Forecasts, By Industry (2020-2032) (USD Billion)
10.6.8 Colombia
10.6.8.1 Colombia Operational Technology Market Estimates and Forecasts, By Components (2020-2032) (USD Billion)
10.6.8.2 Colombia Operational Technology Market Estimates and Forecasts, By Technology (2020-2032) (USD Billion)
10.6.8.3 Colombia Operational Technology Market Estimates and Forecasts, By Industry (2020-2032) (USD Billion)
10.6.9 Rest of Latin America
10.6.9.1 Rest of Latin America Operational Technology Market Estimates and Forecasts, By Components (2020-2032) (USD Billion)
10.6.9.2 Rest of Latin America Operational Technology Market Estimates and Forecasts, By Technology (2020-2032) (USD Billion)
10.6.9.3 Rest of Latin America Operational Technology Market Estimates and Forecasts, By Industry (2020-2032) (USD Billion)
11. Company Profiles
11.1 Siemens.
11.1.1 Company Overview
11.1.2 Financial
11.1.3 Products/ Services Offered
11.1.4 SWOT Analysis
11.2 Schneider Electric
11.2.1 Company Overview
11.2.2 Financial
11.2.3 Products/ Services Offered
11.2.4 SWOT Analysis
11.3 Rockwell Automation
11.3.1 Company Overview
11.3.2 Financial
11.3.3 Products/ Services Offered
11.3.4 SWOT Analysis
11.4 Honeywell
11.4.1 Company Overview
11.4.2 Financial
11.4.3 Products/ Services Offered
11.4.4 SWOT Analysis
11.5 ABB
11.5.1 Company Overview
11.5.2 Financial
11.5.3 Products/ Services Offered
11.5.4 SWOT Analysis
11.6 Emerson
11.6.1 Company Overview
11.6.2 Financial
11.6.3 Products/ Services Offered
11.6.4 SWOT Analysis
11.7 General Electric
11.7.1 Company Overview
11.7.2 Financial
11.7.3 Products/ Services Offered
11.7.4 SWOT Analysis
11.8 Yokogawa Electric.
11.8.1 Company Overview
11.8.2 Financial
11.8.3 Products/ Services Offered
11.8.4 SWOT Analysis
11.9 Mitsubishi Electric
11.9.1 Company Overview
11.9.2 Financial
11.9.3 Products/ Services Offered
11.9.4 SWOT Analysis
11.10 Omron
11.10.1 Company Overview
11.10.2 Financial
11.10.3 Products/ Services Offered
11.10.4 SWOT Analysis
12. Use Cases and Best Practices
13. Conclusion
An accurate research report requires proper strategizing as well as implementation. There are multiple factors involved in the completion of good and accurate research report and selecting the best methodology to compete the research is the toughest part. Since the research reports we provide play a crucial role in any company’s decision-making process, therefore we at SNS Insider always believe that we should choose the best method which gives us results closer to reality. This allows us to reach at a stage wherein we can provide our clients best and accurate investment to output ratio.
Each report that we prepare takes a timeframe of 350-400 business hours for production. Starting from the selection of titles through a couple of in-depth brain storming session to the final QC process before uploading our titles on our website we dedicate around 350 working hours. The titles are selected based on their current market cap and the foreseen CAGR and growth.
The 5 steps process:
Step 1: Secondary Research:
Secondary Research or Desk Research is as the name suggests is a research process wherein, we collect data through the readily available information. In this process we use various paid and unpaid databases which our team has access to and gather data through the same. This includes examining of listed companies’ annual reports, Journals, SEC filling etc. Apart from this our team has access to various associations across the globe across different industries. Lastly, we have exchange relationships with various university as well as individual libraries.
Step 2: Primary Research
When we talk about primary research, it is a type of study in which the researchers collect relevant data samples directly, rather than relying on previously collected data. This type of research is focused on gaining content specific facts that can be sued to solve specific problems. Since the collected data is fresh and first hand therefore it makes the study more accurate and genuine.
We at SNS Insider have divided Primary Research into 2 parts.
Part 1 wherein we interview the KOLs of major players as well as the upcoming ones across various geographic regions. This allows us to have their view over the market scenario and acts as an important tool to come closer to the accurate market numbers. As many as 45 paid and unpaid primary interviews are taken from both the demand and supply side of the industry to make sure we land at an accurate judgement and analysis of the market.
This step involves the triangulation of data wherein our team analyses the interview transcripts, online survey responses and observation of on filed participants. The below mentioned chart should give a better understanding of the part 1 of the primary interview.
Part 2: In this part of primary research the data collected via secondary research and the part 1 of the primary research is validated with the interviews from individual consultants and subject matter experts.
Consultants are those set of people who have at least 12 years of experience and expertise within the industry whereas Subject Matter Experts are those with at least 15 years of experience behind their back within the same space. The data with the help of two main processes i.e., FGDs (Focused Group Discussions) and IDs (Individual Discussions). This gives us a 3rd party nonbiased primary view of the market scenario making it a more dependable one while collation of the data pointers.
Step 3: Data Bank Validation
Once all the information is collected via primary and secondary sources, we run that information for data validation. At our intelligence centre our research heads track a lot of information related to the market which includes the quarterly reports, the daily stock prices, and other relevant information. Our data bank server gets updated every fortnight and that is how the information which we collected using our primary and secondary information is revalidated in real time.
Step 4: QA/QC Process
After all the data collection and validation our team does a final level of quality check and quality assurance to get rid of any unwanted or undesired mistakes. This might include but not limited to getting rid of the any typos, duplication of numbers or missing of any important information. The people involved in this process include technical content writers, research heads and graphics people. Once this process is completed the title gets uploader on our platform for our clients to read it.
Step 5: Final QC/QA Process:
This is the last process and comes when the client has ordered the study. In this process a final QA/QC is done before the study is emailed to the client. Since we believe in giving our clients a good experience of our research studies, therefore, to make sure that we do not lack at our end in any way humanly possible we do a final round of quality check and then dispatch the study to the client.
Key Segments:
By Components
Supervisory Control and Data Acquisition (SCADA)
Distributed Control System (DCS)
Manufacturing Execution System (MES)
Functional Safety
Building Management System (BMS)
Plant Asset Management (PAM)
Variable Frequency Drives (VFD)
Computer Numerical Control (CNC)
Others
By Technology
Wired
Wireless
By Industry
Oil & Gas
Pharmaceuticals
Energy & Power
Pulp & Paper
Food & Beverages
Chemicals
Metals & Mining
Automotive
Semiconductor & Electronics
Machine Manufacturing
Aerospace & Defense
Medical Devices
Others
Request for Segment Customization as per your Business Requirement: Segment Customization Request
Regional Coverage:
North America
US
Canada
Mexico
Europe
Eastern Europe
Poland
Romania
Hungary
Turkey
Rest of Eastern Europe
Western Europe
Germany
France
UK
Italy
Spain
Netherlands
Switzerland
Austria
Rest of Western Europe
Asia Pacific
China
India
Japan
South Korea
Vietnam
Singapore
Australia
Rest of Asia Pacific
Middle East & Africa
Middle East
UAE
Egypt
Saudi Arabia
Qatar
Rest of Middle East
Africa
Nigeria
South Africa
Rest of Africa
Latin America
Brazil
Argentina
Colombia
Rest of Latin America
Request for Country Level Research Report: Country Level Customization Request
Available Customization
With the given market data, SNS Insider offers customization as per the company’s specific needs. The following customization options are available for the report:
Detailed Volume Analysis
Criss-Cross segment analysis (e.g. Product X Application)
Competitive Product Benchmarking
Geographic Analysis
Additional countries in any of the regions
Customized Data Representation
Detailed analysis and profiling of additional market players
The Agriculture 4.0 Market size was valued at USD 68 Billion in 2023 and is expected to reach USD 176.79 Billion by 2032 with a growing CAGR of 11.2% Over the Forecast period of 2024-2032.
The ReRAM Market size was valued at USD 670.73 million in 2023 and is expected to grow to USD 3997.53 million by 2032 and grow at a CAGR of 21.94% over the forecast period of 2024-2032.
The Portable Speakers Market Size was valued at USD 6.3 billion in 2023 and is expected to reach USD 15.3 billion by 2031 and grow at a CAGR of 11.6% over the forecast period 2024-2031.
The Fire Protection System Market Size was valued at USD 67.35 billion in 2023, is projected to grow at 6.25% CAGR to reach USD 116.17 billion by 2032.
Broadcast Equipment Market was valued at USD 5.30 billion in 2023 and is expected to reach USD 9.15 billion by 2032, growing at a CAGR of 6.29% from 2024-2032.
The Tilt Sensor Market Size was valued at USD 267.42 Million in 2023 and is expected to grow at a CAGR of 9.68% to reach USD 614.13 Million by 2032.
Hi! Click one of our member below to chat on Phone