Open RAN Market Report Scope & Overview:
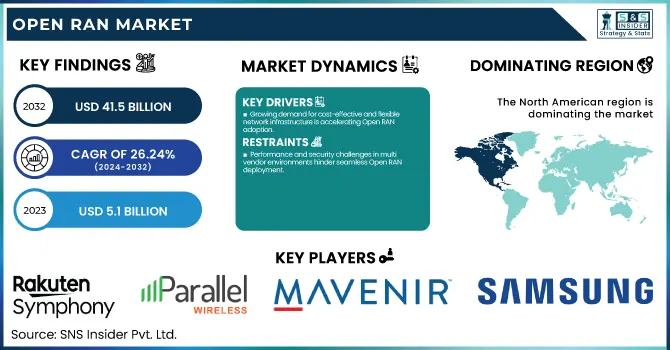
The Open RAN Market was valued at USD 5.1 Billion in 2023 and is expected to reach USD 41.5 Billion by 2032, growing at a CAGR of 26.24% from 2024-2032.
To Get more information on Open RAN Market - Request Free Sample Report
The adoption of Open RAN solutions among telecom operators is accelerating as they seek more flexible, cost-effective, and vendor-neutral network architectures. Leading players like Vodafone, Rakuten, and Telefonica are actively deploying Open RAN to reduce dependency on traditional equipment providers. The expansion of Open RAN network infrastructure is particularly strong in North America, Europe, and Asia-Pacific, supported by government initiatives and private sector investments. Between 2020 and 2023, investments in Open RAN R&D and deployment surged, with major telecom companies and tech firms collaborating to enhance performance, security, and scalability. Additionally, the demand for Open RAN interoperability and testing services is growing, as operators focus on ensuring seamless integration between multi-vendor components. The report further highlights new trends, including AI-driven network optimization, private 5G Open RAN deployments, and increasing collaborations between traditional telecom vendors and cloud-based companies.
Open RAN Market Dynamics
Drivers
-
Growing demand for cost-effective and flexible network infrastructure is accelerating Open RAN adoption.
The rapid growth of Open RAN is motivated by the demand for cheaper, bigger, and vendor-neutral network solutions. Open RAN overhauls traditional radio access networks, which are expensive and reliant on proprietary hardware, by allowing telecom operators to mix and match components from multiple vendors, thus lowering costs and increasing operational flexibility. As 5G rollouts are ramping up, operators are increasingly looking for cloud-native and software-driven architectures to enable greater network agility, while lowering both capital and operational expenditures. Countries such as the U.S., Europe, and Japan have government and regulatory interventions that will encourage Open RAN for the diversity of supply chain in telecom. All these factors put together, drive the increasing deployment of Open RAN solutions in telecom networks around the world.
Restraints
-
Performance and security challenges in multi-vendor environments hinder seamless Open RAN deployment.
While Open RAN is beneficial, the multi-vendor Open RAN approach raises performance and security issues. In contrast to tightly integrated and well-optimized traditional RANs, Open RAN requires the diverse units carried out by different vendors to work seamlessly together; this can result in latency problems, inefficient networks, and more opportunities for cyber attacks. due to the lack of standardized security protocol, Open RAN components can be vulnerable to network attacks. Moreover, telecom applications require thorough testing and validation processes for reliability, scalability, and other factors like hands-off between the network elements. Such challenges limit the large-scale deployment of Open RAN, especially in mission-critical use cases needing high-performance connectivity.
Opportunity
-
Government and private sector investments are fueling the growth and development of Open RAN solutions.
Governments and private sector players across the globe are spending huge on Open RAN development to improve telecom facilities and minimize the dependence on conventional network equipment vendor. For instance, market growth enabling policies such as Open RAN funding by the U.S. Federal Communications Commission, subsidies for 5G Open RAN projects by Japan and various digital transformation programs by the European Union are accelerating the market growth. To innovate in Open RAN solutions, telecom operators are entering into new partnerships with tech firms such as Intel, Qualcomm, and NVIDIA. Growing inclination towards cloud-native and AI-powered network architectures offers attractive opportunities to both new and current actors in the Open RAN domain to increase offerings within the entire service portfolio.
Challenges
-
High initial deployment costs are slowing Open RAN adoption in developing markets.
The upfront costs of deploying Open RAN are still high, restricting the market in developing countries while promising future savings. Many operators in regions such as Africa, Latin America, and even some parts of Southeast Asia find it exceedingly difficult to replace existing legacy infrastructure with Open RAN solutions within their budget due to their lack of a skilled workforce and not much support from the government. Moreover, telcos in these markets still depend on legacy vendors such as Huawei, Ericsson and Nokia — advancing the Open RAN transition challenges. Providing game-changing global performance and functional equivalence with legacy standards whilst providing a faster rollout and a more flexible deployment model are the only ways market players can overcome this barrier to the adoption of Open RAN in high-growth emerging economies until financial incentives or investment training schemes are available.
Open RAN Market Segmentation Analysis
By Component
In 2023, the hardware segment dominated the market and accounted for a significant revenue share. Open RAN hardware refers to the physical implementation that is in the radio access network of an open RAN architecture. Typical hardware components consist of BBUs, RRUs, vRAN, servers, and more. O-RAN compatible hardware enables operators to migrate to 4G/3G/2G legacy systems to fully virtualized Open RAN solutions.
The services segment is expected to register the fastest CAGR over the forecast period. Within the services segment, the deployment & implementation, consulting, and support & maintenance segments are sub-classified. Though O-RAN offers several benefits, this process may require sufficient support from the network operators to handle the network effectively as the technology is relatively ahead of its time.
By Unit
In 2023, the radio unit segment dominated the market and represented significant revenue share. The radio unit is like a hardware component of the open RAN architecture. It transmits the RF signals, receives them, amplifies them, and digitizes them. The radio unit is typically closer to or part of the antenna. Radio is a vital component in the O-RAN market as it facilitates the wireless path between the user and the Core Network.
The distributed unit segment is anticipated to register the fastest CAGR during the forecast period. A distribution unit takes a signal from a particular form and converts that signal to another form, it collects all the data and passes it on to the communication channel. It distributes the radio signal into the network and takes a digitized radio signal from the radio unit.
By Deployment
In 2023, the hybrid cloud segment dominated the market and held the largest market share. The hybrid cloud nature of Open RAN deployment mixes on-premises and cloud infrastructure to balance efficient network performance with agility and cost benefits. The O-RAN Alliance recently announced a survey on enterprises adopting O-RAN, and it revealed that 78% of surveyed organizations wanted to deploy O-RAN on hybrid or other cloud models. The hybrid cloud deployment provides private cloud security with the flexibility of the public cloud. The combination of both that the hybrid cloud deployment is offering is paving the way for the segment to grow.
The Private cloud is expected to register the fastest CAGR during the forecast period. Dedicated Cloud Infrastructure includes dedicated cloud infrastructure itself, enabling heightened network control, flexibility, and security. The increasing demand for customization, regulatory compliance, and resource optimization are driving the growth of the private cloud deployment segment.
By Frequency
In 2023, the sub-6 GHz segment dominated the market and captured the largest market revenue. Sub-6 GHz frequency allows for wider coverage and penetration through dense urban, woods, and slow/poor rural connectivity. Therefore, while the sub-6 GHz spectrum is more appropriate for both urban and rural use cases. It is an efficient data transmission that improves user experience as well as serves the purpose of open ran by increasing connectivity and accessibility. These advantages are expected to propel the market during the forecast period.
The mmWave segment is projected to have the fastest CAGR during the forecast period. due to its ultra-fast speeds and high data capacity. Whereas mmWave does provide network connectivity over a short range, the extreme speed available through the frequency is leading to its adoption in the O-RAN space.
By Network
In 2023, the 5 G segment dominated the market and captured the largest share of the market. Most of the network operators and telecom equipment manufacturers are now concentrating their efforts on building a strong 5G ecosystem. Most of these countries already have their 5G networks deployed. Network operators and providers are adopting 5G networks to accommodate the transition from 4G networks, which is driving the increase in the segment.
The 4G segment is expected to register the fastest CAGR during the forecast period. This 4G deployment has taken place as a result of developed infrastructure already being in place for this technology and already widely used around the world. Because most of the 4G network is already established, that is where the majority share of the open RAN can be connected. And due to the mature technology of 4G, many large-scale deployments of Open RAN would be on 4G network.
Regional Analysis
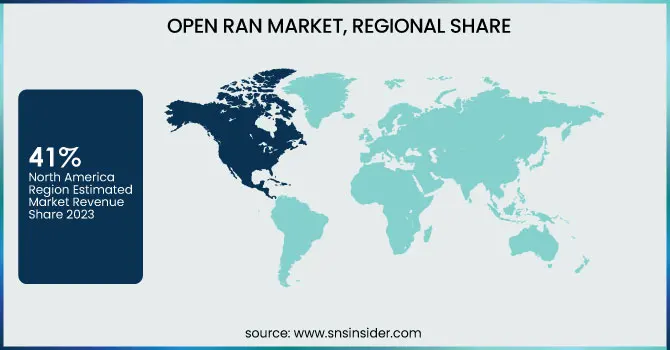
North America dominated the market and accounted for 41% of revenue share in 2023. Several factors are responsible for the regional growth, such as the presence of key players like AT&T, Inc., and also the high inclination toward technology in the region, thereby, making the region an early adopter of advanced solutions. Additionally, the region is witnessing heavy investments in telecommunication infrastructure creating ample growth opportunities for the adoption of O-RAN.
The Asia Pacific is expected to register the fastest CAGR during the forecast period. The increase in the demand for advanced telecommunication building system, rise in mobile subscriber databases, and supportive government regulation contributes to the region growth. Countries like Japan, South Korea, and India are leading regional growth behind both technological advances and a growing focus on establishing a healthy digital environment.
Get Customized Report as per Your Business Requirement - Enquiry Now
Key Players
The major key players along with their products are
-
Rakuten Symphony – Symware
-
Parallel Wireless – OpenRAN Controller
-
Mavenir – Open vRAN
-
Nokia – AirScale Open RAN
-
Ericsson – Cloud RAN
-
Samsung – vRAN 3.0
-
NEC Corporation – Open RAN Radio Units
-
Fujitsu – Open RAN 5G Radio Unit
-
Intel Corporation – FlexRAN
-
Qualcomm – 5G Open RAN Platform
-
VMware – RIC (RAN Intelligent Controller)
-
Dell Technologies – Open Telecom Ecosystem Lab
-
Hewlett Packard Enterprise (HPE) – Open RAN Solution Stack
-
IBM – Cloud Pak for Network Automation
-
Vodafone Group – OpenRAN Deployment Initiative
Recent Developments
-
In October 2024, Ericsson secured a significant 5G Open RAN contract with Spain's largest telecom operator, MasOrange, to upgrade approximately 10,000 sites, marking Ericsson's first major Open RAN deal in Europe.
-
In November 2024, Nokia was awarded a contract by Deutsche Telekom to deploy Open RAN technology across over 3,000 sites in Germany, replacing equipment from the previous supplier, Huawei.
-
In November 2024, Saudi Aramco's digital arm entered negotiations to invest $1 billion in Mavenir, a U.S. telecommunications software maker known for its Open RAN technology, aiming to diversify and advance Saudi Arabia's technological infrastructure.
|
Report Attributes |
Details |
|
Market Size in 2023 |
USD 5.1 Billion |
|
Market Size by 2032 |
USD 41.5 Billion |
|
CAGR |
CAGR of 26.24% From 2024 to 2032 |
|
Base Year |
2023 |
|
Forecast Period |
2024-2032 |
|
Historical Data |
2020-2022 |
|
Report Scope & Coverage |
Market Size, Segments Analysis, Competitive Landscape, Regional Analysis, DROC & SWOT Analysis, Forecast Outlook |
|
Key Segments |
• By Component (Hardware, Software, Services) |
|
Regional Analysis/Coverage |
North America (US, Canada, Mexico), Europe (Eastern Europe [Poland, Romania, Hungary, Turkey, Rest of Eastern Europe] Western Europe] Germany, France, UK, Italy, Spain, Netherlands, Switzerland, Austria, Rest of Western Europe]), Asia Pacific (China, India, Japan, South Korea, Vietnam, Singapore, Australia, Rest of Asia Pacific), Middle East & Africa (Middle East [UAE, Egypt, Saudi Arabia, Qatar, Rest of Middle East], Africa [Nigeria, South Africa, Rest of Africa], Latin America (Brazil, Argentina, Colombia, Rest of Latin America) |
|
Company Profiles |
Rakuten Symphony, Parallel Wireless, Mavenir, Nokia, Ericsson, Samsung, NEC Corporation, Fujitsu, Intel Corporation, Qualcomm, VMware, Dell Technologies, Hewlett Packard Enterprise (HPE), IBM, Vodafone Group. |
