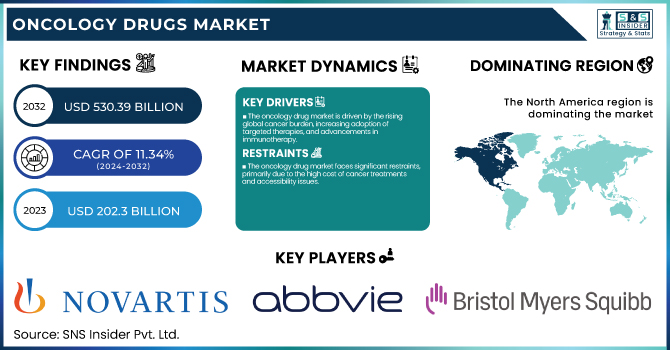
The global Oncology Drugs Market size was USD 202.3 billion in 2023, is projected to reach USD 530.39 billion by 2032, growing at an 11.34% CAGR over the forecast period 2024-2032.
This report indicates the increasing incidence and prevalence of cancer, leading to greater demand for oncology therapies and impacting prescription patterns in different regions. The research focuses on R&D spending in drug development, with a focus on the importance of innovation in targeted therapies and immuno-oncology. It also discusses patient access and treatment compliance trends, which are affected by drug price, healthcare policies, and changing market access approaches. The report also analyzes oncology drug pricing dynamics and their impact on market development. In addition, it offers a snapshot of healthcare expenditure on oncology medicines, examining government, commercial, private, and out-of-pocket spend contributions in various regions.
Get More Information on Oncology Drugs Market - Request Sample Report
Drivers
The oncology drug market is driven by the rising global cancer burden, increasing adoption of targeted therapies, and advancements in immunotherapy.
Cancer, according to the World Health Organization (WHO), is a leading cause of death globally, and in 2023 it claimed about 10 million lives. This increasing trend has triggered interest in successful therapies, especially precision medicine. Therapies such as tyrosine kinase inhibitors (TKIs) and monoclonal antibodies have transformed the treatment of cancer by enhancing outcomes for patients while minimizing toxicity. Immunotherapy, such as PD-1/PD-L1 inhibitors Keytruda (Merck) and Opdivo (Bristol-Myers Squibb), has picked up considerable momentum because of its capacity to offer long-term remission. Government funding and initiatives towards cancer research have also accelerated drug development. The U.S. National Cancer Institute (NCI) invested USD 7.3 billion in cancer research in 2023, speeding up the approval of new therapies. The advent of combination therapies, which combine chemotherapy with targeted or immune-based therapies, has further increased efficacy. Additionally, growing awareness, early detection, and individualized treatment strategies have resulted in improved survival rates, thus driving market growth. The growing pipeline of new drugs, with more than 1,200 oncology drugs under clinical trials, guarantees ongoing developments in the space, further propelling demand for effective cancer therapies.
Restraints
The oncology drug market faces significant restraints, primarily due to the high cost of cancer treatments and accessibility issues.
The cost of immunotherapy on average can range more than USD 150,000 annually, making it not an affordable option for most patients, especially in middle- and low-income countries. The patent protection of bestseller drugs also inhibits generic entry, thus sustaining high prices. Additionally, high regulatory approvals increase the time spent to bring new treatments to market. The process of U.S. FDA approval for oncology medicines can extend for many years, involving costly clinical trials and post-marketing surveillance. Another difficulty is the serious adverse effects that occur with chemotherapy and targeted treatments, such as immune-related adverse events, that may require discontinuation of therapy. The complexity of combination therapies also raises safety concerns, effectiveness, and reimbursement policies.
Opportunities
The expansion of precision medicine, AI-driven drug discovery, and increased R&D investments.
Personalized treatment strategies, through genetic profiling and biomarker discovery, have improved the efficacy of drugs and reduced side effects. Companion diagnostics, including Roche's FoundationOne CDx, are growing in prominence to facilitate the choice of targeted therapies, thereby boosting treatment rates. Artificial intelligence and machine learning are transforming drug development, expediting clinical trials, and cutting down on costs. Firms such as IBM Watson and BenevolentAI are using AI to discover new drug targets and refine treatment approaches. Moreover, with the development of cell and gene therapies, like CAR-T therapies Kymriah (Novartis) and Yescarta (Gilead), new opportunities are arising to treat hematological cancers. Growing collaborations between pharmaceutical entities and biotech organizations are promoting innovation, resulting in faster drug approvals. Additionally, the growing uptake of biosimilars, fueled by cost savings and patent losses of leading biologics, will further boost affordability and accessibility. Government support for cancer research, along with increased patient awareness and screening initiatives, will further drive market growth opportunities. The ongoing emphasis on the development of next-generation cancer therapies, including RNA-based therapies and tumor-infiltrating lymphocyte (TIL) therapies, will fuel future growth.
Challenges
One of the biggest challenges in the oncology drug market is drug resistance, which limits treatment effectiveness and increases the need for alternative therapies.
Most cancers eventually become resistant to targeted medications over time, and treatment must be changed repeatedly. For example, patients with non-small cell lung cancer (NSCLC) who are treated with EGFR inhibitors such as Tarceva (Erlotinib) develop resistance within one year. This obstacle can only be overcome through ongoing research in combination therapies and new drug mechanisms. The second significant challenge is the high oncology drug development failure rate, with almost 95% of cancer drugs being rejected in clinical trials because of efficacy or safety issues. Cancer biology is so complex that it is hard to create treatments that are universally effective. Moreover, manufacturing issues related to biologics and cell therapies, like the stability of live-cell therapies, complicate large-scale production and affordability. Regulatory barriers continue to be a major challenge since gaining market approval for new therapies is a function of having detailed data on long-term efficacy and safety. Ethical issues of genetically modified cell therapies and limited diversity in clinical trials, in which most studies are not represented by diverse ethnic populations, complicate market expansion. Overcoming these challenges necessitates ongoing innovation, better trial designs, and increased regulatory support to get new oncology drugs to market effectively.
By Drug Class
The targeted drugs segment dominated the oncology drugs market in the world in 2023, representing more than 48.9% of the market. This segment's dominance is due to the growing use of precision medicine, enhanced effectiveness, and lower side effects in comparison to chemotherapy. The capability of targeted drugs to target specifically cancer cells while leaving normal cells intact has facilitated their extensive usage.
By Therapy
The targeted therapy segment dominated the market in 2023 with over 46.7% of the overall share. The segment dominates because it has high specificity to target cancer cells, minimize toxicity, and enhance patient outcomes. Progress in molecular diagnostics and the identification of biomarkers have also driven the use of targeted therapy.
At the same time, the immunotherapy market is expected to be the fastest-growing over the forecast period. The growing use of immune checkpoint inhibitors, monoclonal antibodies, and CAR-T cell therapies has driven its fast growth. The fact that immunotherapy is capable of bringing long-term remission and lowering relapse rates is a primary driver of its high growth.
By Indication
The others category, comprising unusual and virulent cancers, comprised more than 30.5% of the market in 2023. The elevated prevalence of numerous cancer types and the emergence of new therapies aided the segment in achieving its highest share.
The breast cancer segment is projected to expand at the highest rate as a result of the rising incidence of breast cancer worldwide, enhanced awareness, and the improvement in personalized medicine. The greater availability of targeted drugs and hormone therapies specifically designed for breast cancer has also fueled its expansion.
By Dosage Form
The injectables segment maintained the top market position in 2023 with more than 56.7% market share, mainly because of the growing use of biologics and targeted cancer therapies. Injectable cancer drugs such as monoclonal antibodies and immune checkpoint inhibitors are sought after for their greater bioavailability and effectiveness against different forms of cancers.
The solid dosage form category, including tablets and capsules, is anticipated to post moderate growth. The ease of oral administration, along with continuous research into oral formulations for targeted therapies, is fueling its market presence.
By Distribution Channel
The hospital pharmacies segment led the market in 2023 with over 64.5% of the overall share. The rise in the number of hospital admissions for cancer treatment and the presence of specialized oncology medicines in hospital pharmacies helped it gain a strong hold.
The online pharmacies segment is expected to grow at the fastest rate based on the growth of digital healthcare services. Improved accessibility, cancer medication discounts, and growing e-commerce platform penetration have fueled the growth of online pharmacies in the oncology drugs market.
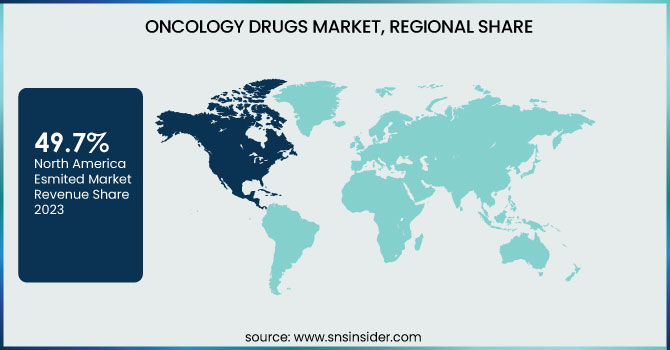
North America led the market in 2023 with a share of more than 49.7%, attributed mainly to the concentration of major pharmaceutical firms, robust research infrastructure, and increased healthcare spending. The U.S. is an important contributor, with institutions such as the National Cancer Institute (NCI) spending USD 7.3 billion on cancer research. Moreover, the extensive use of targeted therapy and immunotherapy, such as checkpoint inhibitors like Keytruda and Opdivo, has driven market growth.
Europe was the second-largest market share, with support coming from positive reimbursement policies, robust clinical research, and growing cancer screening programs. Germany, the U.K., and France lead in oncology drug approvals. On the other hand, Asia-Pacific is projected to be the fastest-growing market, with a growing cancer burden, health infrastructure, and increasing investment in biosimilars. China and India are seeing a boom in clinical trials and local drug manufacturing.
Get More Information on Oncology Drugs Market - Enquiry Now
F. Hoffmann-La Roche Ltd. – Avastin, Herceptin, Tecentriq, Perjeta, Kadcyla, Alecensa, Rozlytrek
AbbVie Inc. – Venclexta, Imbruvica, Empliciti
Novartis AG – Kymriah, Kisqali, Tabrecta, Scemblix, Jakavi, Tafinlar, Mekinist
Pfizer Inc. – Ibrance, Lorbrena, Talzenna, Inlyta, Xtandi, Besponsa, Daurismo
Bristol Myers Squibb Company – Opdivo, Yervoy, Revlimid, Pomalyst, Breyanzi, Abecma, Reblozyl
GlaxoSmithKline plc. – Zejula, Jemperli, Blenrep
Eli Lilly and Company – Verzenio, Cyramza, Retevmo, Jaypirca
AstraZeneca – Tagrisso, Imfinzi, Lynparza, Enhertu, Calquence
Sanofi – Sarclisa, Libtayo, Jevtana
Bayer AG – Stivarga, Nubeqa, Xofigo, Vitrakvi
Merck & Co., Inc. – Keytruda, Welireg, Tepmetko
In March 2025, Jazz Pharmaceuticals announced the acquisition of Chimerix for USD 935 million, securing rights to the brain cancer drug candidate dordaviprone. With the FDA decision expected by August 18 for its use in recurrent H3 K27M-mutant diffuse glioma, Jazz aims for a swift return on investment if approved.
In March 2025, Pfizer’s breast cancer drug, Vepdegestrant, showed mixed results in a key trial. While it did not significantly delay cancer progression for all patients, it achieved its targets in a subset with a specific genetic mutation.
Report Attributes | Details |
Market Size in 2023 | USD 202.30 billion |
Market Size by 2032 | USD 530.39 billion |
CAGR | CAGR of 11.34% From 2024 to 2032 |
Base Year | 2023 |
Forecast Period | 2024-2032 |
Historical Data | 2020-2022 |
Report Scope & Coverage | Market Size, Segments Analysis, Competitive Landscape, Regional Analysis, DROC & SWOT Analysis, Forecast Outlook |
Key Segments | • By Drug Class [Cytotoxic Drugs, Targeted Drugs, Hormonal Drugs, Others] • By Therapy [Chemotherapy, Targeted Therapy, Immunotherapy] • By Indication [Lung Cancer, Stomach Cancer, Colorectal Cancer, Breast Cancer, Prostate Cancer, Others] • By Dosage Form [Solid, Liquid, Injectable] • By Distribution Channel [Hospital Pharmacies, Retail Pharmacies, Online Pharmacies] |
Regional Analysis/Coverage | North America (US, Canada, Mexico), Europe (Eastern Europe [Poland, Romania, Hungary, Turkey, Rest of Eastern Europe] Western Europe] Germany, France, UK, Italy, Spain, Netherlands, Switzerland, Austria, Rest of Western Europe]), Asia Pacific (China, India, Japan, South Korea, Vietnam, Singapore, Australia, Rest of Asia Pacific), Middle East & Africa (Middle East [UAE, Egypt, Saudi Arabia, Qatar, Rest of Middle East], Africa [Nigeria, South Africa, Rest of Africa], Latin America (Brazil, Argentina, Colombia, Rest of Latin America) |
Company Profiles | F. Hoffmann-La Roche Ltd., AbbVie Inc., Novartis AG, Pfizer Inc., Bristol Myers Squibb Company, GlaxoSmithKline plc., Eli Lilly and Company, AstraZeneca, Sanofi, Bayer AG, Merck & Co., Inc. |
Ans. The Oncology Drugs Market is to grow at a CAGR of 11.34% Over the Forecast Period of 2024-2032.
Ans. By 2032, the Oncology drugs market is expected to be worth USD 530.39 Billion.
Ans: North America dominated the oncology drugs market.
Ans. The rising frequency of malignancies, as well as the existence of excellent pipeline prospects, are important drivers driving market expansion.
Ans. During the projected period, the targeted drug segment is likely to be the market's leading sector by drug class.
Table of Contents:
1. Introduction
1.1 Market Definition
1.2 Scope (Inclusion and Exclusions)
1.3 Research Assumptions
2. Executive Summary
2.1 Market Overview
2.2 Regional Synopsis
2.3 Competitive Summary
3. Research Methodology
3.1 Top-Down Approach
3.2 Bottom-up Approach
3.3. Data Validation
3.4 Primary Interviews
4. Market Dynamics Impact Analysis
4.1 Market Driving Factors Analysis
4.1.1 Drivers
4.1.2 Restraints
4.1.3 Opportunities
4.1.4 Challenges
4.2 PESTLE Analysis
4.3 Porter’s Five Forces Model
5. Statistical Insights and Trends Reporting
5.1 Incidence and Prevalence of Cancer (2023)
5.2 Oncology Drug Prescription Trends (2023), by Region
5.3 R&D Investments in Oncology Drug Development (2023)
5.4 Patient Access and Treatment Adherence Trends
5.5 Oncology Drug Pricing Trends and Market Access (2023-2032)
5.6 Healthcare Spending on Oncology Drugs, by Region (Government, Commercial, Private, Out-of-Pocket), 2023
6. Competitive Landscape
6.1 List of Major Companies, By Region
6.2 Market Share Analysis, By Region
6.3 Product Benchmarking
6.3.1 Product specifications and features
6.3.2 Pricing
6.4 Strategic Initiatives
6.4.1 Marketing and promotional activities
6.4.2 Distribution and Supply Chain Strategies
6.4.3 Expansion plans and new product launches
6.4.4 Strategic partnerships and collaborations
6.5 Technological Advancements
6.6 Market Positioning and Branding
7. Oncology Drugs Market Segmentation, by Drug Class
7.1 Chapter Overview
7.2 Cytotoxic Drugs
7.2.1 Cytotoxic Drugs Market Trends Analysis (2020-2032)
7.2.2 Cytotoxic Drugs Market Size Estimates and Forecasts to 2032 (USD Billion)
7.3 Targeted Drugs
7.3.1 Targeted Drugs Market Trends Analysis (2020-2032)
7.3.2 Targeted Drugs Market Size Estimates and Forecasts to 2032 (USD Billion)
7.4 Hormonal Drugs
7.4.1 Hormonal Drugs Market Trends Analysis (2020-2032)
7.4.2 Hormonal Drugs Market Size Estimates and Forecasts to 2032 (USD Billion)
7.5 Others
7.5.1 Others Market Trends Analysis (2020-2032)
7.5.2 Others Market Size Estimates and Forecasts to 2032 (USD Billion)
8. Oncology Drugs Market Segmentation, By Therapy
8.1 Chapter Overview
8.2 Chemotherapy
8.2.1 Chemotherapy Market Trends Analysis (2020-2032)
8.2.2 Chemotherapy Market Size Estimates And Forecasts To 2032 (USD Billion)
8.3 Targeted Therapy
8.3.1 Targeted Therapy Market Trends Analysis (2020-2032)
8.3.2 Targeted Therapy Market Size Estimates And Forecasts To 2032 (USD Billion)
8.4 Immunotherapy
8.4.1 Immunotherapy Market Trends Analysis (2020-2032)
8.4.2 Immunotherapy Market Size Estimates And Forecasts To 2032 (USD Billion)
9. Oncology Drugs Market Segmentation, By Indication
9.1 Chapter Overview
9.2 Lung Cancer
9.2.1 Lung Cancer Market Trends Analysis (2020-2032)
9.2.2 Lung Cancer Market Size Estimates And Forecasts To 2032 (USD Billion)
9.3 Stomach Cancer
9.3.1 Stomach Cancer Market Trends Analysis (2020-2032)
9.3.2 Stomach Cancer Market Size Estimates And Forecasts To 2032 (USD Billion)
9.4 Colorectal Cancer
9.4.1 Colorectal Cancer Market Trends Analysis (2020-2032)
9.4.2 Colorectal Cancer Market Size Estimates And Forecasts To 2032 (USD Billion)
9.5 Breast Cancer
9.5.1 Breast Cancer Market Trends Analysis (2020-2032)
9.5.2 Breast Cancer Market Size Estimates And Forecasts To 2032 (USD Billion)
9.6 Prostate Cancer
9.6.1 Prostate Cancer Market Trends Analysis (2020-2032)
9.6.2 Prostate Cancer Market Size Estimates And Forecasts To 2032 (USD Billion)
9.7 Others
9.7.1 Others Market Trends Analysis (2020-2032)
9.7.2 Others Market Size Estimates And Forecasts To 2032 (USD Billion)
10. Oncology Drugs Market Segmentation, By Dosage Form
10.1 Chapter Overview
10.2 Solid
10.2.1 Solid Market Trends Analysis (2020-2032)
10.2.2 Solid Market Size Estimates And Forecasts To 2032 (USD Billion)
10.3 Liquid
10.3.1 Liquid Market Trends Analysis (2020-2032)
10.3.2 Liquid Market Size Estimates And Forecasts To 2032 (USD Billion)
10.4 Injectable
10.4.1 Injectable Market Trends Analysis (2020-2032)
10.4.2 Injectable Market Size Estimates And Forecasts To 2032 (USD Billion)
11. Oncology Drugs Market Segmentation, By Distribution Channel
11.1 Chapter Overview
11.2 Hospital Pharmacies
11.2.1 Hospital Pharmacies Market Trends Analysis (2020-2032)
11.2.2 Hospital Pharmacies Market Size Estimates And Forecasts To 2032 (USD Billion)
11.3 Retail Pharmacies
11.3.1 Retail Pharmacies Market Trends Analysis (2020-2032)
11.3.2 Retail Pharmacies Market Size Estimates And Forecasts To 2032 (USD Billion)
11.4 Online Pharmacies
11.4.1 Online Pharmacies Market Trends Analysis (2020-2032)
11.4.2 Online Pharmacies Market Size Estimates And Forecasts To 2032 (USD Billion)
12. Regional Analysis
12.1 Chapter Overview
12.2 North America
12.2.1 Trends Analysis
12.2.2 North America Oncology Drugs Market Estimates And Forecasts, By Country (2020-2032) (USD Billion)
12.2.3 North America Oncology Drugs Market Estimates And Forecasts, By Drug Class (2020-2032) (USD Billion)
12.2.4 North America Oncology Drugs Market Estimates And Forecasts, By Therapy (2020-2032) (USD Billion)
12.2.5 North America Oncology Drugs Market Estimates And Forecasts, By Indication (2020-2032) (USD Billion)
12.2.6 North America Oncology Drugs Market Estimates And Forecasts, By Dosage Form (2020-2032) (USD Billion)
12.2.7 North America Oncology Drugs Market Estimates And Forecasts, By Distribution Channel (2020-2032) (USD Billion)
12.2.8 USA
12.2.8.1 USA Oncology Drugs Market Estimates And Forecasts, By Drug Class (2020-2032) (USD Billion)
12.2.8.2 USA Oncology Drugs Market Estimates And Forecasts, By Therapy (2020-2032) (USD Billion)
12.2.8.3 USA Oncology Drugs Market Estimates And Forecasts, By Indication (2020-2032) (USD Billion)
12.2.8.4 USA Oncology Drugs Market Estimates And Forecasts, By Dosage Form (2020-2032) (USD Billion)
12.2.8.5 USA Oncology Drugs Market Estimates And Forecasts, By Distribution Channel (2020-2032) (USD Billion)
12.2.9 Canada
12.2.9.1 Canada Oncology Drugs Market Estimates And Forecasts, By Drug Class (2020-2032) (USD Billion)
12.2.9.2 Canada Oncology Drugs Market Estimates And Forecasts, By Therapy (2020-2032) (USD Billion)
12.2.9.3 Canada Oncology Drugs Market Estimates And Forecasts, By Indication (2020-2032) (USD Billion)
12.2.9.4 Canada Oncology Drugs Market Estimates And Forecasts, By Dosage Form (2020-2032) (USD Billion)
12.2.9.5 Canada Oncology Drugs Market Estimates And Forecasts, By Distribution Channel (2020-2032) (USD Billion)
12.2.10 Mexico
12.2.10.1 Mexico Oncology Drugs Market Estimates And Forecasts, By Drug Class (2020-2032) (USD Billion)
12.2.10.2 Mexico Oncology Drugs Market Estimates And Forecasts, By Therapy (2020-2032) (USD Billion)
12.2.10.3 Mexico Oncology Drugs Market Estimates And Forecasts, By Indication (2020-2032) (USD Billion)
12.2.10.4 Mexico Oncology Drugs Market Estimates And Forecasts, By Dosage Form (2020-2032) (USD Billion)
12.2.10.5 Mexico Oncology Drugs Market Estimates And Forecasts, By Distribution Channel (2020-2032) (USD Billion)
12.3 Europe
12.3.1 Eastern Europe
12.3.1.1 Trends Analysis
12.3.1.2 Eastern Europe Oncology Drugs Market Estimates And Forecasts, By Country (2020-2032) (USD Billion)
12.3.1.3 Eastern Europe Oncology Drugs Market Estimates And Forecasts, By Drug Class (2020-2032) (USD Billion)
12.3.1.4 Eastern Europe Oncology Drugs Market Estimates And Forecasts, By Therapy (2020-2032) (USD Billion)
12.3.1.5 Eastern Europe Oncology Drugs Market Estimates And Forecasts, By Indication (2020-2032) (USD Billion)
12.3.1.6 Eastern Europe Oncology Drugs Market Estimates And Forecasts, By Dosage Form (2020-2032) (USD Billion)
12.3.1.7 Eastern Europe Oncology Drugs Market Estimates And Forecasts, By Distribution Channel (2020-2032) (USD Billion)
12.3.1.8 Poland
12.3.1.8.1 Poland Oncology Drugs Market Estimates And Forecasts, By Drug Class (2020-2032) (USD Billion)
12.3.1.8.2 Poland Oncology Drugs Market Estimates And Forecasts, By Therapy (2020-2032) (USD Billion)
12.3.1.8.3 Poland Oncology Drugs Market Estimates And Forecasts, By Indication (2020-2032) (USD Billion)
12.3.1.8.4 Poland Oncology Drugs Market Estimates And Forecasts, By Dosage Form (2020-2032) (USD Billion)
12.3.1.8.5 Poland Oncology Drugs Market Estimates And Forecasts, By Distribution Channel (2020-2032) (USD Billion)
12.3.1.9 Romania
12.3.1.9.1 Romania Oncology Drugs Market Estimates And Forecasts, By Drug Class (2020-2032) (USD Billion)
12.3.1.9.2 Romania Oncology Drugs Market Estimates And Forecasts, By Therapy (2020-2032) (USD Billion)
12.3.1.9.3 Romania Oncology Drugs Market Estimates And Forecasts, By Indication (2020-2032) (USD Billion)
12.3.1.9.4 Romania Oncology Drugs Market Estimates And Forecasts, By Dosage Form (2020-2032) (USD Billion)
12.3.1.9.5 Romania Oncology Drugs Market Estimates And Forecasts, By Distribution Channel (2020-2032) (USD Billion)
12.3.1.10 Hungary
12.3.1.10.1 Hungary Oncology Drugs Market Estimates And Forecasts, By Drug Class (2020-2032) (USD Billion)
12.3.1.10.2 Hungary Oncology Drugs Market Estimates And Forecasts, By Therapy (2020-2032) (USD Billion)
12.3.1.10.3 Hungary Oncology Drugs Market Estimates And Forecasts, By Indication (2020-2032) (USD Billion)
12.3.1.10.4 Hungary Oncology Drugs Market Estimates And Forecasts, By Dosage Form (2020-2032) (USD Billion)
12.3.1.10.5 Hungary Oncology Drugs Market Estimates And Forecasts, By Distribution Channel (2020-2032) (USD Billion)
12.3.1.11 Turkey
12.3.1.11.1 Turkey Oncology Drugs Market Estimates And Forecasts, By Drug Class (2020-2032) (USD Billion)
12.3.1.11.2 Turkey Oncology Drugs Market Estimates And Forecasts, By Therapy (2020-2032) (USD Billion)
12.3.1.11.3 Turkey Oncology Drugs Market Estimates And Forecasts, By Indication (2020-2032) (USD Billion)
12.3.1.11.4 Turkey Oncology Drugs Market Estimates And Forecasts, By Dosage Form (2020-2032) (USD Billion)
12.3.1.11.5 Turkey Oncology Drugs Market Estimates And Forecasts, By Distribution Channel (2020-2032) (USD Billion)
12.3.1.12 Rest Of Eastern Europe
12.3.1.12.1 Rest Of Eastern Europe Oncology Drugs Market Estimates And Forecasts, By Drug Class (2020-2032) (USD Billion)
12.3.1.12.2 Rest Of Eastern Europe Oncology Drugs Market Estimates And Forecasts, By Therapy (2020-2032) (USD Billion)
12.3.1.12.3 Rest Of Eastern Europe Oncology Drugs Market Estimates And Forecasts, By Indication (2020-2032) (USD Billion)
12.3.1.12.4 Rest Of Eastern Europe Oncology Drugs Market Estimates And Forecasts, By Dosage Form (2020-2032) (USD Billion)
12.3.1.12.5 Rest Of Eastern Europe Oncology Drugs Market Estimates And Forecasts, By Distribution Channel (2020-2032) (USD Billion)
12.3.2 Western Europe
12.3.2.1 Trends Analysis
12.3.2.2 Western Europe Oncology Drugs Market Estimates And Forecasts, By Country (2020-2032) (USD Billion)
12.3.2.3 Western Europe Oncology Drugs Market Estimates And Forecasts, By Drug Class (2020-2032) (USD Billion)
12.3.2.4 Western Europe Oncology Drugs Market Estimates And Forecasts, By Therapy (2020-2032) (USD Billion)
12.3.2.5 Western Europe Oncology Drugs Market Estimates And Forecasts, By Indication (2020-2032) (USD Billion)
12.3.2.6 Western Europe Oncology Drugs Market Estimates And Forecasts, By Dosage Form (2020-2032) (USD Billion)
12.3.2.7 Western Europe Oncology Drugs Market Estimates And Forecasts, By Distribution Channel (2020-2032) (USD Billion)
12.3.2.8 Germany
12.3.2.8.1 Germany Oncology Drugs Market Estimates And Forecasts, By Drug Class (2020-2032) (USD Billion)
12.3.2.8.2 Germany Oncology Drugs Market Estimates And Forecasts, By Therapy (2020-2032) (USD Billion)
12.3.2.8.3 Germany Oncology Drugs Market Estimates And Forecasts, By Indication (2020-2032) (USD Billion)
12.3.2.8.4 Germany Oncology Drugs Market Estimates And Forecasts, By Dosage Form (2020-2032) (USD Billion)
12.3.2.8.5 Germany Oncology Drugs Market Estimates And Forecasts, By Distribution Channel (2020-2032) (USD Billion)
12.3.2.9 France
12.3.2.9.1 France Oncology Drugs Market Estimates And Forecasts, By Drug Class (2020-2032) (USD Billion)
12.3.2.9.2 France Oncology Drugs Market Estimates And Forecasts, By Therapy (2020-2032) (USD Billion)
12.3.2.9.3 France Oncology Drugs Market Estimates And Forecasts, By Indication (2020-2032) (USD Billion)
12.3.2.9.4 France Oncology Drugs Market Estimates And Forecasts, By Dosage Form (2020-2032) (USD Billion)
12.3.2.9.5 France Oncology Drugs Market Estimates And Forecasts, By Distribution Channel (2020-2032) (USD Billion)
12.3.2.10 UK
12.3.2.10.1 UK Oncology Drugs Market Estimates And Forecasts, By Drug Class (2020-2032) (USD Billion)
12.3.2.10.2 UK Oncology Drugs Market Estimates And Forecasts, By Therapy (2020-2032) (USD Billion)
12.3.2.10.3 UK Oncology Drugs Market Estimates And Forecasts, By Indication (2020-2032) (USD Billion)
12.3.2.10.4 UK Oncology Drugs Market Estimates And Forecasts, By Dosage Form (2020-2032) (USD Billion)
12.3.2.10.5 UK Oncology Drugs Market Estimates And Forecasts, By Distribution Channel (2020-2032) (USD Billion)
12.3.2.11 Italy
12.3.2.11.1 Italy Oncology Drugs Market Estimates And Forecasts, By Drug Class (2020-2032) (USD Billion)
12.3.2.11.2 Italy Oncology Drugs Market Estimates And Forecasts, By Therapy (2020-2032) (USD Billion)
12.3.2.11.3 Italy Oncology Drugs Market Estimates And Forecasts, By Indication (2020-2032) (USD Billion)
12.3.2.11.4 Italy Oncology Drugs Market Estimates And Forecasts, By Dosage Form (2020-2032) (USD Billion)
12.3.2.11.5 Italy Oncology Drugs Market Estimates And Forecasts, By Distribution Channel (2020-2032) (USD Billion)
12.3.2.12 Spain
12.3.2.12.1 Spain Oncology Drugs Market Estimates And Forecasts, By Drug Class (2020-2032) (USD Billion)
12.3.2.12.2 Spain Oncology Drugs Market Estimates And Forecasts, By Therapy (2020-2032) (USD Billion)
12.3.2.12.3 Spain Oncology Drugs Market Estimates And Forecasts, By Indication (2020-2032) (USD Billion)
12.3.2.12.4 Spain Oncology Drugs Market Estimates And Forecasts, By Dosage Form (2020-2032) (USD Billion)
12.3.2.12.5 Spain Oncology Drugs Market Estimates And Forecasts, By Distribution Channel (2020-2032) (USD Billion)
12.3.2.13 Netherlands
12.3.2.13.1 Netherlands Oncology Drugs Market Estimates And Forecasts, By Drug Class (2020-2032) (USD Billion)
12.3.2.13.2 Netherlands Oncology Drugs Market Estimates And Forecasts, By Therapy (2020-2032) (USD Billion)
12.3.2.13.3 Netherlands Oncology Drugs Market Estimates And Forecasts, By Indication (2020-2032) (USD Billion)
12.3.2.13.4 Netherlands Oncology Drugs Market Estimates And Forecasts, By Dosage Form (2020-2032) (USD Billion)
12.3.2.13.5 Netherlands Oncology Drugs Market Estimates And Forecasts, By Distribution Channel (2020-2032) (USD Billion)
12.3.2.14 Switzerland
12.3.2.14.1 Switzerland Oncology Drugs Market Estimates And Forecasts, By Drug Class (2020-2032) (USD Billion)
12.3.2.14.2 Switzerland Oncology Drugs Market Estimates And Forecasts, By Therapy (2020-2032) (USD Billion)
12.3.2.14.3 Switzerland Oncology Drugs Market Estimates And Forecasts, By Indication (2020-2032) (USD Billion)
12.3.2.14.4 Switzerland Oncology Drugs Market Estimates And Forecasts, By Dosage Form (2020-2032) (USD Billion)
12.3.2.12.5 Switzerland Oncology Drugs Market Estimates And Forecasts, By Distribution Channel (2020-2032) (USD Billion)
12.3.2.15 Austria
12.3.2.15.1 Austria Oncology Drugs Market Estimates And Forecasts, By Drug Class (2020-2032) (USD Billion)
12.3.2.15.2 Austria Oncology Drugs Market Estimates And Forecasts, By Therapy (2020-2032) (USD Billion)
12.3.2.15.3 Austria Oncology Drugs Market Estimates And Forecasts, By Indication (2020-2032) (USD Billion)
12.3.2.15.4 Austria Oncology Drugs Market Estimates And Forecasts, By Dosage Form (2020-2032) (USD Billion)
12.3.2.15.5 Austria Oncology Drugs Market Estimates And Forecasts, By Distribution Channel (2020-2032) (USD Billion)
12.3.2.16 Rest Of Western Europe
12.3.2.16.1 Rest Of Western Europe Oncology Drugs Market Estimates And Forecasts, By Drug Class (2020-2032) (USD Billion)
12.3.2.16.2 Rest Of Western Europe Oncology Drugs Market Estimates And Forecasts, By Therapy (2020-2032) (USD Billion)
12.3.2.16.3 Rest Of Western Europe Oncology Drugs Market Estimates And Forecasts, By Indication (2020-2032) (USD Billion)
12.3.2.16.4 Rest Of Western Europe Oncology Drugs Market Estimates And Forecasts, By Dosage Form (2020-2032) (USD Billion)
12.3.2.16.5 Rest Of Western Europe Oncology Drugs Market Estimates And Forecasts, By Distribution Channel (2020-2032) (USD Billion)
12.4 Asia Pacific
12.4.1 Trends Analysis
12.4.2 Asia Pacific Oncology Drugs Market Estimates And Forecasts, By Country (2020-2032) (USD Billion)
12.4.3 Asia Pacific Oncology Drugs Market Estimates And Forecasts, By Drug Class (2020-2032) (USD Billion)
12.4.4 Asia Pacific Oncology Drugs Market Estimates And Forecasts, By Therapy (2020-2032) (USD Billion)
12.4.5 Asia Pacific Oncology Drugs Market Estimates And Forecasts, By Indication (2020-2032) (USD Billion)
12.4.6 Asia Pacific Oncology Drugs Market Estimates And Forecasts, By Dosage Form (2020-2032) (USD Billion)
12.4.7 Asia Pacific Oncology Drugs Market Estimates And Forecasts, By Distribution Channel (2020-2032) (USD Billion)
12.4.8 China
12.4.8.1 China Oncology Drugs Market Estimates And Forecasts, By Drug Class (2020-2032) (USD Billion)
12.4.8.2 China Oncology Drugs Market Estimates And Forecasts, By Therapy (2020-2032) (USD Billion)
12.4.8.3 China Oncology Drugs Market Estimates And Forecasts, By Indication (2020-2032) (USD Billion)
12.4.8.4 China Oncology Drugs Market Estimates And Forecasts, By Dosage Form (2020-2032) (USD Billion)
12.4.8.5 China Oncology Drugs Market Estimates And Forecasts, By Distribution Channel (2020-2032) (USD Billion)
12.4.9 India
12.4.9.1 India Oncology Drugs Market Estimates And Forecasts, By Drug Class (2020-2032) (USD Billion)
12.4.9.2 India Oncology Drugs Market Estimates And Forecasts, By Therapy (2020-2032) (USD Billion)
12.4.9.3 India Oncology Drugs Market Estimates And Forecasts, By Indication (2020-2032) (USD Billion)
12.4.9.4 India Oncology Drugs Market Estimates And Forecasts, By Dosage Form (2020-2032) (USD Billion)
12.4.9.5 India Oncology Drugs Market Estimates And Forecasts, By Distribution Channel (2020-2032) (USD Billion)
12.4.10 Japan
12.4.10.1 Japan Oncology Drugs Market Estimates And Forecasts, By Drug Class (2020-2032) (USD Billion)
12.4.10.2 Japan Oncology Drugs Market Estimates And Forecasts, By Therapy (2020-2032) (USD Billion)
12.4.10.3 Japan Oncology Drugs Market Estimates And Forecasts, By Indication (2020-2032) (USD Billion)
12.4.10.4 Japan Oncology Drugs Market Estimates And Forecasts, By Dosage Form (2020-2032) (USD Billion)
12.4.10.5 Japan Oncology Drugs Market Estimates And Forecasts, By Distribution Channel (2020-2032) (USD Billion)
12.4.11 South Korea
12.4.11.1 South Korea Oncology Drugs Market Estimates And Forecasts, By Drug Class (2020-2032) (USD Billion)
12.4.11.2 South Korea Oncology Drugs Market Estimates And Forecasts, By Therapy (2020-2032) (USD Billion)
12.4.11.3 South Korea Oncology Drugs Market Estimates And Forecasts, By Indication (2020-2032) (USD Billion)
12.4.11.4 South Korea Oncology Drugs Market Estimates And Forecasts, By Dosage Form (2020-2032) (USD Billion)
12.4.11.5 South Korea Oncology Drugs Market Estimates And Forecasts, By Distribution Channel (2020-2032) (USD Billion)
12.4.12 Vietnam
12.4.12.1 Vietnam Oncology Drugs Market Estimates And Forecasts, By Drug Class (2020-2032) (USD Billion)
12.4.12.2 Vietnam Oncology Drugs Market Estimates And Forecasts, By Therapy (2020-2032) (USD Billion)
12.4.12.3 Vietnam Oncology Drugs Market Estimates And Forecasts, By Indication (2020-2032) (USD Billion)
12.4.12.4 Vietnam Oncology Drugs Market Estimates And Forecasts, By Dosage Form (2020-2032) (USD Billion)
12.4.12.5 Vietnam Oncology Drugs Market Estimates And Forecasts, By Distribution Channel (2020-2032) (USD Billion)
12.4.13 Singapore
12.4.13.1 Singapore Oncology Drugs Market Estimates And Forecasts, By Drug Class (2020-2032) (USD Billion)
12.4.13.2 Singapore Oncology Drugs Market Estimates And Forecasts, By Therapy (2020-2032) (USD Billion)
12.4.13.3 Singapore Oncology Drugs Market Estimates And Forecasts, By Indication (2020-2032) (USD Billion)
12.4.13.4 Singapore Oncology Drugs Market Estimates And Forecasts, By Dosage Form (2020-2032) (USD Billion)
12.4.13.5 Singapore Oncology Drugs Market Estimates And Forecasts, By Distribution Channel (2020-2032) (USD Billion)
12.4.14 Australia
12.4.14.1 Australia Oncology Drugs Market Estimates And Forecasts, By Drug Class (2020-2032) (USD Billion)
12.4.14.2 Australia Oncology Drugs Market Estimates And Forecasts, By Therapy (2020-2032) (USD Billion)
12.4.14.3 Australia Oncology Drugs Market Estimates And Forecasts, By Indication (2020-2032) (USD Billion)
12.4.14.4 Australia Oncology Drugs Market Estimates And Forecasts, By Dosage Form (2020-2032) (USD Billion)
12.4.14.5 Australia Oncology Drugs Market Estimates And Forecasts, By Distribution Channel (2020-2032) (USD Billion)
12.4.15 Rest Of Asia Pacific
12.4.15.1 Rest Of Asia Pacific Oncology Drugs Market Estimates And Forecasts, By Drug Class (2020-2032) (USD Billion)
12.4.15.2 Rest Of Asia Pacific Oncology Drugs Market Estimates And Forecasts, By Therapy (2020-2032) (USD Billion)
12.4.15.3 Rest Of Asia Pacific Oncology Drugs Market Estimates And Forecasts, By Indication (2020-2032) (USD Billion)
12.4.15.4 Rest Of Asia Pacific Oncology Drugs Market Estimates And Forecasts, By Dosage Form (2020-2032) (USD Billion)
12.4.15.5 Rest Of Asia Pacific Oncology Drugs Market Estimates And Forecasts, By Distribution Channel (2020-2032) (USD Billion)
12.5 Middle East And Africa
12.5.1 Middle East
12.5.1.1 Trends Analysis
12.5.1.2 Middle East Oncology Drugs Market Estimates And Forecasts, By Country (2020-2032) (USD Billion)
12.5.1.3 Middle East Oncology Drugs Market Estimates And Forecasts, By Drug Class (2020-2032) (USD Billion)
12.5.1.4 Middle East Oncology Drugs Market Estimates And Forecasts, By Therapy (2020-2032) (USD Billion)
12.5.1.5 Middle East Oncology Drugs Market Estimates And Forecasts, By Indication (2020-2032) (USD Billion)
12.5.1.6 Middle East Oncology Drugs Market Estimates And Forecasts, By Dosage Form (2020-2032) (USD Billion)
12.5.1.7 Middle East Oncology Drugs Market Estimates And Forecasts, By Distribution Channel (2020-2032) (USD Billion)
12.5.1.8 UAE
12.5.1.8.1 UAE Oncology Drugs Market Estimates And Forecasts, By Drug Class (2020-2032) (USD Billion)
12.5.1.8.2 UAE Oncology Drugs Market Estimates And Forecasts, By Therapy (2020-2032) (USD Billion)
12.5.1.8.3 UAE Oncology Drugs Market Estimates And Forecasts, By Indication (2020-2032) (USD Billion)
12.5.1.8.4 UAE Oncology Drugs Market Estimates And Forecasts, By Dosage Form (2020-2032) (USD Billion)
12.5.1.8.5 UAE Oncology Drugs Market Estimates And Forecasts, By Distribution Channel (2020-2032) (USD Billion)
12.5.1.9 Egypt
12.5.1.9.1 Egypt Oncology Drugs Market Estimates And Forecasts, By Drug Class (2020-2032) (USD Billion)
12.5.1.9.2 Egypt Oncology Drugs Market Estimates And Forecasts, By Therapy (2020-2032) (USD Billion)
12.5.1.9.3 Egypt Oncology Drugs Market Estimates And Forecasts, By Indication (2020-2032) (USD Billion)
12.5.1.9.4 Egypt Oncology Drugs Market Estimates And Forecasts, By Dosage Form (2020-2032) (USD Billion)
12.5.1.9.5 Egypt Oncology Drugs Market Estimates And Forecasts, By Distribution Channel (2020-2032) (USD Billion)
12.5.1.10 Saudi Arabia
12.5.1.10.1 Saudi Arabia Oncology Drugs Market Estimates And Forecasts, By Drug Class (2020-2032) (USD Billion)
12.5.1.10.2 Saudi Arabia Oncology Drugs Market Estimates And Forecasts, By Therapy (2020-2032) (USD Billion)
12.5.1.10.3 Saudi Arabia Oncology Drugs Market Estimates And Forecasts, By Indication (2020-2032) (USD Billion)
12.5.1.10.4 Saudi Arabia Oncology Drugs Market Estimates And Forecasts, By Dosage Form (2020-2032) (USD Billion)
12.5.1.10.5 Saudi Arabia Oncology Drugs Market Estimates And Forecasts, By Distribution Channel (2020-2032) (USD Billion)
12.5.1.11 Qatar
12.5.1.11.1 Qatar Oncology Drugs Market Estimates And Forecasts, By Drug Class (2020-2032) (USD Billion)
12.5.1.11.2 Qatar Oncology Drugs Market Estimates And Forecasts, By Therapy (2020-2032) (USD Billion)
12.5.1.11.3 Qatar Oncology Drugs Market Estimates And Forecasts, By Indication (2020-2032) (USD Billion)
12.5.1.11.4 Qatar Oncology Drugs Market Estimates And Forecasts, By Dosage Form (2020-2032) (USD Billion)
12.5.1.11.5 Qatar Oncology Drugs Market Estimates And Forecasts, By Distribution Channel (2020-2032) (USD Billion)
12.5.1.12 Rest Of Middle East
12.5.1.12.1 Rest Of Middle East Oncology Drugs Market Estimates And Forecasts, By Drug Class (2020-2032) (USD Billion)
12.5.1.12.2 Rest Of Middle East Oncology Drugs Market Estimates And Forecasts, By Therapy (2020-2032) (USD Billion)
12.5.1.12.3 Rest Of Middle East Oncology Drugs Market Estimates And Forecasts, By Indication (2020-2032) (USD Billion)
12.5.1.12.4 Rest Of Middle East Oncology Drugs Market Estimates And Forecasts, By Dosage Form (2020-2032) (USD Billion)
12.5.1.12.5 Rest Of Middle East Oncology Drugs Market Estimates And Forecasts, By Distribution Channel (2020-2032) (USD Billion)
12.5.2 Africa
12.5.2.1 Trends Analysis
12.5.2.2 Africa Oncology Drugs Market Estimates And Forecasts, By Country (2020-2032) (USD Billion)
12.5.2.3 Africa Oncology Drugs Market Estimates And Forecasts, By Drug Class (2020-2032) (USD Billion)
12.5.2.4 Africa Oncology Drugs Market Estimates And Forecasts, By Therapy (2020-2032) (USD Billion)
12.5.2.5 Africa Oncology Drugs Market Estimates And Forecasts, By Indication (2020-2032) (USD Billion)
12.5.2.6 Africa Oncology Drugs Market Estimates And Forecasts, By Dosage Form (2020-2032) (USD Billion)
12.5.2.7 Africa Oncology Drugs Market Estimates And Forecasts, By Distribution Channel (2020-2032) (USD Billion)
12.5.2.8 South Africa
12.5.2.8.1 South Africa Oncology Drugs Market Estimates And Forecasts, By Drug Class (2020-2032) (USD Billion)
12.5.2.8.2 South Africa Oncology Drugs Market Estimates And Forecasts, By Therapy (2020-2032) (USD Billion)
12.5.2.8.3 South Africa Oncology Drugs Market Estimates And Forecasts, By Indication (2020-2032) (USD Billion)
12.5.2.8.4 South Africa Oncology Drugs Market Estimates And Forecasts, By Dosage Form (2020-2032) (USD Billion)
12.5.2.8.5 South Africa Oncology Drugs Market Estimates And Forecasts, By Distribution Channel (2020-2032) (USD Billion)
12.5.2.9 Nigeria
12.5.2.9.1 Nigeria Oncology Drugs Market Estimates And Forecasts, By Drug Class (2020-2032) (USD Billion)
12.5.2.9.2 Nigeria Oncology Drugs Market Estimates And Forecasts, By Therapy (2020-2032) (USD Billion)
12.5.2.9.3 Nigeria Oncology Drugs Market Estimates And Forecasts, By Indication (2020-2032) (USD Billion)
12.5.2.9.4 Nigeria Oncology Drugs Market Estimates And Forecasts, By Dosage Form (2020-2032) (USD Billion)
12.5.2.9.5 Nigeria Oncology Drugs Market Estimates And Forecasts, By Distribution Channel (2020-2032) (USD Billion)
12.5.2.10 Rest Of Africa
12.5.2.10.1 Rest Of Africa Oncology Drugs Market Estimates And Forecasts, By Drug Class (2020-2032) (USD Billion)
12.5.2.10.2 Rest Of Africa Oncology Drugs Market Estimates And Forecasts, By Therapy (2020-2032) (USD Billion)
12.5.2.10.3 Rest Of Africa Oncology Drugs Market Estimates And Forecasts, By Indication (2020-2032) (USD Billion)
12.5.2.10.4 Rest Of Africa Oncology Drugs Market Estimates And Forecasts, By Dosage Form (2020-2032) (USD Billion)
12.5.2.10.5 Rest Of Africa Oncology Drugs Market Estimates And Forecasts, By Distribution Channel (2020-2032) (USD Billion)
12.6 Latin America
12.6.1 Trends Analysis
12.6.2 Latin America Oncology Drugs Market Estimates And Forecasts, By Country (2020-2032) (USD Billion)
12.6.3 Latin America Oncology Drugs Market Estimates And Forecasts, By Drug Class (2020-2032) (USD Billion)
12.6.4 Latin America Oncology Drugs Market Estimates And Forecasts, By Therapy (2020-2032) (USD Billion)
12.6.5 Latin America Oncology Drugs Market Estimates And Forecasts, By Indication (2020-2032) (USD Billion)
12.6.6 Latin America Oncology Drugs Market Estimates And Forecasts, By Dosage Form (2020-2032) (USD Billion)
12.6.7 Latin America Oncology Drugs Market Estimates And Forecasts, By Distribution Channel (2020-2032) (USD Billion)
12.6.8 Brazil
12.6.8.1 Brazil Oncology Drugs Market Estimates And Forecasts, By Drug Class (2020-2032) (USD Billion)
12.6.8.2 Brazil Oncology Drugs Market Estimates And Forecasts, By Therapy (2020-2032) (USD Billion)
12.6.8.3 Brazil Oncology Drugs Market Estimates And Forecasts, By Indication (2020-2032) (USD Billion)
12.6.8.4 Brazil Oncology Drugs Market Estimates And Forecasts, By Dosage Form (2020-2032) (USD Billion)
12.6.8.5 Brazil Oncology Drugs Market Estimates And Forecasts, By Distribution Channel (2020-2032) (USD Billion)
12.6.9 Argentina
12.6.9.1 Argentina Oncology Drugs Market Estimates And Forecasts, By Drug Class (2020-2032) (USD Billion)
12.6.9.2 Argentina Oncology Drugs Market Estimates And Forecasts, By Therapy (2020-2032) (USD Billion)
12.6.9.3 Argentina Oncology Drugs Market Estimates And Forecasts, By Indication (2020-2032) (USD Billion)
12.6.9.4 Argentina Oncology Drugs Market Estimates And Forecasts, By Dosage Form (2020-2032) (USD Billion)
12.6.9.5 Argentina Oncology Drugs Market Estimates And Forecasts, By Distribution Channel (2020-2032) (USD Billion)
12.6.10 Colombia
12.6.10.1 Colombia Oncology Drugs Market Estimates And Forecasts, By Drug Class (2020-2032) (USD Billion)
12.6.10.2 Colombia Oncology Drugs Market Estimates And Forecasts, By Therapy (2020-2032) (USD Billion)
12.6.10.3 Colombia Oncology Drugs Market Estimates And Forecasts, By Indication (2020-2032) (USD Billion)
12.6.10.4 Colombia Oncology Drugs Market Estimates And Forecasts, By Dosage Form (2020-2032) (USD Billion)
12.6.10.5 Colombia Oncology Drugs Market Estimates And Forecasts, By Distribution Channel (2020-2032) (USD Billion)
12.6.11 Rest Of Latin America
12.6.11.1 Rest Of Latin America Oncology Drugs Market Estimates And Forecasts, By Drug Class (2020-2032) (USD Billion)
12.6.11.2 Rest Of Latin America Oncology Drugs Market Estimates And Forecasts, By Therapy (2020-2032) (USD Billion)
12.6.11.3 Rest Of Latin America Oncology Drugs Market Estimates And Forecasts, By Indication (2020-2032) (USD Billion)
12.6.11.4 Rest Of Latin America Oncology Drugs Market Estimates And Forecasts, By Dosage Form (2020-2032) (USD Billion)
12.6.11.5 Rest Of Latin America Oncology Drugs Market Estimates And Forecasts, By Distribution Channel (2020-2032) (USD Billion)
13. Company Profiles
13.1 F. Hoffmann-La Roche Ltd.
13.1.1 Company Overview
13.1.2 Financial
13.1.3 Products/ Services Offered
13.1.4 SWOT Analysis
13.2 AbbVie Inc.
13.2.1 Company Overview
13.2.2 Financial
13.2.3 Products/ Services Offered
13.2.4 SWOT Analysis
13.3 Novartis AG
13.3.1 Company Overview
13.3.2 Financial
13.3.3 Products/ Services Offered
13.3.4 SWOT Analysis
13.4 Pfizer Inc.
13.4.1 Company Overview
13.4.2 Financial
13.4.3 Products/ Services Offered
13.4.4 SWOT Analysis
13.5 Bristol Myers Squibb Company
13.5.1 Company Overview
13.5.2 Financial
13.5.3 Products/ Services Offered
13.5.4 SWOT Analysis
13.6 GlaxoSmithKline plc.
13.6.1 Company Overview
13.6.2 Financial
13.6.3 Products/ Services Offered
13.6.4 SWOT Analysis
13.7 Eli Lilly and Company
13.7.1 Company Overview
13.7.2 Financial
13.7.3 Products/ Services Offered
13.7.4 SWOT Analysis
13.8 AstraZeneca
13.8.1 Company Overview
13.8.2 Financial
13.8.3 Products/ Services Offered
13.8.4 SWOT Analysis
13.9 Sanofi
13.9.1 Company Overview
13.9.2 Financial
13.9.3 Products/ Services Offered
13.9.4 SWOT Analysis
13.10 Bayer AG
13.12.1 Company Overview
13.12.2 Financial
13.12.3 Products/ Services Offered
13.12.4 SWOT Analysis
14. Use Cases and Best Practices
15. Conclusion
An accurate research report requires proper strategizing as well as implementation. There are multiple factors involved in the completion of good and accurate research report and selecting the best methodology to compete the research is the toughest part. Since the research reports we provide play a crucial role in any company’s decision-making process, therefore we at SNS Insider always believe that we should choose the best method which gives us results closer to reality. This allows us to reach at a stage wherein we can provide our clients best and accurate investment to output ratio.
Each report that we prepare takes a timeframe of 350-400 business hours for production. Starting from the selection of titles through a couple of in-depth brain storming session to the final QC process before uploading our titles on our website we dedicate around 350 working hours. The titles are selected based on their current market cap and the foreseen CAGR and growth.
The 5 steps process:
Step 1: Secondary Research:
Secondary Research or Desk Research is as the name suggests is a research process wherein, we collect data through the readily available information. In this process we use various paid and unpaid databases which our team has access to and gather data through the same. This includes examining of listed companies’ annual reports, Journals, SEC filling etc. Apart from this our team has access to various associations across the globe across different industries. Lastly, we have exchange relationships with various university as well as individual libraries.
Step 2: Primary Research
When we talk about primary research, it is a type of study in which the researchers collect relevant data samples directly, rather than relying on previously collected data. This type of research is focused on gaining content specific facts that can be sued to solve specific problems. Since the collected data is fresh and first hand therefore it makes the study more accurate and genuine.
We at SNS Insider have divided Primary Research into 2 parts.
Part 1 wherein we interview the KOLs of major players as well as the upcoming ones across various geographic regions. This allows us to have their view over the market scenario and acts as an important tool to come closer to the accurate market numbers. As many as 45 paid and unpaid primary interviews are taken from both the demand and supply side of the industry to make sure we land at an accurate judgement and analysis of the market.
This step involves the triangulation of data wherein our team analyses the interview transcripts, online survey responses and observation of on filed participants. The below mentioned chart should give a better understanding of the part 1 of the primary interview.
Part 2: In this part of primary research the data collected via secondary research and the part 1 of the primary research is validated with the interviews from individual consultants and subject matter experts.
Consultants are those set of people who have at least 12 years of experience and expertise within the industry whereas Subject Matter Experts are those with at least 15 years of experience behind their back within the same space. The data with the help of two main processes i.e., FGDs (Focused Group Discussions) and IDs (Individual Discussions). This gives us a 3rd party nonbiased primary view of the market scenario making it a more dependable one while collation of the data pointers.
Step 3: Data Bank Validation
Once all the information is collected via primary and secondary sources, we run that information for data validation. At our intelligence centre our research heads track a lot of information related to the market which includes the quarterly reports, the daily stock prices, and other relevant information. Our data bank server gets updated every fortnight and that is how the information which we collected using our primary and secondary information is revalidated in real time.
Step 4: QA/QC Process
After all the data collection and validation our team does a final level of quality check and quality assurance to get rid of any unwanted or undesired mistakes. This might include but not limited to getting rid of the any typos, duplication of numbers or missing of any important information. The people involved in this process include technical content writers, research heads and graphics people. Once this process is completed the title gets uploader on our platform for our clients to read it.
Step 5: Final QC/QA Process:
This is the last process and comes when the client has ordered the study. In this process a final QA/QC is done before the study is emailed to the client. Since we believe in giving our clients a good experience of our research studies, therefore, to make sure that we do not lack at our end in any way humanly possible we do a final round of quality check and then dispatch the study to the client.
By Drug Class
Cytotoxic Drugs
Targeted Drugs
Hormonal Drugs
Others
By Therapy
Chemotherapy
Targeted Therapy
Immunotherapy
By Indication
Lung Cancer
Stomach Cancer
Colorectal Cancer
Breast Cancer
Prostate Cancer
Others
By Dosage Form
Solid
Liquid
Injectable
By Distribution Channel
Hospital Pharmacies
Retail Pharmacies
Online Pharmacies
Request for Segment Customization as per your Business Requirement: Segment Customization Request
Regional Coverage:
North America
US
Canada
Mexico
Europe
Eastern Europe
Poland
Romania
Hungary
Turkey
Rest of Eastern Europe
Western Europe
Germany
France
UK
Italy
Spain
Netherlands
Switzerland
Austria
Rest of Western Europe
Asia Pacific
China
India
Japan
South Korea
Vietnam
Singapore
Australia
Rest of Asia Pacific
Middle East & Africa
Middle East
UAE
Egypt
Saudi Arabia
Qatar
Rest of Middle East
Africa
Nigeria
South Africa
Rest of Africa
Latin America
Brazil
Argentina
Colombia
Rest of Latin America
Request for Country Level Research Report: Country Level Customization Request
Available Customization
With the given market data, SNS Insider offers customization as per the company’s specific needs. The following customization options are available for the report:
Detailed Volume Analysis
Criss-Cross segment analysis (e.g. Product X Application)
Competitive Product Benchmarking
Geographic Analysis
Additional countries in any of the regions
Customized Data Representation
Detailed analysis and profiling of additional market players
The Dyspnea Treatment Market Size was valued at USD 6.16 Billion in 2023 and is expected to reach USD 11.01 Billion by 2032 and grow at a CAGR of 6.95% over the forecast period 2024-2032.
The Global Radiopharmaceuticals Market Size was USD 5.0 billion in 2023 & projected to grow at a CAGR of 10.4%, reaching USD 16.6 billion by 2032.
The Neuroscience Market Size was valued at USD 35.3 billion in 2023 and is expected to reach USD 50.2 Billion by 2032, at 4.00% CAGR by 2024-2032
The Non-alcoholic Steatohepatitis Biomarkers Market size was USD 1.14 Billion in 2023, projected to hit USD 9.1 Billion by 2032, with a 25.9% CAGR.
The Cone Beam Computer Tomography (CBCT) Market Size was valued at USD 541.93 million in 2023, and is expected to reach USD 1342.77 million by 2031, and grow at a CAGR of 12.01% over the forecast period 2024-2031.
The Dental Suction Systems Market Size was valued at USD 516.08 Million in 2023 and is expected to reach USD 800.30 Million by 2032 and grow at a CAGR of 5.18% Over the forecast period of 2024-2032.
Hi! Click one of our member below to chat on Phone