Get More Information on OLED-on-Silicon (OLEDoS) Market - Request Sample Report
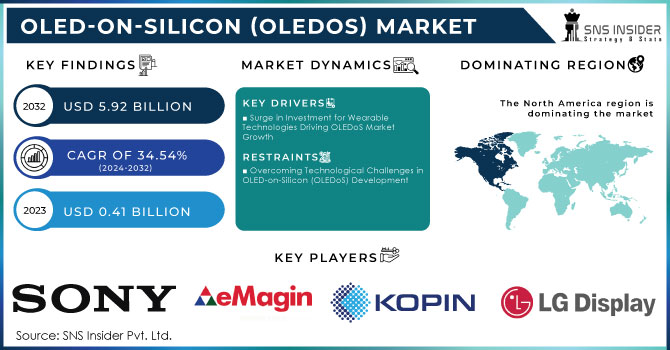
The OLED-on-Silicon (OLEDoS) Market Size was valued at USD 0.41 Billion in 2023 and is expected to reach USD 5.92 Billion by 2032 and grow at a CAGR of 34.54% over the forecast period 2024-2032.
The OLED-on-Silicon (OLEDoS) market is experiencing significant growth, fueled primarily by the surging demand for augmented reality (AR) and virtual reality (VR) devices. As these technologies become increasingly integrated into gaming, training, and education, the need for high-quality displays that can deliver exceptional visual experiences has never been greater. OLEDoS technology offers distinct advantages, including superior color accuracy, high contrast ratios, and rapid response times, which are critical for enhancing user experiences in immersive environments.
| Category | Value (USD) | Percentage (%) |
|---|---|---|
| Total Trade Value (2022) | $32.1B | 100% |
| Top Exporter | ||
| - Vietnam | $22.5B | 70% |
| - China | $8.61B | 26.80% |
| - South Korea | $646M | 2.01% |
| - Japan | $117M | 0.36% |
| - Hong Kong | $71M | 0.22% |
| Top Importer | ||
| - China | $21B | 65.20% |
| - Hong Kong | $5.08B | 15.80% |
| - Vietnam | $1.78B | 5.54% |
| - Mexico | $948M | 2.95% |
| - Poland | $851M | 2.65% |
Advancements in OLEDoS are expected to play a pivotal role in the expansion of XR (extended reality) devices. The ability of OLEDoS to provide vivid and crisp imagery makes it an ideal choice for next-generation AR and VR headsets, which are projected to see a considerable increase in demand. Reports indicate that the market for OLED microdisplays is forecasted to grow from 1 million units in 2020 to approximately 19 million units by 2026. This remarkable growth trajectory highlights the escalating need for innovative display technologies that can meet the demands of modern applications.
The integration of artificial intelligence (AI) in AR and VR experiences is further driving market expansion. With AI enhancing user interactivity and personalization, the demand for displays that can seamlessly integrate these technologies is increasing. Analysts predict that lower costs and improved performance will catalyze a surge in the adoption of VR and AR headsets, leading to significant growth in the OLEDoS market.
Moreover, the versatility of OLEDoS technology is expanding its application beyond gaming and entertainment. Industries such as healthcare, military training and education are exploring the use of AR and VR to improve training efficiency and learning outcomes. The ability of OLEDoS to deliver high-resolution images in compact form factors makes it a valuable asset for wearable devices and other applications requiring lightweight displays.
As the global market for OLED-on-Silicon continues to evolve, manufacturers are investing in research and development to optimize production processes and reduce costs. This commitment to innovation will be crucial in capturing a larger share of the burgeoning AR and VR markets, ensuring that OLEDoS remains a competitive option in the display technology landscape. In summary, the OLEDoS market is on a strong growth trajectory, driven by the rising demand for high-quality displays in AR and VR applications, and is well-positioned to thrive in the rapidly evolving technology sector.
Drivers
Surge in Investment for Wearable Technologies Driving OLEDoS Market Growth
The increasing investment in wearable technologies is significantly driving the growth of the OLED-on-Silicon (OLEDoS) market. As the market for smartwatches, fitness trackers, augmented reality (AR) glasses, and other wearable devices expands, the demand for small, efficient, and high-quality displays is surging. OLEDoS technology perfectly aligns with these compact form factors, providing the high resolution and vibrant color that consumers expect. Industry leaders are actively pursuing innovative designs to enhance user experience and comfort, emphasizing the necessity for display technologies that can seamlessly fit into lightweight, portable devices. As manufacturers develop smarter, more feature-rich wearables, the demand for advanced display solutions, such as OLEDoS, will only continue to rise. For instance, Samsung's recent investment of USD 18 billion in a new OLED manufacturing facility in Vietnam highlights the escalating interest in developing next-generation display technologies tailored for wearable applications. Moreover, the advancement in OLED technology offers numerous benefits, including energy efficiency and better performance, making OLEDoS an ideal choice for devices that require long battery life and reliable functionality. Additionally, as consumer preferences shift toward multifunctional wearables that combine health tracking, communication, and entertainment, the integration of OLEDoS technology becomes essential to meet these growing demands. This is further propelled by the increasing popularity of health and fitness monitoring, where accurate and easily readable displays are crucial for delivering real-time data. Consequently, as investment in wearable technologies continues to grow, so does the necessity for high-quality, compact display solutions like OLEDoS, positioning the market for sustained growth in the coming years. The synergy between OLEDoS technology and the wearable device market underlines a significant opportunity for manufacturers and innovators, paving the way for a future where advanced display capabilities redefine consumer interaction and engagement in the realm of wearable technology.
Restraints
Overcoming Technological Challenges in OLED-on-Silicon (OLEDoS) Development
The advancement of OLED-on-Silicon (OLEDoS) displays presents several intricate technological challenges that can hinder market growth. Central to these issues are complex manufacturing processes, which require precise control over variables such as temperature, pressure, and material quality, making it difficult to maintain consistent product quality. Additionally, achieving high yield rates is essential for cost-effective production; however, defects often occur due to material impurities or equipment failures, resulting in increased costs per unit.
Quality control is crucial, as any defects can negatively impact color accuracy, contrast ratio, and user experience, necessitating rigorous measures that can further complicate the manufacturing process and limit scalability. Substantial research and development investments are vital for innovation, but the associated costs can deter smaller companies from entering the market. Lastly, ensuring OLEDoS displays integrate seamlessly with existing technologies is critical for successful application in AR/VR devices and wearables. by addressing these challenges through innovation and advanced manufacturing techniques, the OLEDoS market can achieve significant growth.
by Display Size
Based On Display Size, More than 1” is capture the largest share revenue in OLED-on-Silicon (OLEDoS) Market of around 69% in 2023. The significant market share of OLED-on-Silicon (OLEDoS) displays more than 1 inch can be attributed to several key factors reflecting current industry trends and consumer preferences. The increasing popularity of augmented reality (AR) and virtual reality (VR) technologies has elevated the demand for high-quality displays that provide immersive experiences essential for gaming and interactive applications. Additionally, the rising adoption of wearable devices, such as smartwatches and AR glasses, necessitates displays more than 1 inch that improve usability by presenting information more clearly and efficiently. Furthermore, displays larger than 1 inch are preferred for various applications, including gaming and media consumption, as users seek superior color accuracy, contrast, and responsiveness for an enhanced experience. Recent advancements in OLEDoS technology, particularly in manufacturing processes and energy efficiency, have made it feasible to produce these larger displays without compromising quality. As consumer preferences shift towards more capable devices, manufacturers are increasingly focusing on OLEDoS displays that cater to these demands. Looking ahead, the segment of displays more than 1 inch is expected to experience continued growth, solidifying its critical role within the OLEDoS market landscape. Companies prioritizing the development of larger displays will be well positioned to leverage these emerging trends.
by Vertical
The Consumer vertical holds the largest revenue share in the OLED-on-Silicon (OLEDoS) market, accounting for around 55% in 2023. This dominance stems from several factors driving the demand for advanced display technologies in consumer electronics. The increasing need for high-quality displays is evident as consumers seek devices that offer high-definition visuals and immersive experiences. OLEDoS technology excels in providing superior color accuracy, high contrast, and rapid response times, making it a preferred choice for smartphones, tablets, smartwatches, and AR/VR headsets. Additionally, the growing popularity of augmented reality (AR) and virtual reality (VR) applications significantly influences this vertical, as OLEDoS displays deliver the clarity and responsiveness essential for immersive experiences. The expansion of wearable technologies, such as fitness trackers and AR glasses, further boosts demand, with OLEDoS gaining traction for its compact design and exceptional performance. Moreover, advancements in OLEDoS technology, including improved manufacturing processes and energy efficiency, allow for high-quality displays at lower costs, enhancing competitiveness in the consumer market. Overall, the rising demand for high-quality displays in smartphones, AR/VR devices, and wearables positions the Consumer vertical as a critical segment in the OLEDoS market, likely to sustain its growth trajectory.
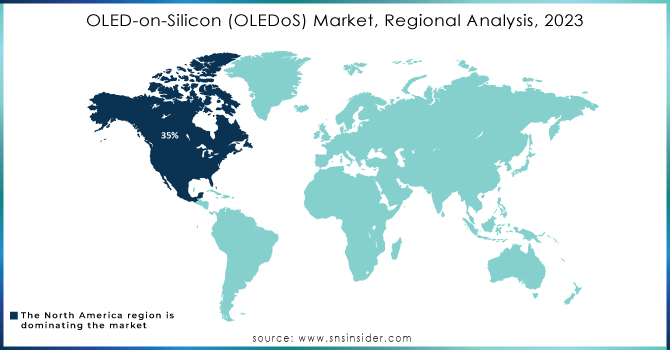
North America is a dominant force in the OLED-on-Silicon (OLEDoS) market, holding approximately 35% of the total revenue in 2023. Several factors contribute to this leadership, notably the region's focus on technological innovation, primarily driven by major companies and research institutions in the United States and Canada. High demand for advanced consumer electronics, including smartphones, tablets, and AR/VR devices, propels manufacturers to adopt OLEDoS technology to enhance display quality. The growing interest in AR and VR applications, particularly among tech giants like Meta and Microsoft, further fuels demand for OLEDoS displays due to their superior visual quality. Strategic collaborations between universities and technology firms foster innovation, strengthening the region's market position. Additionally, consumer preferences for larger, high-quality displays for entertainment and productivity drive the adoption of OLEDoS technology across various devices. Regionally, the U.S. invests heavily in OLEDoS through tech giants and startups, while Canada’s tech hubs in cities like Toronto and Vancouver contribute to advancements in the field. Mexico plays a vital role in manufacturing electronic components, attracting investments from OLEDoS players. Looking ahead, North America is poised to maintain its market leadership as technological advancements and consumer demand continue to grow.
The Asia Pacific region is rapidly emerging as the fastest-growing market for OLED-on-Silicon (OLEDoS) technology in 2023, fueled by several critical factors. The surging demand for advanced consumer electronics, such as smartphones, tablets, and wearables, is particularly pronounced in countries like China, Japan, and South Korea, where manufacturers are investing significantly in OLEDoS technology to meet consumer expectations for superior display quality. Additionally, there is a notable rise in the adoption of augmented reality (AR) and virtual reality (VR) applications across various sectors, including gaming and healthcare, with companies like Sony and HTC leveraging OLEDoS displays to enhance immersive experiences. Technological advancements in manufacturing processes and materials science further drive innovation, making OLEDoS an attractive choice for enhancing product offerings. Furthermore, substantial investments in research and development by governments and private sectors, especially in South Korea and China, position the region as a hub for future display technology advancements. Manufacturers in Asia Pacific, particularly in China and Taiwan, are also expanding production capabilities to satisfy growing demand. Looking ahead, the Asia Pacific OLEDoS market is poised for sustained growth, driven by evolving consumer preferences and strategic partnerships among local and international firms
Need Any Customization Research On OLED-on-Silicon (OLEDoS) Market - Inquiry Now
Key Players
Some of the key Players in OLED-on-Silicon (OLEDoS) Market who provide product and offering:
Sony Corporation (Microdisplays for VR and AR applications)
eMagin Corporation (OLED microdisplays for head-mounted displays)
Kopin Corporation (OLED displays for wearable devices)
LG Display Co., Ltd. (OLEDoS technology for VR and AR headsets)
MicroOLED (High-resolution OLED microdisplays for augmented reality)
Himax Technologies (OLED-on-silicon displays for augmented reality)
Fraunhofer FEP (Research and development of OLED technologies)
BOE Technology Group (OLED displays for various applications)
Panasonic Corporation (Display solutions for AR and VR applications)
Jasper Display Corp. (OLED microdisplays for wearables)
Samsung Display (OLEDoS for mixed reality devices)
Universal Display Corporation (OLED materials and technologies)
Rohm Semiconductor (OLED drivers and components)
Synaptics Incorporated (OLED technology for display solutions)
Sharp Corporation (OLED displays for various applications)
Seiko Epson Corporation (OLED microdisplays for smart glasses)
Dai Nippon Printing Co., Ltd. (OLED technology for display applications)
Vuzix Corporation (Smart glasses with OLED technology)
Aledia (3D LED-on-silicon technology for displays)
Nippon Seiki Co., Ltd. (OLED displays for automotive applications)
List of Suppliers in OLED-on-Silicon (OLEDoS) Market:
Sony Corporation
LG Display Co., Ltd.
eMagin Corporation
Kopin Corporation
MicroOLED
Himax Technologies
BOE Technology Group
Panasonic Corporation
Samsung Display
Universal Display Corporation
Recent Development
On August 12, 2024, Samsung Display (SDC) reportedly signed a contract with Microsoft to develop and supply OLED on Silicon (OLEDoS) for the next generation of Mixed Reality (MR) devices, focusing on enhancing gaming and movie experiences. While the exact supply quantity remains undisclosed, estimates suggest it could reach hundreds of thousands of units, with potential device launches not expected until 2026.
On October 10, 2024, Microsoft announced the rollout of the Windows 11 24H2 update, introducing AI-powered recall features and various enhancements aimed at improving user experience and productivity. This update reflects Microsoft's commitment to integrating artificial intelligence into its operating systems.
On May 16, 2024, LG introduced its latest OLED technology, OLEDoS, at Display Week in San Jose, California. This innovative small form-factor 4K OLED display is designed for various applications, including smartwatches and VR headsets, aiming to enhance visual experiences and potentially reduce motion sickness in virtual reality environments.
On August 10, 2024, reports indicated that Apple is exploring new OLED suppliers to potentially create a more affordable version of its Vision Pro headset. This move reflects the company's strategy to diversify its supply chain while aiming to make advanced augmented reality technology more accessible to consumers.
| Report Attributes | Details |
|---|---|
| Market Size in 2023 | USD 0.41 Billion |
| Market Size by 2032 | USD 5.92 Billion |
| CAGR | CAGR of 34.54 % From 2024 to 2032 |
| Base Year | 2023 |
| Forecast Period | 2024-2032 |
| Historical Data | 2020-2022 |
| Report Scope & Coverage | Market Size, Segments Analysis, Competitive Landscape, Regional Analysis, DROC & SWOT Analysis, Forecast Outlook |
| Key Segments | • By Product (Near-Eye Display, Head-up Display, Others) • By Display Size (More than 1”, Less than 1”) • By Vertical (Consumer, Aerospace & Defense, Industrial & Enterprise, Others) |
| Regional Analysis/Coverage | North America (US, Canada, Mexico), Europe (Eastern Europe [Poland, Romania, Hungary, Turkey, Rest of Eastern Europe] Western Europe] Germany, France, UK, Italy, Spain, Netherlands, Switzerland, Austria, Rest of Western Europe]), Asia-Pacific (China, India, Japan, South Korea, Vietnam, Singapore, Australia, Rest of Asia-Pacific), Middle East & Africa (Middle East [UAE, Egypt, Saudi Arabia, Qatar, Rest of Middle East], Africa [Nigeria, South Africa, Rest of Africa], Latin America (Brazil, Argentina, Colombia, Rest of Latin America) |
| Company Profiles | Sony, eMagin, Kopin, LG Display, MicroOLED, Himax Technologies, Fraunhofer FEP, BOE Technology Group, Panasonic, Jasper Display, Samsung Display, Universal Display, Rohm Semiconductor, Synaptics, Sharp, Seiko Epson, Dai Nippon Printing, Vuzix, Aledia, and Nippon Seiki. |
| Key Drivers | • Surge in Investment for Wearable Technologies Driving OLEDoS Market Growth |
| RESTRAINTS | • Overcoming Technological Challenges in OLED-on-Silicon (OLEDoS) Development |
Ans: OLED-on-Silicon (OLEDoS) Market size was valued at USD 0.41 Billion in 2023 and is expected to reach USD 5.92 Billion by 2032
Ans: The OLED-on-Silicon (OLEDoS) Market grow at a CAGR of 34.54% over the forecast period of 2024-2032.
The AR/VR industry, healthcare (for medical imaging), defense (for heads-up displays), and consumer electronics sectors are leading in the adoption of OLED-on-Silicon technology due to its superior image quality and compact form factors
Ans: Sony, eMagin, Kopin, LG Display, MicroOLED, Himax Technologies, Fraunhofer FEP, BOE Technology Group, Panasonic, Jasper Display, Samsung Display, Universal Display, Rohm Semiconductor, Synaptics, Sharp, Seiko Epson, Dai Nippon Printing, Vuzix, Aledia, and Nippon Seiki.
OLED-on-Silicon (OLEDoS) is a microdisplay technology that integrates organic light-emitting diodes (OLEDs) onto a silicon substrate, used in applications like AR/VR headsets, smart glasses, and other compact displays.
Table of Content
1. Introduction
1.1 Market Definition
1.2 Scope (Inclusion and Exclusions)
1.3 Research Assumptions
2. Executive Summary
2.1 Market Overview
2.2 Regional Synopsis
2.3 Competitive Summary
3. Research Methodology
3.1 Top-Down Approach
3.2 Bottom-up Approach
3.3. Data Validation
3.4 Primary Interviews
4. Market Dynamics Impact Analysis
4.1 Market Driving Factors Analysis
4.1.1 Drivers
4.1.2 Restraints
4.1.3 Opportunities
4.1.4 Challenges
4.2 PESTLE Analysis
4.3 Porter’s Five Forces Model
5. Statistical Insights and Trends Reporting
5.1 Wafer Production Volumes, by Region (2023)
5.2 Chip Design Trends (Historic and Future)
5.3 Fab Capacity Utilization (2023)
5.4 Supply Chain Metrics
6. Competitive Landscape
6.1 List of Major Companies, by Region
6.2 Market Share Analysis, by Region
6.3 Product Benchmarking
6.3.1 Product specifications and features
6.3.2 Pricing
6.4 Strategic Initiatives
6.4.1 Marketing and promotional activities
6.4.2 Distribution and supply chain strategies
6.4.3 Expansion plans and new product launches
6.4.4 Strategic partnerships and collaborations
6.5 Technological Advancements
6.6 Market Positioning and Branding
7. OLED-on-Silicon (OLEDoS) Market Segmentation, by Product Type
7.1 Chapter Overview
7.2 Near-Eye Display
7.2.1 Near-Eye Display Market Trends Analysis (2020-2032)
7.2.2 Near-Eye Display Market Size Estimates and Forecasts to 2032 (USD Billion)
7.2.3 Head-Mounted Display
7.2.3.1 Head-Mounted Display Market Trends Analysis (2020-2032)
7.2.3.2 Head-Mounted Display Market Size Estimates and Forecasts to 2032 (USD Billion)
7.2.4 Electronic Viewfinder
7.2.4.1 Electronic Viewfinder Market Trends Analysis (2020-2032)
7.2.4.2 Electronic Viewfinder Market Size Estimates and Forecasts to 2032 (USD Billion)
7.3 Head-up Display
7.3.1 Head-up Display Market Trends Analysis (2020-2032)
7.3.2 Head-up Display Market Size Estimates and Forecasts to 2032 (USD Billion)
7.4 Other Product Type
7.4.1 Other Product Type Market Trends Analysis (2020-2032)
7.4.2 Other Product Type Market Size Estimates and Forecasts to 2032 (USD Billion)
8. OLED-on-Silicon (OLEDoS) Market Segmentation, by Display Size
8.1 Chapter Overview
8.2 More than 1”
8.2.1 More than 1” Market Trends Analysis (2020-2032)
8.2.2 More than 1” Market Size Estimates and Forecasts to 2032 (USD Billion)
8.3 Less than 1”
8.3.1 Less than 1” Market Trends Analysis (2020-2032)
8.3.2 Less than 1” Market Size Estimates and Forecasts to 2032 (USD Billion)
9. OLED-on-Silicon (OLEDoS) Market Segmentation, by Vertical
9.1 Chapter Overview
9.2 Consumer
9.2.1 Consumer Market Trends Analysis (2020-2032)
9.2.2 Consumer Market Size Estimates and Forecasts to 2032 (USD Billion)
9.3 Aerospace & Defense
9.3.1 Aerospace & Defense Market Trends Analysis (2020-2032)
9.3.2 Aerospace & Defense Market Size Estimates and Forecasts to 2032 (USD Billion)
9.4 Industrial & Enterprise
9.4.1 Industrial & Enterprise Market Trends Analysis (2020-2032)
9.4.2 Industrial & Enterprise Market Size Estimates and Forecasts to 2032 (USD Billion)
9.5 Others
9.5.1 Others Market Trends Analysis (2020-2032)
9.5.2 Others Market Size Estimates and Forecasts to 2032 (USD Billion)
10. Regional Analysis
10.1 Chapter Overview
10.2 North America
10.2.1 Trends Analysis
10.2.2 North America OLED-on-Silicon (OLEDoS) Market Estimates and Forecasts, by Country (2020-2032) (USD Billion)
10.2.3 North America OLED-on-Silicon (OLEDoS) Market Estimates and Forecasts, by Product Type (2020-2032) (USD Billion)
10.2.4 North America OLED-on-Silicon (OLEDoS) Market Estimates and Forecasts, by Display Size (2020-2032) (USD Billion)
10.2.5 North America OLED-on-Silicon (OLEDoS) Market Estimates and Forecasts, by Vertical (2020-2032) (USD Billion)
10.2.6 USA
10.2.6.1 USA OLED-on-Silicon (OLEDoS) Market Estimates and Forecasts, by Product Type (2020-2032) (USD Billion)
10.2.6.2 USA OLED-on-Silicon (OLEDoS) Market Estimates and Forecasts, by Display Size (2020-2032) (USD Billion)
10.2.6.3 USA OLED-on-Silicon (OLEDoS) Market Estimates and Forecasts, by Vertical (2020-2032) (USD Billion)
10.2.7 Canada
10.2.7.1 Canada OLED-on-Silicon (OLEDoS) Market Estimates and Forecasts, by Product Type (2020-2032) (USD Billion)
10.2.7.2 Canada OLED-on-Silicon (OLEDoS) Market Estimates and Forecasts, by Display Size (2020-2032) (USD Billion)
10.2.7.3 Canada OLED-on-Silicon (OLEDoS) Market Estimates and Forecasts, by Vertical (2020-2032) (USD Billion)
10.2.8 Mexico
10.2.8.1 Mexico OLED-on-Silicon (OLEDoS) Market Estimates and Forecasts, by Product Type (2020-2032) (USD Billion)
10.2.8.2 Mexico OLED-on-Silicon (OLEDoS) Market Estimates and Forecasts, by Display Size (2020-2032) (USD Billion)
10.2.8.3 Mexico OLED-on-Silicon (OLEDoS) Market Estimates and Forecasts, by Vertical (2020-2032) (USD Billion)
10.3 Europe
10.3.1 Eastern Europe
10.3.1.1 Trends Analysis
10.3.1.2 Eastern Europe OLED-on-Silicon (OLEDoS) Market Estimates and Forecasts, by Country (2020-2032) (USD Billion)
10.3.1.3 Eastern Europe OLED-on-Silicon (OLEDoS) Market Estimates and Forecasts, by Product Type (2020-2032) (USD Billion)
10.3.1.4 Eastern Europe OLED-on-Silicon (OLEDoS) Market Estimates and Forecasts, by Display Size (2020-2032) (USD Billion)
10.3.1.5 Eastern Europe OLED-on-Silicon (OLEDoS) Market Estimates and Forecasts, by Vertical (2020-2032) (USD Billion)
10.3.1.6 Poland
10.3.1.6.1 Poland OLED-on-Silicon (OLEDoS) Market Estimates and Forecasts, by Product Type (2020-2032) (USD Billion)
10.3.1.6.2 Poland OLED-on-Silicon (OLEDoS) Market Estimates and Forecasts, by Display Size (2020-2032) (USD Billion)
10.3.1.6.3 Poland OLED-on-Silicon (OLEDoS) Market Estimates and Forecasts, by Vertical (2020-2032) (USD Billion)
10.3.1.7 Romania
10.3.1.7.1 Romania OLED-on-Silicon (OLEDoS) Market Estimates and Forecasts, by Product Type (2020-2032) (USD Billion)
10.3.1.7.2 Romania OLED-on-Silicon (OLEDoS) Market Estimates and Forecasts, by Display Size (2020-2032) (USD Billion)
10.3.1.7.3 Romania OLED-on-Silicon (OLEDoS) Market Estimates and Forecasts, by Vertical (2020-2032) (USD Billion)
10.3.1.8 Hungary
10.3.1.8.1 Hungary OLED-on-Silicon (OLEDoS) Market Estimates and Forecasts, by Product Type (2020-2032) (USD Billion)
10.3.1.8.2 Hungary OLED-on-Silicon (OLEDoS) Market Estimates and Forecasts, by Display Size (2020-2032) (USD Billion)
10.3.1.8.3 Hungary OLED-on-Silicon (OLEDoS) Market Estimates and Forecasts, by Vertical (2020-2032) (USD Billion)
10.3.1.9 Turkey
10.3.1.9.1 Turkey OLED-on-Silicon (OLEDoS) Market Estimates and Forecasts, by Product Type (2020-2032) (USD Billion)
10.3.1.9.2 Turkey OLED-on-Silicon (OLEDoS) Market Estimates and Forecasts, by Display Size (2020-2032) (USD Billion)
10.3.1.9.3 Turkey OLED-on-Silicon (OLEDoS) Market Estimates and Forecasts, by Vertical (2020-2032) (USD Billion)
10.3.1.10 Rest of Eastern Europe
10.3.1.10.1 Rest of Eastern Europe OLED-on-Silicon (OLEDoS) Market Estimates and Forecasts, by Product Type (2020-2032) (USD Billion)
10.3.1.10.2 Rest of Eastern Europe OLED-on-Silicon (OLEDoS) Market Estimates and Forecasts, by Display Size (2020-2032) (USD Billion)
10.3.1.10.3 Rest of Eastern Europe OLED-on-Silicon (OLEDoS) Market Estimates and Forecasts, by Vertical (2020-2032) (USD Billion)
10.3.2 Western Europe
10.3.2.1 Trends Analysis
10.3.2.2 Western Europe OLED-on-Silicon (OLEDoS) Market Estimates and Forecasts, by Country (2020-2032) (USD Billion)
10.3.2.3 Western Europe OLED-on-Silicon (OLEDoS) Market Estimates and Forecasts, by Product Type (2020-2032) (USD Billion)
10.3.2.4 Western Europe OLED-on-Silicon (OLEDoS) Market Estimates and Forecasts, by Display Size (2020-2032) (USD Billion)
10.3.2.5 Western Europe OLED-on-Silicon (OLEDoS) Market Estimates and Forecasts, by Vertical (2020-2032) (USD Billion)
10.3.2.6 Germany
10.3.2.6.1 Germany OLED-on-Silicon (OLEDoS) Market Estimates and Forecasts, by Product Type (2020-2032) (USD Billion)
10.3.2.6.2 Germany OLED-on-Silicon (OLEDoS) Market Estimates and Forecasts, by Display Size (2020-2032) (USD Billion)
10.3.2.6.3 Germany OLED-on-Silicon (OLEDoS) Market Estimates and Forecasts, by Vertical (2020-2032) (USD Billion)
10.3.2.7 France
10.3.2.7.1 France OLED-on-Silicon (OLEDoS) Market Estimates and Forecasts, by Product Type (2020-2032) (USD Billion)
10.3.2.7.2 France OLED-on-Silicon (OLEDoS) Market Estimates and Forecasts, by Display Size (2020-2032) (USD Billion)
10.3.2.7.3 France OLED-on-Silicon (OLEDoS) Market Estimates and Forecasts, by Vertical (2020-2032) (USD Billion)
10.3.2.8 UK
10.3.2.8.1 UK OLED-on-Silicon (OLEDoS) Market Estimates and Forecasts, by Product Type (2020-2032) (USD Billion)
10.3.2.8.2 UK OLED-on-Silicon (OLEDoS) Market Estimates and Forecasts, by Display Size (2020-2032) (USD Billion)
10.3.2.8.3 UK OLED-on-Silicon (OLEDoS) Market Estimates and Forecasts, by Vertical (2020-2032) (USD Billion)
10.3.2.9 Italy
10.3.2.9.1 Italy OLED-on-Silicon (OLEDoS) Market Estimates and Forecasts, by Product Type (2020-2032) (USD Billion)
10.3.2.9.2 Italy OLED-on-Silicon (OLEDoS) Market Estimates and Forecasts, by Display Size (2020-2032) (USD Billion)
10.3.2.9.3 Italy OLED-on-Silicon (OLEDoS) Market Estimates and Forecasts, by Vertical (2020-2032) (USD Billion)
10.3.2.10 Spain
10.3.2.10.1 Spain OLED-on-Silicon (OLEDoS) Market Estimates and Forecasts, by Product Type (2020-2032) (USD Billion)
10.3.2.10.2 Spain OLED-on-Silicon (OLEDoS) Market Estimates and Forecasts, by Display Size (2020-2032) (USD Billion)
10.3.2.10.3 Spain OLED-on-Silicon (OLEDoS) Market Estimates and Forecasts, by Vertical (2020-2032) (USD Billion)
10.3.2.11 Netherlands
10.3.2.11.1 Netherlands OLED-on-Silicon (OLEDoS) Market Estimates and Forecasts, by Product Type (2020-2032) (USD Billion)
10.3.2.11.2 Netherlands OLED-on-Silicon (OLEDoS) Market Estimates and Forecasts, by Display Size (2020-2032) (USD Billion)
10.3.2.11.3 Netherlands OLED-on-Silicon (OLEDoS) Market Estimates and Forecasts, by Vertical (2020-2032) (USD Billion)
10.3.2.12 Switzerland
10.3.2.12.1 Switzerland OLED-on-Silicon (OLEDoS) Market Estimates and Forecasts, by Product Type (2020-2032) (USD Billion)
10.3.2.12.2 Switzerland OLED-on-Silicon (OLEDoS) Market Estimates and Forecasts, by Display Size (2020-2032) (USD Billion)
10.3.2.12.3 Switzerland OLED-on-Silicon (OLEDoS) Market Estimates and Forecasts, by Vertical (2020-2032) (USD Billion)
10.3.2.13 Austria
10.3.2.13.1 Austria OLED-on-Silicon (OLEDoS) Market Estimates and Forecasts, by Product Type (2020-2032) (USD Billion)
10.3.2.13.2 Austria OLED-on-Silicon (OLEDoS) Market Estimates and Forecasts, by Display Size (2020-2032) (USD Billion)
10.3.2.13.3 Austria OLED-on-Silicon (OLEDoS) Market Estimates and Forecasts, by Vertical (2020-2032) (USD Billion)
10.3.2.14 Rest of Western Europe
10.3.2.14.1 Rest of Western Europe OLED-on-Silicon (OLEDoS) Market Estimates and Forecasts, by Product Type (2020-2032) (USD Billion)
10.3.2.14.2 Rest of Western Europe OLED-on-Silicon (OLEDoS) Market Estimates and Forecasts, by Display Size (2020-2032) (USD Billion)
10.3.2.14.3 Rest of Western Europe OLED-on-Silicon (OLEDoS) Market Estimates and Forecasts, by Vertical (2020-2032) (USD Billion)
10.4 Asia-Pacific
10.4.1 Trends Analysis
10.4.2 Asia-Pacific OLED-on-Silicon (OLEDoS) Market Estimates and Forecasts, by Country (2020-2032) (USD Billion)
10.4.3 Asia-Pacific OLED-on-Silicon (OLEDoS) Market Estimates and Forecasts, by Product Type (2020-2032) (USD Billion)
10.4.4 Asia-Pacific OLED-on-Silicon (OLEDoS) Market Estimates and Forecasts, by Display Size (2020-2032) (USD Billion)
10.4.5 Asia-Pacific OLED-on-Silicon (OLEDoS) Market Estimates and Forecasts, by Vertical (2020-2032) (USD Billion)
10.4.6 China
10.4.6.1 China OLED-on-Silicon (OLEDoS) Market Estimates and Forecasts, by Product Type (2020-2032) (USD Billion)
10.4.6.2 China OLED-on-Silicon (OLEDoS) Market Estimates and Forecasts, by Display Size (2020-2032) (USD Billion)
10.4.6.3 China OLED-on-Silicon (OLEDoS) Market Estimates and Forecasts, by Vertical (2020-2032) (USD Billion)
10.4.7 India
10.4.7.1 India OLED-on-Silicon (OLEDoS) Market Estimates and Forecasts, by Product Type (2020-2032) (USD Billion)
10.4.7.2 India OLED-on-Silicon (OLEDoS) Market Estimates and Forecasts, by Display Size (2020-2032) (USD Billion)
10.4.7.3 India OLED-on-Silicon (OLEDoS) Market Estimates and Forecasts, by Vertical (2020-2032) (USD Billion)
10.4.8 Japan
10.4.8.1 Japan OLED-on-Silicon (OLEDoS) Market Estimates and Forecasts, by Product Type (2020-2032) (USD Billion)
10.4.8.2 Japan OLED-on-Silicon (OLEDoS) Market Estimates and Forecasts, by Display Size (2020-2032) (USD Billion)
10.4.8.3 Japan OLED-on-Silicon (OLEDoS) Market Estimates and Forecasts, by Vertical (2020-2032) (USD Billion)
10.4.9 South Korea
10.4.9.1 South Korea OLED-on-Silicon (OLEDoS) Market Estimates and Forecasts, by Product Type (2020-2032) (USD Billion)
10.4.9.2 South Korea OLED-on-Silicon (OLEDoS) Market Estimates and Forecasts, by Display Size (2020-2032) (USD Billion)
10.4.9.3 South Korea OLED-on-Silicon (OLEDoS) Market Estimates and Forecasts, by Vertical (2020-2032) (USD Billion)
10.4.10 Vietnam
10.4.10.1 Vietnam OLED-on-Silicon (OLEDoS) Market Estimates and Forecasts, by Product Type (2020-2032) (USD Billion)
10.4.10.2 Vietnam OLED-on-Silicon (OLEDoS) Market Estimates and Forecasts, by Display Size (2020-2032) (USD Billion)
10.4.10.3 Vietnam OLED-on-Silicon (OLEDoS) Market Estimates and Forecasts, by Vertical (2020-2032) (USD Billion)
10.4.11 Singapore
10.4.11.1 Singapore OLED-on-Silicon (OLEDoS) Market Estimates and Forecasts, by Product Type (2020-2032) (USD Billion)
10.4.11.2 Singapore OLED-on-Silicon (OLEDoS) Market Estimates and Forecasts, by Display Size (2020-2032) (USD Billion)
10.4.11.3 Singapore OLED-on-Silicon (OLEDoS) Market Estimates and Forecasts, by Vertical (2020-2032) (USD Billion)
10.4.12 Australia
10.4.12.1 Australia OLED-on-Silicon (OLEDoS) Market Estimates and Forecasts, by Product Type (2020-2032) (USD Billion)
10.4.12.2 Australia OLED-on-Silicon (OLEDoS) Market Estimates and Forecasts, by Display Size (2020-2032) (USD Billion)
10.4.12.3 Australia OLED-on-Silicon (OLEDoS) Market Estimates and Forecasts, by Vertical (2020-2032) (USD Billion)
10.4.13 Rest of Asia-Pacific
10.4.13.1 Rest of Asia-Pacific OLED-on-Silicon (OLEDoS) Market Estimates and Forecasts, by Product Type (2020-2032) (USD Billion)
10.4.13.2 Rest of Asia-Pacific OLED-on-Silicon (OLEDoS) Market Estimates and Forecasts, by Display Size (2020-2032) (USD Billion)
10.4.13.3 Rest of Asia-Pacific OLED-on-Silicon (OLEDoS) Market Estimates and Forecasts, by Vertical (2020-2032) (USD Billion)
10.5 Middle East and Africa
10.5.1 Middle East
10.5.1.1 Trends Analysis
10.5.1.2 Middle East OLED-on-Silicon (OLEDoS) Market Estimates and Forecasts, by Country (2020-2032) (USD Billion)
10.5.1.3 Middle East OLED-on-Silicon (OLEDoS) Market Estimates and Forecasts, by Product Type (2020-2032) (USD Billion)
10.5.1.4 Middle East OLED-on-Silicon (OLEDoS) Market Estimates and Forecasts, by Display Size (2020-2032) (USD Billion)
10.5.1.5 Middle East OLED-on-Silicon (OLEDoS) Market Estimates and Forecasts, by Vertical (2020-2032) (USD Billion)
10.5.1.6 UAE
10.5.1.6.1 UAE OLED-on-Silicon (OLEDoS) Market Estimates and Forecasts, by Product Type (2020-2032) (USD Billion)
10.5.1.6.2 UAE OLED-on-Silicon (OLEDoS) Market Estimates and Forecasts, by Display Size (2020-2032) (USD Billion)
10.5.1.6.3 UAE OLED-on-Silicon (OLEDoS) Market Estimates and Forecasts, by Vertical (2020-2032) (USD Billion)
10.5.1.7 Egypt
10.5.1.7.1 Egypt OLED-on-Silicon (OLEDoS) Market Estimates and Forecasts, by Product Type (2020-2032) (USD Billion)
10.5.1.7.2 Egypt OLED-on-Silicon (OLEDoS) Market Estimates and Forecasts, by Display Size (2020-2032) (USD Billion)
10.5.1.7.3 Egypt OLED-on-Silicon (OLEDoS) Market Estimates and Forecasts, by Vertical (2020-2032) (USD Billion)
10.5.1.8 Saudi Arabia
10.5.1.8.1 Saudi Arabia OLED-on-Silicon (OLEDoS) Market Estimates and Forecasts, by Product Type (2020-2032) (USD Billion)
10.5.1.8.2 Saudi Arabia OLED-on-Silicon (OLEDoS) Market Estimates and Forecasts, by Display Size (2020-2032) (USD Billion)
10.5.1.8.3 Saudi Arabia OLED-on-Silicon (OLEDoS) Market Estimates and Forecasts, by Vertical (2020-2032) (USD Billion)
10.5.1.9 Qatar
10.5.1.9.1 Qatar OLED-on-Silicon (OLEDoS) Market Estimates and Forecasts, by Product Type (2020-2032) (USD Billion)
10.5.1.9.2 Qatar OLED-on-Silicon (OLEDoS) Market Estimates and Forecasts, by Display Size (2020-2032) (USD Billion)
10.5.1.9.3 Qatar OLED-on-Silicon (OLEDoS) Market Estimates and Forecasts, by Vertical (2020-2032) (USD Billion)
10.5.1.10 Rest of Middle East
10.5.1.10.1 Rest of Middle East OLED-on-Silicon (OLEDoS) Market Estimates and Forecasts, by Product Type (2020-2032) (USD Billion)
10.5.1.10.2 Rest of Middle East OLED-on-Silicon (OLEDoS) Market Estimates and Forecasts, by Display Size (2020-2032) (USD Billion)
10.5.1.10.3 Rest of Middle East OLED-on-Silicon (OLEDoS) Market Estimates and Forecasts, by Vertical (2020-2032) (USD Billion)
10.5.2 Africa
10.5.2.1 Trends Analysis
10.5.2.2 Africa OLED-on-Silicon (OLEDoS) Market Estimates and Forecasts, by Country (2020-2032) (USD Billion)
10.5.2.3 Africa OLED-on-Silicon (OLEDoS) Market Estimates and Forecasts, by Product Type (2020-2032) (USD Billion)
10.5.2.4 Africa OLED-on-Silicon (OLEDoS) Market Estimates and Forecasts, by Display Size (2020-2032) (USD Billion)
10.5.2.5 Africa OLED-on-Silicon (OLEDoS) Market Estimates and Forecasts, by Vertical (2020-2032) (USD Billion)
10.5.2.6 South Africa
10.5.2.6.1 South Africa OLED-on-Silicon (OLEDoS) Market Estimates and Forecasts, by Product Type (2020-2032) (USD Billion)
10.5.2.6.2 South Africa OLED-on-Silicon (OLEDoS) Market Estimates and Forecasts, by Display Size (2020-2032) (USD Billion)
10.5.2.6.3 South Africa OLED-on-Silicon (OLEDoS) Market Estimates and Forecasts, by Vertical (2020-2032) (USD Billion)
10.5.2.7 Nigeria
10.5.2.7.1 Nigeria OLED-on-Silicon (OLEDoS) Market Estimates and Forecasts, by Product Type (2020-2032) (USD Billion)
10.5.2.7.2 Nigeria OLED-on-Silicon (OLEDoS) Market Estimates and Forecasts, by Display Size (2020-2032) (USD Billion)
10.5.2.7.3 Nigeria OLED-on-Silicon (OLEDoS) Market Estimates and Forecasts, by Vertical (2020-2032) (USD Billion)
10.5.2.8 Rest of Africa
10.5.2.8.1 Rest of Africa OLED-on-Silicon (OLEDoS) Market Estimates and Forecasts, by Product Type (2020-2032) (USD Billion)
10.5.2.8.2 Rest of Africa OLED-on-Silicon (OLEDoS) Market Estimates and Forecasts, by Display Size (2020-2032) (USD Billion)
10.5.2.8.3 Rest of Africa OLED-on-Silicon (OLEDoS) Market Estimates and Forecasts, by Vertical (2020-2032) (USD Billion)
10.6 Latin America
10.6.1 Trends Analysis
10.6.2 Latin America OLED-on-Silicon (OLEDoS) Market Estimates and Forecasts, by Country (2020-2032) (USD Billion)
10.6.3 Latin America OLED-on-Silicon (OLEDoS) Market Estimates and Forecasts, by Product Type (2020-2032) (USD Billion)
10.6.4 Latin America OLED-on-Silicon (OLEDoS) Market Estimates and Forecasts, by Display Size (2020-2032) (USD Billion)
10.6.5 Latin America OLED-on-Silicon (OLEDoS) Market Estimates and Forecasts, by Vertical (2020-2032) (USD Billion)
10.6.6 Brazil
10.6.6.1 Brazil OLED-on-Silicon (OLEDoS) Market Estimates and Forecasts, by Product Type (2020-2032) (USD Billion)
10.6.6.2 Brazil OLED-on-Silicon (OLEDoS) Market Estimates and Forecasts, by Display Size (2020-2032) (USD Billion)
10.6.6.3 Brazil OLED-on-Silicon (OLEDoS) Market Estimates and Forecasts, by Vertical (2020-2032) (USD Billion)
10.6.7 Argentina
10.6.7.1 Argentina OLED-on-Silicon (OLEDoS) Market Estimates and Forecasts, by Product Type (2020-2032) (USD Billion)
10.6.7.2 Argentina OLED-on-Silicon (OLEDoS) Market Estimates and Forecasts, by Display Size (2020-2032) (USD Billion)
10.6.7.3 Argentina OLED-on-Silicon (OLEDoS) Market Estimates and Forecasts, by Vertical (2020-2032) (USD Billion)
10.6.8 Colombia
10.6.8.1 Colombia OLED-on-Silicon (OLEDoS) Market Estimates and Forecasts, by Product Type (2020-2032) (USD Billion)
10.6.8.2 Colombia OLED-on-Silicon (OLEDoS) Market Estimates and Forecasts, by Display Size (2020-2032) (USD Billion)
10.6.8.3 Colombia OLED-on-Silicon (OLEDoS) Market Estimates and Forecasts, by Vertical (2020-2032) (USD Billion)
10.6.9 Rest of Latin America
10.6.9.1 Rest of Latin America OLED-on-Silicon (OLEDoS) Market Estimates and Forecasts, by Product Type (2020-2032) (USD Billion)
10.6.9.2 Rest of Latin America OLED-on-Silicon (OLEDoS) Market Estimates and Forecasts, by Display Size (2020-2032) (USD Billion)
10.6.9.3 Rest of Latin America OLED-on-Silicon (OLEDoS) Market Estimates and Forecasts, by Vertical (2020-2032) (USD Billion)
11. Company Profiles
11.1 Sony
11.1.1 Company Overview
11.1.2 Financial
11.1.3 Product Types/ Services Offered
11.1.4 SWOT Analysis
11.2 eMagin
11.2.1 Company Overview
11.2.2 Financial
11.2.3 Product Types/ Services Offered
11.2.4 SWOT Analysis
11.3 Kopin
11.3.1 Company Overview
11.3.2 Financial
11.3.3 Product Types/ Services Offered
11.3.4 SWOT Analysis
11.4 LG Display
11.4.1 Company Overview
11.4.2 Financial
11.4.3 Product Types/ Services Offered
11.4.4 SWOT Analysis
11.5 MicroOLED
11.5.1 Company Overview
11.5.2 Financial
11.5.3 Product Types/ Services Offered
11.5.4 SWOT Analysis
11.6 Himax Technologies
11.6.1 Company Overview
11.6.2 Financial
11.6.3 Product Types/ Services Offered
11.6.4 SWOT Analysis
11.7 Fraunhofer FEP
11.7.1 Company Overview
11.7.2 Financial
11.7.3 Product Types/ Services Offered
11.7.4 SWOT Analysis
11.8 BOE Technology Group
11.8.1 Company Overview
11.8.2 Financial
11.8.3 Product Types/ Services Offered
11.8.4 SWOT Analysis
11.9 Panasonic
11.9.1 Company Overview
11.9.2 Financial
11.9.3 Product Types/ Services Offered
11.9.4 SWOT Analysis
11.10 Jasper Display
11.10.1 Company Overview
11.10.2 Financial
11.10.3 Product Types/ Services Offered
11.10.4 SWOT Analysis
12. Use Cases and Best Practices
13. Conclusion
An accurate research report requires proper strategizing as well as implementation. There are multiple factors involved in the completion of good and accurate research report and selecting the best methodology to compete the research is the toughest part. Since the research reports we provide play a crucial role in any company’s decision-making process, therefore we at SNS Insider always believe that we should choose the best method which gives us results closer to reality. This allows us to reach at a stage wherein we can provide our clients best and accurate investment to output ratio.
Each report that we prepare takes a timeframe of 350-400 business hours for production. Starting from the selection of titles through a couple of in-depth brain storming session to the final QC process before uploading our titles on our website we dedicate around 350 working hours. The titles are selected based on their current market cap and the foreseen CAGR and growth.
The 5 steps process:
Step 1: Secondary Research:
Secondary Research or Desk Research is as the name suggests is a research process wherein, we collect data through the readily available information. In this process we use various paid and unpaid databases which our team has access to and gather data through the same. This includes examining of listed companies’ annual reports, Journals, SEC filling etc. Apart from this our team has access to various associations across the globe across different industries. Lastly, we have exchange relationships with various university as well as individual libraries.

Step 2: Primary Research
When we talk about primary research, it is a type of study in which the researchers collect relevant data samples directly, rather than relying on previously collected data. This type of research is focused on gaining content specific facts that can be sued to solve specific problems. Since the collected data is fresh and first hand therefore it makes the study more accurate and genuine.
We at SNS Insider have divided Primary Research into 2 parts.
Part 1 wherein we interview the KOLs of major players as well as the upcoming ones across various geographic regions. This allows us to have their view over the market scenario and acts as an important tool to come closer to the accurate market numbers. As many as 45 paid and unpaid primary interviews are taken from both the demand and supply side of the industry to make sure we land at an accurate judgement and analysis of the market.
This step involves the triangulation of data wherein our team analyses the interview transcripts, online survey responses and observation of on filed participants. The below mentioned chart should give a better understanding of the part 1 of the primary interview.

Part 2: In this part of primary research the data collected via secondary research and the part 1 of the primary research is validated with the interviews from individual consultants and subject matter experts.
Consultants are those set of people who have at least 12 years of experience and expertise within the industry whereas Subject Matter Experts are those with at least 15 years of experience behind their back within the same space. The data with the help of two main processes i.e., FGDs (Focused Group Discussions) and IDs (Individual Discussions). This gives us a 3rd party nonbiased primary view of the market scenario making it a more dependable one while collation of the data pointers.
Step 3: Data Bank Validation
Once all the information is collected via primary and secondary sources, we run that information for data validation. At our intelligence centre our research heads track a lot of information related to the market which includes the quarterly reports, the daily stock prices, and other relevant information. Our data bank server gets updated every fortnight and that is how the information which we collected using our primary and secondary information is revalidated in real time.

Step 4: QA/QC Process
After all the data collection and validation our team does a final level of quality check and quality assurance to get rid of any unwanted or undesired mistakes. This might include but not limited to getting rid of the any typos, duplication of numbers or missing of any important information. The people involved in this process include technical content writers, research heads and graphics people. Once this process is completed the title gets uploader on our platform for our clients to read it.
Step 5: Final QC/QA Process:
This is the last process and comes when the client has ordered the study. In this process a final QA/QC is done before the study is emailed to the client. Since we believe in giving our clients a good experience of our research studies, therefore, to make sure that we do not lack at our end in any way humanly possible we do a final round of quality check and then dispatch the study to the client.
By Product Type
Near-Eye Display
Head-Mounted Display
Electronic Viewfinder
Head-up Display
Other Product Type
By Display Size
More than 1”
Less than 1”
By Vertical
Consumer
Aerospace & Defense
Industrial & Enterprise
Others
Request for Segment Customization as per your Business Requirement: Segment Customization Request
REGIONAL COVERAGE:
North America
US
Canada
Mexico
Europe
Eastern Europe
Poland
Romania
Hungary
Turkey
Rest of Eastern Europe
Western Europe
Germany
France
UK
Italy
Spain
Netherlands
Switzerland
Austria
Rest of Western Europe
Asia Pacific
China
India
Japan
South Korea
Vietnam
Singapore
Australia
Rest of Asia Pacific
Middle East & Africa
Middle East
UAE
Egypt
Saudi Arabia
Qatar
Rest of the Middle East
Africa
Nigeria
South Africa
Rest of Africa
Latin America
Brazil
Argentina
Colombia
Request for Country Level Research Report: Country Level Customization Request
Available Customization
With the given market data, SNS Insider offers customization as per the company’s specific needs. The following customization options are available for the report:
Product Analysis
Criss-Cross segment analysis (e.g. Product X Application)
Product Matrix which gives a detailed comparison of the product portfolio of each company
Geographic Analysis
Additional countries in any of the regions
Company Information
Detailed analysis and profiling of additional market players (Up to five)
The Computerized Maintenance Management System Market was valued at USD 1.48 billion in 2023 and is expected to grow at a CAGR of 10.81% During 2024-2032.
The Digital Key Cabinet Market Size was USD 148 Million in 2023 & is now anticipated to grow USD 275.26 Million by 2032, with a CAGR of 7.15% by 2024-2032.
The Artificial Intelligence Robots Market Size was valued at USD 8.77 Billion in 2023 and is expected to grow at 29.46% CAGR to reach USD 89.57 Billion by 2032
The Semiconductor Lead Frame Market Size was valued at USD 3.80 Billion in 2023 and is expected to grow at 6.12% CAGR to reach USD 6.47 Billion by 2032.
The IP Camera Market was valued at USD 1.42 Billion in 2023 and is expected to reach USD 2.49 Billion by 2032 and grow at a CAGR of 6.51% over the forecast period 2024-2032.
The Micro-Location Technology Market was valued at USD 18.29 Billion in 2023 and is expected to grow at a CAGR of 15.42% to reach USD 66.31 Billion by 2032

Hi! Click one of our member below to chat on Phone
© 2025 All Rights Reserved by SNS Insider Pvt Ltd


