image

Oilfield Equipment Market Report Scope & Overview:

Oilfield Equipment Market Revenue Analysis

To get more information on KEYWORD Market - Request Free Sample Report

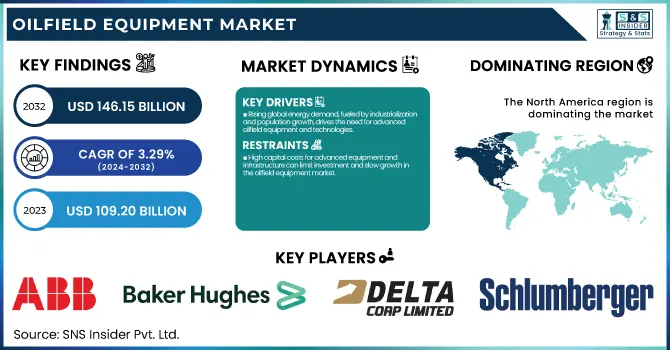
The Oilfield Equipment Market Size was esteemed at USD 109.20 billion in 2023 and is supposed to arrive at USD 146.15 billion by 2032 with a growing CAGR of 3.29% over the forecast period 2024-2032. This report offers unique insights into the oilfield equipment market by analysing production output, rig utilization rates, and maintenance metrics. It delves into the adoption of new technologies by region, reflecting how innovations are influencing operational efficiency. Export and import data is also covered, offering a snapshot of global trade patterns. Additionally, the report highlights downtime metrics, providing a clear picture of how maintenance strategies impact overall equipment performance. These insights help stakeholders understand the evolving trends and challenges in the oilfield equipment sector.

MARKET DYNAMICS

DRIVERS

  • Rising global energy demand, fueled by industrialization and population growth, drives the need for advanced oilfield equipment and technologies.

The increasing global energy demand is a key driver of the oilfield equipment market, fueled by rapid industrialization, urbanization, and population growth. As economies expand, the need for oil and gas as primary energy sources continues to rise, driving exploration and production (E&P) activities. With the development of economies, there remains an increasing demand for oil and gas as primary energy sources which drives both exploration and production (E&P) activities. The increase in demand spurs investments in advanced drilling methods such as automation and enhanced oil recovery (EOR) techniques for improved extraction efficiency. The growth of deepwater and ultra-deepwater exploration, particularly in the Gulf of Mexico, the North Sea, and offshore Africa, is also increasing the demand for specialized oilfield equipment. Data-driven digital oilfield solutions, AI-based predictive maintenance, and IoT-enabled monitoring systems are changing the way they operate to boost productivity, reduce downtime, and enhance performance. The move towards renewable energy is a long-term challenge but oil remains the great powerhouse of an energy source to this day, meaning that oilfield equipment that is creative, innovative, and effective in design and processing must be in demand for augmentation for the known future.

RESTRAINT

  • High capital costs for advanced equipment and infrastructure can limit investment and slow growth in the oilfield equipment market.

High capital costs are a significant restraint in the oilfield equipment market, as the investment required for advanced machinery, infrastructure, and technology is substantial.  Drilling rigs, production platforms, and specialized equipment, potentially restrict market entry for smaller companies and prevent growth for existing players. Furthermore, there are expenses related to maintaining and upgrading equipment to industry-standard specifications. With oil and gas discovery works being increasingly more complex, specifically deepwater and unconventional fields, the demand for state-of-the-art equipment increases and so do the costs. The level of capital expenditure (capex) that these projects will require can dissuade development, particularly in times of volatile oil prices. When oil prices go down, it could take longer to see a return, providing less incentive to invest and take the market further. That is why high capital costs constitute a vital hurdle for oilfield equipment companies.

OPPORTUNITIES

  • Emerging markets like India, China, and Brazil offer significant growth opportunities for the oilfield equipment market due to rising energy demand and untapped reserves.

Emerging markets such as India, China, and Brazil represent significant growth opportunities for the oilfield equipment market. These nations are also experiencing rapid industrialization, urbanization, and increasing energy demand and the drive to explore and produce oil and gas reserves. Advanced oilfield equipment demand is highly driven by India's rising energy consumption and India's government support initiatives to increase domestic production. Likewise, China’s energy needs and its continued investment in deepwater and unconventional oil exploration also enlarge the marketplace. Brazil, which has some of the most lucrative offshore oilfields in the world especially those in the pre-salt layer represents South America’s second-largest oilfield equipment market. These countries also possess large untapped reserves, and as investments grow in exploration and production technologies, the need for state-of-the-art oilfield equipment is predicted to increase substantially in these regions. The growing markets provide a significant opportunity for global oil field equipment suppliers, enabling them to gain a sizable share of the domain.

CHALLENGES

  • Workforce shortages and the skills gap in oilfield operations hinder efficiency, increase costs, and limit the adoption of advanced technologies.

Workforce shortages and the skills gap are significant challenges facing the oilfield equipment market. As the oil and gas exploration process increases in complexity, the industry has experienced a sharp rise in demand for highly skilled workers in specialized areas like drilling, maintenance, and equipment operation. Yet many areas experience a lack of skilled labor, often due to an aging workforce, absence of technical training opportunities, and competitors luring workers away to other sectors. The lack of skilled workers results in high labor costs, delays in projects, and lesser operational efficiency. The time and money it take to train new employees only compounds the problem. In reality, this long-standing skills gap inhibits the transition to next-gen technologies since expertise in automation, digitalization, and data analytics is still limited and expertise is critical to maximizing investment in new oilfield equipment. To tackle these challenges and ensure the sustainability of the market in the long run it will be imperative for companies to work around workforce development, skill-based training programs, and recruitment modules.

SEGMENTATION ANALYSIS

By Type

The Production Equipment segment dominated with a market share of over 44% in 2023, as it involves the necessary tools and machinery used in the extraction and processing of oil and gas. The other important aspects of production operations include wellheads, pumps, valves, and separators. These types of devices are essential components of flow control oil and gas for well parameters and also keep pressure and separate various impurities with crude oil or gas. With oil and gas production still on the rise in old and new fields alike, the need for efficient and high-performance production equipment is still there. Given the continuous demands from mature and new oil fields, the production equipment segment holds the highest market share.

By Application

The onshore applications segment dominated with a market share of over 62% in 2023, owing to the large number of onshore oil and gas reserves globally. The onshore fields are less expensive to discover and create than their offshore counterparts and represent more than half of worldwide results. That includes increased demand for oilfield machinery like drilling rigs, pumps, and safety mechanisms in onshore operations. Many of the existing oil and gas companies are already working onshore, which creates steady demand for maintenance and repairs, including upgrades and new equipment. For exploration and production activities, maritime drilling is considered less favourable than onshore projects which combined with being more economical, given logistical challenges are much lower than offshore thrive in such conditions. This leads to the onshore segment capturing the highest market share in the global oilfield equipment market.

Oilfield Equipment Market Segmentation Analysis

Need any customization research on KEYWORD Market - Enquiry Now

KEY REGIONAL ANALYSIS

North America region dominated with a market share of over 40% in 2023, attributed to widespread oil and gas exploration operations, especially in the U.S. and Canada. With considerable investment in both technology and infrastructure, these nations have risen to become world leaders in oil production. There is a strong demand for advanced oilfield equipment due to several factors, including the development of unconventional resources such as shale gas and the increasing requirement for Offshore drilling solutions. Moreover, it has a developed supply chain, skilled labor force, and technologically advanced drilling solutions that enable efficient extraction and production processes. This allows North America to maintain its market leader position in the global oilfield equipment demand.

The Asia-Pacific region is experiencing rapid growth in the oilfield equipment market, primarily driven by surging oil and gas exploration activities in key countries like China, India, and Australia. As these countries keep growing their energy industries to satisfy the demand for oil and gas, advanced oilfield equipment becomes more pressing. China and India (in particular) are investing in onshore and offshore oil, and Australia is betting on gas extraction. The increasing demand for energy and notable investments in energy infrastructure have driven the need for advanced equipment which is expected to offer lucrative opportunities for the oilfield equipment market in the Asia Pacific region.

Some of the major key players in the Oilfield Equipment Market

  • ABB (Drilling Control Systems, Power Solutions)

  • Baker Hughes (Drilling Equipment, Well Completion Tools)

  • Delta Corporation (Pressure Control Equipment, Wellhead Solutions)

  • EthosEnergy Group Limited (Turbomachinery, Rotating Equipment)

  • Integrated Equipment (Blowout Preventers, Valves, Wellhead Equipment)

  • Jereh Oilfield Equipment (Fracturing Units, Cementing Equipment)

  • MSP/Drilex, Inc. (Mud Pumps, Drill String Components)

  • Sunnda Corporation (Wellhead Equipment, Flow Control Products)

  • Uztel S.A (Well Control Equipment, Valves)

  • Weir Group (Pumps, Pressure Control Equipment)

  • Halliburton (Drilling Tools, Production Equipment)

  • SLB (Schlumberger) (Well Services, Logging Equipment)

  • National Oilwell Varco (NOV) (Drilling Rigs, Pipe Handling Equipment)

  • Weatherford International (Artificial Lift Systems, Well Construction)

  • Cameron (a Schlumberger company) (Blowout Preventers, Wellheads)

  • TechnipFMC (Subsea Production Systems, Drilling Systems)

  • Aker Solutions (Subsea Equipment, Flow Assurance Solutions)

  • Dril-Quip, Inc. (Wellheads, Subsea Equipment)

  • Expro Group (Well Flow Management, Wireline Services)

  • Tenaris (OCTG Pipes, Premium Connections)

Suppliers for (oilfield equipment, digital solutions, and energy transition technologies) in Oilfield Equipment Market

  • Schlumberger Limited (SLB)

  • Halliburton

  • Baker Hughes Company

  • Weatherford International

  • National Oilwell Varco (NOV)

  • TechnipFMC plc

  • Aker Solutions

  • Cameron International (a Schlumberger company)

  • Helmerich & Payne

  • Sinopec Oilfield Equipment Corporation

Baker Hughes-Company Financial Analysis


RECENT DEVELOPMENT

In January 2024: Schlumberger (SLB) and Nabors Industries announced a partnership aimed at accelerating the adoption of automated drilling solutions. This collaboration seeks to integrate SLB’s drilling automation technologies with Nabors’ rig operating systems, providing oil and gas operators and drilling contractors with improved well construction performance and operational efficiency.

In April 2024: SLB also reached an agreement to acquire ChampionX, a Texas-based company specializing in pumps and pumping equipment. The acquisition is intended to strengthen SLB’s position in the production sector by combining ChampionX's expertise in production chemicals and artificial lift technologies with SLB's global reach and advanced technological capabilities.

Oilfield Equipment Market Report Scope:

Report Attributes Details
Market Size in 2023 USD 109.20 Billion
Market Size by 2032 USD 146.15 Billion
CAGR CAGR of 3.29%  From 2024 to 2032
Base Year 2023
Forecast Period 2024-2032
Historical Data 2020-2022
Report Scope & Coverage Market Size, Segments Analysis, Competitive  Landscape, Regional Analysis, DROC & SWOT Analysis, Forecast Outlook
Key Segments • By Type (Drilling Equipment, Production Equipment, Other Equipment Types)
• By Application (Onshore, Offshore)
Regional Analysis/Coverage North America (US, Canada, Mexico), Europe (Eastern Europe [Poland, Romania, Hungary, Turkey, Rest of Eastern Europe] Western Europe] Germany, France, UK, Italy, Spain, Netherlands, Switzerland, Austria, Rest of Western Europe]), Asia Pacific (China, India, Japan, South Korea, Vietnam, Singapore, Australia, Rest of Asia Pacific), Middle East & Africa (Middle East [UAE, Egypt, Saudi Arabia, Qatar, Rest of Middle East], Africa [Nigeria, South Africa, Rest of Africa], Latin America (Brazil, Argentina, Colombia, Rest of Latin America)
Company Profiles ABB, Baker Hughes, Delta Corporation, EthosEnergy Group Limited, Integrated Equipment, Jereh Oilfield Equipment, MSP/Drilex, Inc., Sunnda Corporation, Uztel S.A, Weir Group, Halliburton, SLB (Schlumberger), National Oilwell Varco (NOV), Weatherford International, Cameron (a Schlumberger company), TechnipFMC, Aker Solutions, Dril-Quip, Inc., Expro Group, Tenaris

Frequently Asked Questions

Ans:  The Oilfield Equipment Market is expected to grow at a CAGR of 3.29% during 2024-2032.

 Ans: The Oilfield Equipment Market was USD 109.20 billion in 2023 and is expected to Reach USD 146.15 billion by 2032.

Ans: Rising global energy demand, fueled by industrialization and population growth, drives the need for advanced oilfield equipment and technologies.

Ans: The “Production Equipment” segment dominated the Oilfield Equipment Market.

Ans: North America dominated the Oilfield Equipment Market in 2023

Table of Content

1. Introduction

1.1 Market Definition

1.2 Scope (Inclusion and Exclusions)

1.3 Research Assumptions

2. Executive Summary

2.1 Market Overview

2.2 Regional Synopsis

2.3 Competitive Summary

3. Research Methodology

3.1 Top-Down Approach

3.2 Bottom-up Approach

3.3. Data Validation

3.4 Primary Interviews

4. Market Dynamics Impact Analysis

4.1 Market Driving Factors Analysis

4.1.2 Drivers

4.1.2 Restraints

4.1.3 Opportunities

4.1.4 Challenges

4.2 PESTLE Analysis

4.3 Porter’s Five Forces Model

5. Statistical Insights and Trends Reporting

5.1 Oilfield Equipment Production Output, by Region (2020-2023)

5.2 Rig Utilization Rates, by Region (2020-2023)

5.3 Maintenance and Downtime Metrics for Oilfield Equipment

5.4 Technological Adoption in Oilfield Equipment, by Region

5.5 Export/Import Data for Oilfield Equipment, by Region (2023)

6. Competitive Landscape

6.1 List of Major Companies, By Region

6.2 Market Share Analysis, By Region

6.3 Product Benchmarking

6.3.1 Product specifications and features

6.3.2 Pricing

6.4 Strategic Initiatives

6.4.1 Marketing and promotional activities

6.4.2 Distribution and Supply Chain Strategies

6.4.3 Expansion plans and new product launches

6.4.4 Strategic partnerships and collaborations

6.5 Technological Advancements

6.6 Market Positioning and Branding

7. Oilfield Equipment Market Segmentation, By Type

7.1 Chapter Overview

7.2 Drilling Equipment

7.2.1 Drilling Equipment Market Trends Analysis (2020-2032)

7.2.2 Drilling Equipment Market Size Estimates and Forecasts to 2032 (USD Billion)

7.3 Production Equipment

7.3.1 Production Equipment Market Trends Analysis (2020-2032)

7.3.2 Production Equipment Market Size Estimates and Forecasts to 2032 (USD Billion)

7.4 Other Equipment Types

7.4.1 Other Equipment Types Market Trends Analysis (2020-2032)

7.4.2 Other Equipment Types Market Size Estimates and Forecasts to 2032 (USD Billion)

8. Oilfield Equipment Market Segmentation, By Application

8.1 Chapter Overview

8.2 Onshore

             8.2.1 Onshore Market Trends Analysis (2020-2032)

8.2.2 Onshore Market Size Estimates and Forecasts to 2032 (USD Billion)

8.3 Offshore

8.3.1 Offshore Market Trends Analysis (2020-2032)

8.3.2 Offshore Market Size Estimates and Forecasts to 2032 (USD Billion)

9. Regional Analysis

9.1 Chapter Overview

9.2 North America

9.2.1 Trends Analysis

9.2.2 North America Oilfield Equipment Market Estimates and Forecasts, by Country (2020-2032) (USD Billion)

9.2.3 North America Oilfield Equipment Market Estimates and Forecasts, By Type (2020-2032) (USD Billion) 

9.2.4 North America Oilfield Equipment Market Estimates and Forecasts, By Application (2020-2032) (USD Billion)

9.2.5 USA

9.2.5.1 USA Oilfield Equipment Market Estimates and Forecasts, By Type (2020-2032) (USD Billion)

9.2.5.2 USA Oilfield Equipment Market Estimates and Forecasts, By Application (2020-2032) (USD Billion)

9.2.6 Canada

9.2.6.1 Canada Oilfield Equipment Market Estimates and Forecasts, By Type (2020-2032) (USD Billion)

9.2.6.2 Canada Oilfield Equipment Market Estimates and Forecasts, By Application (2020-2032) (USD Billion)

9.2.7 Mexico

9.2.7.1 Mexico Oilfield Equipment Market Estimates and Forecasts, By Type (2020-2032) (USD Billion)

9.2.7.2 Mexico Oilfield Equipment Market Estimates and Forecasts, By Application (2020-2032) (USD Billion)

9.3 Europe

9.3.1 Eastern Europe

9.3.1.1 Trends Analysis

9.3.1.2 Eastern Europe Oilfield Equipment Market Estimates and Forecasts, by Country (2020-2032) (USD Billion)

9.3.1.3 Eastern Europe Oilfield Equipment Market Estimates and Forecasts, By Type (2020-2032) (USD Billion) 

9.3.1.4 Eastern Europe Oilfield Equipment Market Estimates and Forecasts, By Application (2020-2032) (USD Billion)

9.3.1.5 Poland

9.3.1.5.1 Poland Oilfield Equipment Market Estimates and Forecasts, By Type (2020-2032) (USD Billion)

9.3.1.5.2 Poland Oilfield Equipment Market Estimates and Forecasts, By Application (2020-2032) (USD Billion)

9.3.1.6 Romania

9.3.1.6.1 Romania Oilfield Equipment Market Estimates and Forecasts, By Type (2020-2032) (USD Billion)

9.3.1.6.2 Romania Oilfield Equipment Market Estimates and Forecasts, By Application (2020-2032) (USD Billion)

9.3.1.7 Hungary

9.3.1.7.1 Hungary Oilfield Equipment Market Estimates and Forecasts, By Type (2020-2032) (USD Billion)

9.3.1.7.2 Hungary Oilfield Equipment Market Estimates and Forecasts, By Application (2020-2032) (USD Billion)

9.3.1.8 turkey

9.3.1.8.1 Turkey Oilfield Equipment Market Estimates and Forecasts, By Type (2020-2032) (USD Billion)

9.3.1.8.2 Turkey Oilfield Equipment Market Estimates and Forecasts, By Application (2020-2032) (USD Billion)

9.3.1.9 Rest of Eastern Europe

9.3.1.9.1 Rest of Eastern Europe Oilfield Equipment Market Estimates and Forecasts, By Type (2020-2032) (USD Billion)

9.3.1.9.2 Rest of Eastern Europe Oilfield Equipment Market Estimates and Forecasts, By Application (2020-2032) (USD Billion)

9.3.2 Western Europe

9.3.2.1 Trends Analysis

9.3.2.2 Western Europe Oilfield Equipment Market Estimates and Forecasts, by Country (2020-2032) (USD Billion)

9.3.2.3 Western Europe Oilfield Equipment Market Estimates and Forecasts, By Type (2020-2032) (USD Billion) 

9.3.2.4 Western Europe Oilfield Equipment Market Estimates and Forecasts, By Application (2020-2032) (USD Billion)

9.3.2.5 Germany

9.3.2.5.1 Germany Oilfield Equipment Market Estimates and Forecasts, By Type (2020-2032) (USD Billion)

9.3.2.5.2 Germany Oilfield Equipment Market Estimates and Forecasts, By Application (2020-2032) (USD Billion)

9.3.2.6 France

9.3.2.6.1 France Oilfield Equipment Market Estimates and Forecasts, By Type (2020-2032) (USD Billion)

9.3.2.6.2 France Oilfield Equipment Market Estimates and Forecasts, By Application (2020-2032) (USD Billion)

9.3.2.7 UK

9.3.2.7.1 UK Oilfield Equipment Market Estimates and Forecasts, By Type (2020-2032) (USD Billion)

9.3.2.7.2 UK Oilfield Equipment Market Estimates and Forecasts, By Application (2020-2032) (USD Billion)

9.3.2.8 Italy

9.3.2.8.1 Italy Oilfield Equipment Market Estimates and Forecasts, By Type (2020-2032) (USD Billion)

9.3.2.8.2 Italy Oilfield Equipment Market Estimates and Forecasts, By Application (2020-2032) (USD Billion)

9.3.2.9 Spain

9.3.2.9.1 Spain Oilfield Equipment Market Estimates and Forecasts, By Type (2020-2032) (USD Billion)

9.3.2.9.2 Spain Oilfield Equipment Market Estimates and Forecasts, By Application (2020-2032) (USD Billion)

9.3.2.10 Netherlands

9.3.2.10.1 Netherlands Oilfield Equipment Market Estimates and Forecasts, By Type (2020-2032) (USD Billion)

9.3.2.10.2 Netherlands Oilfield Equipment Market Estimates and Forecasts, By Application (2020-2032) (USD Billion)

9.3.2.11 Switzerland

9.3.2.11.1 Switzerland Oilfield Equipment Market Estimates and Forecasts, By Type (2020-2032) (USD Billion)

9.3.2.11.2 Switzerland Oilfield Equipment Market Estimates and Forecasts, By Application (2020-2032) (USD Billion)

9.3.2.12 Austria

9.3.2.12.1 Austria Oilfield Equipment Market Estimates and Forecasts, By Type (2020-2032) (USD Billion)

9.3.2.12.2 Austria Oilfield Equipment Market Estimates and Forecasts, By Application (2020-2032) (USD Billion)

9.3.2.13 Rest of Western Europe

9.3.2.13.1 Rest of Western Europe Oilfield Equipment Market Estimates and Forecasts, By Type (2020-2032) (USD Billion)

9.3.2.13.2 Rest of Western Europe Oilfield Equipment Market Estimates and Forecasts, By Application (2020-2032) (USD Billion)

9.4 Asia-Pacific

9.4.1 Trends Analysis

9.4.2 Asia-Pacific Oilfield Equipment Market Estimates and Forecasts, by Country (2020-2032) (USD Billion)

9.4.3 Asia-Pacific Oilfield Equipment Market Estimates and Forecasts, By Type (2020-2032) (USD Billion) 

9.4.4 Asia-Pacific Oilfield Equipment Market Estimates and Forecasts, By Application (2020-2032) (USD Billion)

9.4.5 China

9.4.5.1 China Oilfield Equipment Market Estimates and Forecasts, By Type (2020-2032) (USD Billion)

9.4.5.2 China Oilfield Equipment Market Estimates and Forecasts, By Application (2020-2032) (USD Billion)

9.4.6 India

9.4.5.1 India Oilfield Equipment Market Estimates and Forecasts, By Type (2020-2032) (USD Billion)

9.4.5.2 India Oilfield Equipment Market Estimates and Forecasts, By Application (2020-2032) (USD Billion)

9.4.5 japan

9.4.5.1 Japan Oilfield Equipment Market Estimates and Forecasts, By Type (2020-2032) (USD Billion)

9.4.5.2 Japan Oilfield Equipment Market Estimates and Forecasts, By Application (2020-2032) (USD Billion)

9.4.6 South Korea

9.4.6.1 South Korea Oilfield Equipment Market Estimates and Forecasts, By Type (2020-2032) (USD Billion)

9.4.6.2 South Korea Oilfield Equipment Market Estimates and Forecasts, By Application (2020-2032) (USD Billion)

9.4.7 Vietnam

9.4.7.1 Vietnam Oilfield Equipment Market Estimates and Forecasts, By Type (2020-2032) (USD Billion)

9.2.7.2 Vietnam Oilfield Equipment Market Estimates and Forecasts, By Application (2020-2032) (USD Billion)

9.4.8 Singapore

9.4.8.1 Singapore Oilfield Equipment Market Estimates and Forecasts, By Type (2020-2032) (USD Billion)

9.4.8.2 Singapore Oilfield Equipment Market Estimates and Forecasts, By Application (2020-2032) (USD Billion)

9.4.9 Australia

9.4.9.1 Australia Oilfield Equipment Market Estimates and Forecasts, By Type (2020-2032) (USD Billion)

9.4.9.2 Australia Oilfield Equipment Market Estimates and Forecasts, By Application (2020-2032) (USD Billion)

9.4.10 Rest of Asia-Pacific

9.4.10.1 Rest of Asia-Pacific Oilfield Equipment Market Estimates and Forecasts, By Type (2020-2032) (USD Billion)

9.4.10.2 Rest of Asia-Pacific Oilfield Equipment Market Estimates and Forecasts, By Application (2020-2032) (USD Billion)

9.5 Middle East and Africa

9.5.1 Middle East

9.5.1.1 Trends Analysis

9.5.1.2 Middle East Oilfield Equipment Market Estimates and Forecasts, by Country (2020-2032) (USD Billion)

9.5.1.3 Middle East Oilfield Equipment Market Estimates and Forecasts, By Type (2020-2032) (USD Billion) 

9.5.1.4 Middle East Oilfield Equipment Market Estimates and Forecasts, By Application (2020-2032) (USD Billion)

9.5.1.5 UAE

9.5.1.5.1 UAE Oilfield Equipment Market Estimates and Forecasts, By Type (2020-2032) (USD Billion)

9.5.1.5.2 UAE Oilfield Equipment Market Estimates and Forecasts, By Application (2020-2032) (USD Billion)

9.5.1.6 Egypt

9.5.1.6.1 Egypt Oilfield Equipment Market Estimates and Forecasts, By Type (2020-2032) (USD Billion)

9.5.1.6.2 Egypt Oilfield Equipment Market Estimates and Forecasts, By Application (2020-2032) (USD Billion)

9.5.1.7 Saudi Arabia

9.5.1.7.1 Saudi Arabia Oilfield Equipment Market Estimates and Forecasts, By Type (2020-2032) (USD Billion)

9.5.1.7.2 Saudi Arabia Oilfield Equipment Market Estimates and Forecasts, By Application (2020-2032) (USD Billion)

9.5.1.8 Qatar

9.5.1.8.1 Qatar Oilfield Equipment Market Estimates and Forecasts, By Type (2020-2032) (USD Billion)

9.5.1.8.2 Qatar Oilfield Equipment Market Estimates and Forecasts, By Application (2020-2032) (USD Billion)

9.5.1.9 Rest of Middle East

9.5.1.9.1 Rest of Middle East Oilfield Equipment Market Estimates and Forecasts, By Type (2020-2032) (USD Billion)

9.5.1.9.2 Rest of Middle East Oilfield Equipment Market Estimates and Forecasts, By Application (2020-2032) (USD Billion)

9.5.2 Africa

9.5.2.1 Trends Analysis

9.5.2.2 Africa Oilfield Equipment Market Estimates and Forecasts, by Country (2020-2032) (USD Billion)

9.5.2.3 Africa Oilfield Equipment Market Estimates and Forecasts, By Type (2020-2032) (USD Billion) 

9.5.2.4 Africa Oilfield Equipment Market Estimates and Forecasts, By Application (2020-2032) (USD Billion)

9.5.2.5 South Africa

9.5.2.5.1 South Africa Oilfield Equipment Market Estimates and Forecasts, By Type (2020-2032) (USD Billion)

9.5.2.5.2 South Africa Oilfield Equipment Market Estimates and Forecasts, By Application (2020-2032) (USD Billion)

9.5.2.6 Nigeria

9.5.2.6.1 Nigeria Oilfield Equipment Market Estimates and Forecasts, By Type (2020-2032) (USD Billion)

9.5.2.6.2 Nigeria Oilfield Equipment Market Estimates and Forecasts, By Application (2020-2032) (USD Billion)

9.6 Latin America

9.6.1 Trends Analysis

9.6.2 Latin America Oilfield Equipment Market Estimates and Forecasts, by Country (2020-2032) (USD Billion)

9.6.3 Latin America Oilfield Equipment Market Estimates and Forecasts, By Type (2020-2032) (USD Billion) 

9.6.4 Latin America Oilfield Equipment Market Estimates and Forecasts, By Application (2020-2032) (USD Billion)

9.6.5 Brazil

9.6.5.1 Brazil Oilfield Equipment Market Estimates and Forecasts, By Type (2020-2032) (USD Billion)

9.6.5.2 Brazil Oilfield Equipment Market Estimates and Forecasts, By Application (2020-2032) (USD Billion)

9.6.6 Argentina

9.6.6.1 Argentina Oilfield Equipment Market Estimates and Forecasts, By Type (2020-2032) (USD Billion)

9.6.6.2 Argentina Oilfield Equipment Market Estimates and Forecasts, By Application (2020-2032) (USD Billion)

9.6.7 Colombia

9.6.7.1 Colombia Oilfield Equipment Market Estimates and Forecasts, By Type (2020-2032) (USD Billion)

9.6.7.2 Colombia Oilfield Equipment Market Estimates and Forecasts, By Application (2020-2032) (USD Billion)

9.6.8 Rest of Latin America

9.6.8.1 Rest of Latin America Oilfield Equipment Market Estimates and Forecasts, By Type (2020-2032) (USD Billion)

9.6.8.2 Rest of Latin America Oilfield Equipment Market Estimates and Forecasts, By Application (2020-2032) (USD Billion)

11. Company Profiles

           11.1 ABB

             11.1.1 Company Overview

11.1.2 Financial

11.1.3 Products/ Services Offered

11.1.4 SWOT Analysis

            11.2 Baker Hughes

11.2.1 Company Overview

11.2.2 Financial

11.2.3 Products/ Services Offered

11.2.4 SWOT Analysis

            11.3 Delta Corporation

11.3.1 Company Overview

11.3.2 Financial

11.3.3 Products/ Services Offered

11.3.4 SWOT Analysis

11.4 EthosEnergy Group Limited

11.4.1 Company Overview

11.4.2 Financial

11.4.3 Products/ Services Offered

11.4.4 SWOT Analysis

11.5 Integrated Equipment

11.5.1 Company Overview

11.5.2 Financial

11.5.3 Products/ Services Offered

11.5.4 SWOT Analysis

11.6 Jereh Oilfield Equipment

11.6.1 Company Overview

11.6.2 Financial

11.6.3 Products/ Services Offered

11.6.4 SWOT Analysis

11.7 MSP/Drilex, Inc.

11.7.1 Company Overview

11.7.2 Financial

11.7.3 Products/ Services Offered

11.7.4 SWOT Analysis

11.8 Sunnda Corporation

11.8.1 Company Overview

11.8.2 Financial

11.8.3 Products/ Services Offered

11.8.4 SWOT Analysis

11.9 Uztel S.A

11.9.1 Company Overview

11.9.2 Financial

11.9.3 Products/ Services Offered

11.9.4 SWOT Analysis

11.10 Weir Group

11.10.1 Company Overview

11.10.2 Financial

11.10.3 Products/ Services Offered

11.10.4 SWOT Analysis

12. Use Cases and Best Practices

13. Conclusion

An accurate research report requires proper strategizing as well as implementation. There are multiple factors involved in the completion of good and accurate research report and selecting the best methodology to compete the research is the toughest part. Since the research reports we provide play a crucial role in any company’s decision-making process, therefore we at SNS Insider always believe that we should choose the best method which gives us results closer to reality. This allows us to reach at a stage wherein we can provide our clients best and accurate investment to output ratio.

Each report that we prepare takes a timeframe of 350-400 business hours for production. Starting from the selection of titles through a couple of in-depth brain storming session to the final QC process before uploading our titles on our website we dedicate around 350 working hours. The titles are selected based on their current market cap and the foreseen CAGR and growth.


The 5 steps process:

Step 1: Secondary Research:

Secondary Research or Desk Research is as the name suggests is a research process wherein, we collect data through the readily available information. In this process we use various paid and unpaid databases which our team has access to and gather data through the same. This includes examining of listed companies’ annual reports, Journals, SEC filling etc. Apart from this our team has access to various associations across the globe across different industries. Lastly, we have exchange relationships with various university as well as individual libraries.

Secondary Research

Step 2: Primary Research

When we talk about primary research, it is a type of study in which the researchers collect relevant data samples directly, rather than relying on previously collected data.  This type of research is focused on gaining content specific facts that can be sued to solve specific problems. Since the collected data is fresh and first hand therefore it makes the study more accurate and genuine.

We at SNS Insider have divided Primary Research into 2 parts.

Part 1 wherein we interview the KOLs of major players as well as the upcoming ones across various geographic regions. This allows us to have their view over the market scenario and acts as an important tool to come closer to the accurate market numbers. As many as 45 paid and unpaid primary interviews are taken from both the demand and supply side of the industry to make sure we land at an accurate judgement and analysis of the market.

This step involves the triangulation of data wherein our team analyses the interview transcripts, online survey responses and observation of on filed participants. The below mentioned chart should give a better understanding of the part 1 of the primary interview.

Primary Research

Part 2: In this part of primary research the data collected via secondary research and the part 1 of the primary research is validated with the interviews from individual consultants and subject matter experts.

Consultants are those set of people who have at least 12 years of experience and expertise within the industry whereas Subject Matter Experts are those with at least 15 years of experience behind their back within the same space. The data with the help of two main processes i.e., FGDs (Focused Group Discussions) and IDs (Individual Discussions). This gives us a 3rd party nonbiased primary view of the market scenario making it a more dependable one while collation of the data pointers.

Step 3: Data Bank Validation

Once all the information is collected via primary and secondary sources, we run that information for data validation. At our intelligence centre our research heads track a lot of information related to the market which includes the quarterly reports, the daily stock prices, and other relevant information. Our data bank server gets updated every fortnight and that is how the information which we collected using our primary and secondary information is revalidated in real time.

Data Bank Validation

Step 4: QA/QC Process

After all the data collection and validation our team does a final level of quality check and quality assurance to get rid of any unwanted or undesired mistakes. This might include but not limited to getting rid of the any typos, duplication of numbers or missing of any important information. The people involved in this process include technical content writers, research heads and graphics people. Once this process is completed the title gets uploader on our platform for our clients to read it.

Step 5: Final QC/QA Process:

This is the last process and comes when the client has ordered the study. In this process a final QA/QC is done before the study is emailed to the client. Since we believe in giving our clients a good experience of our research studies, therefore, to make sure that we do not lack at our end in any way humanly possible we do a final round of quality check and then dispatch the study to the client.

By Type

  • Drilling Equipment

  • Production Equipment

  • Other Equipment Types

By Application

  • Onshore

  • Offshore

Request for Segment Customization as per your Business Requirement: Segment Customization Request

Regional Coverage: 

North America 

  • US 

  • Canada 

  • Mexico 

Europe 

  • Eastern Europe 

  • Poland 

  • Romania 

  • Hungary 

  • Turkey 

  • Rest of Eastern Europe 

  • Western Europe 

  • Germany 

  • France 

  • UK 

  • Italy 

  • Spain 

  • Netherlands 

  • Switzerland 

  • Austria 

  • Rest of Western Europe 

Asia Pacific 

  • China 

  • India 

  • Japan 

  • South Korea 

  • Vietnam 

  • Singapore 

  • Australia 

  • Rest of Asia Pacific 

Middle East & Africa 

  • Middle East 

  • UAE 

  • Egypt 

  • Saudi Arabia 

  • Qatar 

  • Rest of Middle East 

  • Africa 

  • Nigeria 

  • South Africa 

  • Rest of Africa 

Latin America 

  • Brazil 

  • Argentina 

  • Colombia 

  • Rest of Latin America 

Request for Country Level Research Report: Country Level Customization Request

Available Customization 

With the given market data, SNS Insider offers customization as per the company’s specific needs. The following customization options are available for the report: 

  • Detailed Volume Analysis 

  • Criss-Cross segment analysis (e.g. Product X Application) 

  • Competitive Product Benchmarking 

  • Geographic Analysis 

  • Additional countries in any of the regions 

  • Customized Data Representation 

Detailed analysis and profiling of additional market players


  •            5000 (33% Discount)


  •            8950 (40% Discount)


  •            3050 (23% Discount)

Start a Conversation

Hi! Click one of our member below to chat on Phone