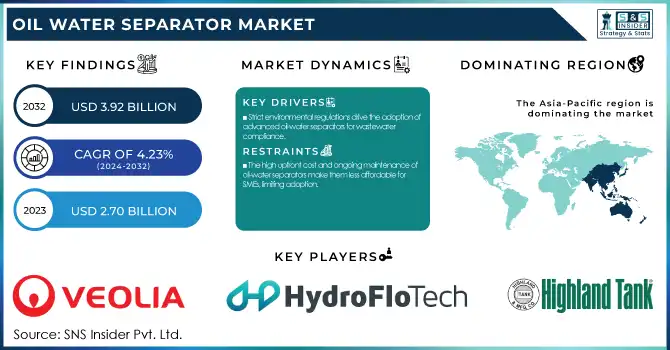
The Oil Water Separator Market Size was estimated at USD 2.70 billion in 2023 and is expected to arrive at USD 3.92 billion by 2032 with a growing CAGR of 4.23% over the forecast period 2024-2032. The Oil Water Separator Market report offers unique insights by analyzing production capacity trends across key regions, highlighting supply-side dynamics. It explores adoption rates by industry, revealing sector-wise demand shifts, while assessing installation & maintenance costs by region, addressing operational expenditures. The study also examines regulatory compliance rates, mapping evolving environmental mandates, and provides export/import data to track global trade flow. Additionally, the report covers technological advancements in automated separation systems and the impact of stricter discharge regulations, shaping future industry standards.
To Get more information on Oil Water Separator Market - Request Free Sample Report
Drivers
Stringent environmental regulations are driving the adoption of advanced oil-water separators across industries to ensure compliance with wastewater treatment and oil discharge standards.
Stringent environmental regulations are a key driver in the oil-water separator market, as governments worldwide enforce stricter wastewater treatment and oil discharge standards. Regulatory authorities like U.S. Environmental Protection Agency (EPA) and European Environment Agency (EEA) and International Maritime Organization (IMO) require industries to deploy oil-water separators in their facilities to forbid environmental pollution. These regulations affect industries such as marine, automotive and manufacturing, where oil-laden wastewater is a primary challenge. As new standards for sustainability are being established, industries are integrating improved separation technologies in the form of coalescence and membrane space systems to keep up with them. Currently the trend in the market is moving towards simply built, energy efficient designs that offer high oil removal efficiency while keeping maintenance to a minimum. Moreover, the increasing adoption of zero-liquid discharge (ZLD) policies and green manufacturing practices is further propelling market growth. As a result, this regulatory-driven growth pattern will not be reversed and will remain in place even as innovation and technology advances in oil-water separation solutions.
Restraint
The high upfront cost and ongoing maintenance of oil-water separators make them less affordable for SMEs, limiting adoption.
The high initial investment and maintenance costs associated with oil-water separators pose a significant challenge, particularly for small and medium-sized enterprises (SMEs). These initial costs involve acquiring superior separation technology, deploying, and embedding the plant within established wastewater treatment frameworks. Moreover, typical maintenance (filter replacements, cleaning, and system inspection, etc.) is also a recurring cost of operations. The cost also increases for advanced separation technologies (e.g. coalescing plate separators and membrane-based systems) due to the complex design and specialized components. These costs can be a barrier for SMEs with limited budgets, dissuading them from adopting oil-water separation solutions. Additionally, maintenance and adherence to environmental standards require money which disables small enterprises to operate on a long term basis. This causes several SMEs to resort to inefficient alternatives which then can lead to non-compliance with environmental regulations and a higher risk of oil contamination in water bodies.
Opportunities
The growing adoption of oil-water separators in food processing, mining, and power generation is driven by environmental regulations, wastewater management needs, and technological advancements.
The adoption of oil-water separators is expanding into new end-use industries, including food processing, mining, and power generation, driving significant market growth. They are widely used in the food processing industry for the treatment of wastewater containing oils, fats, and grease, allowing the facility to achieve compliance with environmental standards. The mining sector, which uses heavy machinery and consumes the most oil in its operations, depends on oil-water separators to treat wastewater and prevent natural water sources from getting contaminated. Likewise, power generation facilities and especially one with turbines and transformers generate wastewater heavily laden with oil necessitating effective separation solutions for optimal production performance and stringent discharge standards. With many industries now focusing more on environmental sustainability and regulatory compliance, the need for advanced oil-water separation technologies continues to grow. Beside membrane-based and coalescing separators they have different examples of new improving techniques for such process to increase efficiency and make them more attractive for wide range of applications. The spread of the trend opened profitable avenues for the manufacturing process to evolve and be brought on multiple sectors.
Challenges
Oil-water separators struggle with high oil concentrations and emulsified oils, requiring advanced technologies for effective separation and increased maintenance.
Oil-water separators often face technical limitations when handling high concentrations of oil and emulsified oils. Conventional gravity separators typically struggle to separate small, dispersed droplets of oil, reducing separation efficiency. So-called emulsified oils, which are made into stable mixtures with water by using surfactants or mechanical agitation, are very difficult to eliminate and their removal generally needs advanced process like coalescing or membrane filtrations. Moreover, the non-recovered high oil content causes obstacles, less working efficiency, and greater maintenance moment, thus elevating operational expenses. In industrial applications like marine, manufacturing, and wastewater treatment, failure to achieve separation can lead to environmental pollution or non-compliance with regulations. This includes separation technologies like centrifugal separators, electrocoagulation and ultrafiltration membranes. Nonetheless, such solutions tend to range on the expensive and operationally complex side, causing challenges with implementation, particularly along the small and medium enterprises (SME) segment.
Gravity segment dominated with a market share of over 42% in 2023, due to their cost-effectiveness, ease of operation, and minimal maintenance requirements. These separators use oil-water density difference for the separation process and are the most commonly used separators in different industries. They are extensively adopted in the marine, industrial wastewater treatment, and oil & gas sectors due to regulatory compliance and environmental protection. Also, their ability to consume high amounts of polluted water without needing complex mechanical structures or high-power consumption gives them a further edge in becoming a market leader. However, industries are using gravity-based systems like gravity separators for cost-effective oil and water separation.
The Industrial segment dominated with a market share of over 32% in 2023as the technology is widely used in a variety of diverse industries, including manufacturing, chemical processing, food & beverage, and wastewater treatment. These industries produce large volumes of oil-contaminated water, which requires effective separation solutions to meet environmental regulatory standards. Furthermore, the implementation of strict wastewater disposal regulations by governments and regulatory authorities to avoid pollution along with maintain operational efficiency is expected to drive industries towards the oil water separator market. Moreover, increasing emphasis on sustainability and water recycling also drive the market growth. Due to such automation as well as cost-effective and regulatory-compliant solutions for wastewater treatment, the Industrial segment retains its place in this market by far, which is attributed to rising growth opportunities for high-performance separators with improved efficiency.
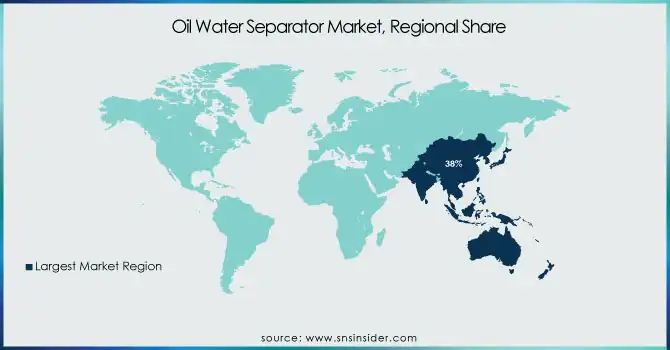
The Asia-Pacific region dominated with a market share of over 38% in 2023, owing to rapid industrialization, strict environmental rules and regulations, and the presence of manufacturing and oil & gas industries. The demand for oil and water separators in these countries is increasing due to an increase in industrial wastewater treatment needs along with government initiatives for pollution control. Moreover, the market is further propelled by the growing petrochemical, marine, and power generation segments. Stringent discharge regulations by environmental agencies coupled with the region's emphasis on sustainability, are propelling demand for effective separation technologies across the region. Asia-Pacific will continue to be a prominent market for oil-water separators owing to the increased investment in infrastructure and industrial installation, contributing to adherence with environmental regulations while facilitating industrial growth.
Europe is the fastest-growing region in the oil water separator market, driven by stringent environmental regulations aimed at reducing water pollution and ensuring compliance with wastewater discharge standards. In addition, increasing demand for wastewater treatment solutions across various industries, such as oil & gas, chemicals, and manufacturing, is expected to drive the market growth. Furthermore, with industries focusing towards sustainability, advanced oil water separators are getting more popular to avoid the environmental impact. Government policies like European Green Deal promotes investment in sustainability technologies as the market develops faster accelerates expansion. The increasing emphasis on industrial automation and also smart water management solutions is further driving the demand for efficient oil water separation systems in the region, making Europe a prominent region for future market developments.
Get Customized Report as per Your Business Requirement - Enquiry Now
Some of the major key players in the oil water separator market
Veolia (France) – (Hydrex Oil-Water Separators)
HydroFloTech (U.S.) – (Coalescing Oil-Water Separators)
Highland Tank (U.S.) – (Oil/Water Separators - UL-SERIES)
Wärtsilä (Finland) – (Wärtsilä OWS-15 Series)
Victor Marine Ltd. (U.K.) – (OWS-25GT Oil Water Separator)
Ultraspin (Australia) – (Ultraspin Oil Water Separator)
Mercer International Inc. (U.S.) – (Mercer CPI-Tilt Oil Water Separator)
Parkson Corporation (U.S.) – (Hydrocarbon Removal Systems)
Schlumberger (SLB) (U.S.) – (Cameron Oil-Water Separation Systems)
EnekaUAB (Lithuania) – (Eneka Oil-Water Separators)
Llalco Fluid Technology, S.L. (Spain) – (Bilge Water Separators)
Ellis Corporation (U.S.) – (Ellis Oil Water Separators)
Sulzer (Switzerland) – (Sulzer Oil/Water Separation Systems)
Alfa Laval (Sweden) – (PureBilge Bilge Water Separator)
GEA Group (Germany) – (GEA BilgePure Oil Water Separator)
H2O Surplus Ltd. (Canada) – (Industrial Oil Water Separators)
Containment Solutions (U.S.) – (Underground Oil-Water Separators)
Jowa AB (Sweden) – (JOWA 3SEP Oily Water Separator)
Freylit (Austria) – (Oil Separator Systems)
Filtramax (Italy) – (Centrifugal Oil Water Separators)
Suppliers for (Coalescing plate oil-water separators) on oil water separator market
Flottweg SE
Alfa Laval AB
GEA Westfalia Separator Group GmbH
Mohr Separations Research, Inc. (MSR)
Bhagyashree Accessories Pvt. Ltd.
H2K Technologies, Inc.
Parker Hannifin Corporation
HydroFlo Tech
Mercer International Inc.
Highland Tank
Recent Development
In May 2024: Veolia's subsidiary, SIDEM, won a $320 million contract to provide engineering and key technologies for Dubai's Hassyan seawater desalination plant. Commissioned by DEWA and ACWA Power, it will be the world's second-largest reverse osmosis facility and the largest powered entirely by solar energy.
In February 2024: Wärtsilä Water & Waste reintroduced its STC0-23 sewage treatment plant, the most compact model in its Super Trident series. Designed for both gravity and vacuum waste systems, it uses an activated sludge system to enhance biological treatment.
| Report Attributes | Details |
| Market Size in 2023 | USD 2.70 Billion |
| Market Size by 2032 | USD 3.92 Billion |
| CAGR | CAGR of 4.23% From 2024 to 2032 |
| Base Year | 2023 |
| Forecast Period | 2024-2032 |
| Historical Data | 2020-2022 |
| Report Scope & Coverage | Market Size, Segments Analysis, Competitive Landscape, Regional Analysis, DROC & SWOT Analysis, Forecast Outlook |
| Key Segments | • By Technology (Gravity, Sponge, Coalescing, Centrifuge, Other) • By End-User (Industrial, Marine, Aerospace, Power Generation, Defense, Others) |
| Regional Analysis/Coverage | North America (US, Canada, Mexico), Europe (Eastern Europe [Poland, Romania, Hungary, Turkey, Rest of Eastern Europe] Western Europe] Germany, France, UK, Italy, Spain, Netherlands, Switzerland, Austria, Rest of Western Europe]), Asia Pacific (China, India, Japan, South Korea, Vietnam, Singapore, Australia, Rest of Asia Pacific), Middle East & Africa (Middle East [UAE, Egypt, Saudi Arabia, Qatar, Rest of Middle East], Africa [Nigeria, South Africa, Rest of Africa], Latin America (Brazil, Argentina, Colombia, Rest of Latin America) |
| Company Profiles | Veolia, HydroFloTech, Highland Tank, Wärtsilä, Victor Marine Ltd., Ultraspin, Mercer International Inc., Parkson Corporation, Schlumberger (SLB), EnekaUAB, Llalco Fluid Technology, S.L., Ellis Corporation, Sulzer, Alfa Laval, GEA Group, H2O Surplus Ltd., Containment Solutions, Jowa AB, Freylit, Filtramax |
Ans: The Oil Water Separator Market is expected to grow at a CAGR of 4.23% during 2024-2032.
Ans: The Oil Water Separator Market was USD 2.70 billion in 2023 and is expected to reach USD 3.92 billion by 2032.
Ans: Stringent environmental regulations are driving the adoption of advanced oil-water separators across industries to ensure compliance with wastewater treatment and oil discharge standards.
Ans: The “Gravity” segment dominated the Oil Water Separator Market.
Ans: Asia-Pacific dominated the Oil Water Separator Market in 2023
Table of Contents:
1. Introduction
1.1 Market Definition
1.2 Scope (Inclusion and Exclusions)
1.3 Research Assumptions
2. Executive Summary
2.1 Market Overview
2.2 Regional Synopsis
2.3 Competitive Summary
3. Research Methodology
3.1 Top-Down Approach
3.2 Bottom-up Approach
3.3. Data Validation
3.4 Primary Interviews
4. Market Dynamics Impact Analysis
4.1 Market Driving Factors Analysis
4.1.2 Drivers
4.1.2 Restraints
4.1.3 Opportunities
4.1.4 Challenges
4.2 PESTLE Analysis
4.3 Porter’s Five Forces Model
5. Statistical Insights and Trends Reporting
5.1 Production Capacity, by Region (2020-2023)
5.2 Adoption Rates, by Industry
5.3 Installation & Maintenance Costs, by Region
5.4 Regulatory Compliance Rates, by Region
5.5 Export/Import Data, by Region (2023)
6. Competitive Landscape
6.1 List of Major Companies, By Region
6.2 Market Share Analysis, By Region
6.3 Product Benchmarking
6.3.1 Product specifications and features
6.3.2 Pricing
6.4 Strategic Initiatives
6.4.1 Marketing and promotional activities
6.4.2 Distribution and supply chain strategies
6.4.3 Expansion plans and new product launches
6.4.4 Strategic partnerships and collaborations
6.5 Technological Advancements
6.6 Market Positioning and Branding
7. Oil Water Separator Market Segmentation, By Technology
7.1 Chapter Overview
7.2 Gravity
7.2.1 Gravity Market Trends Analysis (2020-2032)
7.2.2 Gravity Market Size Estimates and Forecasts to 2032 (USD Million)
7.3 Sponge
7.3.1 Sponge Market Trends Analysis (2020-2032)
7.3.2 Sponge Market Size Estimates and Forecasts to 2032 (USD Million)
7.4 Coalescing
7.4.1 Coalescing Market Trends Analysis (2020-2032)
7.4.2 Coalescing Market Size Estimates and Forecasts to 2032 (USD Million)
7.5 Centrifuge
7.5.1 Centrifuge Market Trends Analysis (2020-2032)
7.5.2 Centrifuge Market Size Estimates and Forecasts to 2032 (USD Million)
7.6 Other
7.6.1 Other Market Trends Analysis (2020-2032)
7.6.2 Other Market Size Estimates and Forecasts to 2032 (USD Million)
8. Oil Water Separator Market Segmentation, By End-User
8.1 Chapter Overview
8.2 Industrial
8.2.1 Industrial Market Trends Analysis (2020-2032)
8.2.2 Industrial Market Size Estimates and Forecasts to 2032 (USD Million)
8.3 Marine
8.3.1 Marine Market Trends Analysis (2020-2032)
8.3.2 Marine Market Size Estimates and Forecasts to 2032 (USD Million)
8.4 Aerospace
8.4.1 Aerospace Market Trends Analysis (2020-2032)
8.4.2 Aerospace Market Size Estimates and Forecasts to 2032 (USD Million)
8.5 Power Generation
8.5.1 Power Generation Market Trends Analysis (2020-2032)
8.5.2 Power Generation Market Size Estimates and Forecasts to 2032 (USD Million)
8.6 Defense
8.6.1 Defense Market Trends Analysis (2020-2032)
8.6.2 Defense Market Size Estimates and Forecasts to 2032 (USD Million)
8.7 Others
8.7.1 Others Market Trends Analysis (2020-2032)
8.7.2 Others Market Size Estimates and Forecasts to 2032 (USD Million)
9. Regional Analysis
9.1 Chapter Overview
9.2 North America
9.2.1 Trends Analysis
9.2.2 North America Oil Water Separator Market Estimates and Forecasts, by Country (2020-2032) (USD Million)
9.2.3 North America Oil Water Separator Market Estimates and Forecasts, By Technology (2020-2032) (USD Million)
9.2.4 North America Oil Water Separator Market Estimates and Forecasts, By End-User (2020-2032) (USD Million)
9.2.5 USA
9.2.5.1 USA Oil Water Separator Market Estimates and Forecasts, By Technology (2020-2032) (USD Million)
9.2.5.2 USA Oil Water Separator Market Estimates and Forecasts, By End-User (2020-2032) (USD Million)
9.2.6 Canada
9.2.6.1 Canada Oil Water Separator Market Estimates and Forecasts, By Technology (2020-2032) (USD Million)
9.2.6.2 Canada Oil Water Separator Market Estimates and Forecasts, By End-User (2020-2032) (USD Million)
9.2.7 Mexico
9.2.7.1 Mexico Oil Water Separator Market Estimates and Forecasts, By Technology (2020-2032) (USD Million)
9.2.7.2 Mexico Oil Water Separator Market Estimates and Forecasts, By End-User (2020-2032) (USD Million)
9.3 Europe
9.3.1 Eastern Europe
9.3.1.1 Trends Analysis
9.3.1.2 Eastern Europe Oil Water Separator Market Estimates and Forecasts, by Country (2020-2032) (USD Million)
9.3.1.3 Eastern Europe Oil Water Separator Market Estimates and Forecasts, By Technology (2020-2032) (USD Million)
9.3.1.4 Eastern Europe Oil Water Separator Market Estimates and Forecasts, By End-User (2020-2032) (USD Million)
9.3.1.5 Poland
9.3.1.5.1 Poland Oil Water Separator Market Estimates and Forecasts, By Technology (2020-2032) (USD Million)
9.3.1.5.2 Poland Oil Water Separator Market Estimates and Forecasts, By End-User (2020-2032) (USD Million)
9.3.1.6 Romania
9.3.1.6.1 Romania Oil Water Separator Market Estimates and Forecasts, By Technology (2020-2032) (USD Million)
9.3.1.6.2 Romania Oil Water Separator Market Estimates and Forecasts, By End-User (2020-2032) (USD Million)
9.3.1.7 Hungary
9.3.1.7.1 Hungary Oil Water Separator Market Estimates and Forecasts, By Technology (2020-2032) (USD Million)
9.3.1.7.2 Hungary Oil Water Separator Market Estimates and Forecasts, By End-User (2020-2032) (USD Million)
9.3.1.8 Turkey
9.3.1.8.1 Turkey Oil Water Separator Market Estimates and Forecasts, By Technology (2020-2032) (USD Million)
9.3.1.8.2 Turkey Oil Water Separator Market Estimates and Forecasts, By End-User (2020-2032) (USD Million)
9.3.1.9 Rest of Eastern Europe
9.3.1.9.1 Rest of Eastern Europe Oil Water Separator Market Estimates and Forecasts, By Technology (2020-2032) (USD Million)
9.3.1.9.2 Rest of Eastern Europe Oil Water Separator Market Estimates and Forecasts, By End-User (2020-2032) (USD Million)
9.3.2 Western Europe
9.3.2.1 Trends Analysis
9.3.2.2 Western Europe Oil Water Separator Market Estimates and Forecasts, by Country (2020-2032) (USD Million)
9.3.2.3 Western Europe Oil Water Separator Market Estimates and Forecasts, By Technology (2020-2032) (USD Million)
9.3.2.4 Western Europe Oil Water Separator Market Estimates and Forecasts, By End-User (2020-2032) (USD Million)
9.3.2.5 Germany
9.3.2.5.1 Germany Oil Water Separator Market Estimates and Forecasts, By Technology (2020-2032) (USD Million)
9.3.2.5.2 Germany Oil Water Separator Market Estimates and Forecasts, By End-User (2020-2032) (USD Million)
9.3.2.6 France
9.3.2.6.1 France Oil Water Separator Market Estimates and Forecasts, By Technology (2020-2032) (USD Million)
9.3.2.6.2 France Oil Water Separator Market Estimates and Forecasts, By End-User (2020-2032) (USD Million)
9.3.2.7 UK
9.3.2.7.1 UK Oil Water Separator Market Estimates and Forecasts, By Technology (2020-2032) (USD Million)
9.3.2.7.2 UK Oil Water Separator Market Estimates and Forecasts, By End-User (2020-2032) (USD Million)
9.3.2.8 Italy
9.3.2.8.1 Italy Oil Water Separator Market Estimates and Forecasts, By Technology (2020-2032) (USD Million)
9.3.2.8.2 Italy Oil Water Separator Market Estimates and Forecasts, By End-User (2020-2032) (USD Million)
9.3.2.9 Spain
9.3.2.9.1 Spain Oil Water Separator Market Estimates and Forecasts, By Technology (2020-2032) (USD Million)
9.3.2.9.2 Spain Oil Water Separator Market Estimates and Forecasts, By End-User (2020-2032) (USD Million)
9.3.2.10 Netherlands
9.3.2.10.1 Netherlands Oil Water Separator Market Estimates and Forecasts, By Technology (2020-2032) (USD Million)
9.3.2.10.2 Netherlands Oil Water Separator Market Estimates and Forecasts, By End-User (2020-2032) (USD Million)
9.3.2.11 Switzerland
9.3.2.11.1 Switzerland Oil Water Separator Market Estimates and Forecasts, By Technology (2020-2032) (USD Million)
9.3.2.11.2 Switzerland Oil Water Separator Market Estimates and Forecasts, By End-User (2020-2032) (USD Million)
9.3.2.12 Austria
9.3.2.12.1 Austria Oil Water Separator Market Estimates and Forecasts, By Technology (2020-2032) (USD Million)
9.3.2.12.2 Austria Oil Water Separator Market Estimates and Forecasts, By End-User (2020-2032) (USD Million)
9.3.2.13 Rest of Western Europe
9.3.2.13.1 Rest of Western Europe Oil Water Separator Market Estimates and Forecasts, By Technology (2020-2032) (USD Million)
9.3.2.13.2 Rest of Western Europe Oil Water Separator Market Estimates and Forecasts, By End-User (2020-2032) (USD Million)
9.4 Asia Pacific
9.4.1 Trends Analysis
9.4.2 Asia Pacific Oil Water Separator Market Estimates and Forecasts, by Country (2020-2032) (USD Million)
9.4.3 Asia Pacific Oil Water Separator Market Estimates and Forecasts, By Technology (2020-2032) (USD Million)
9.4.4 Asia Pacific Oil Water Separator Market Estimates and Forecasts, By End-User (2020-2032) (USD Million)
9.4.5 China
9.4.5.1 China Oil Water Separator Market Estimates and Forecasts, By Technology (2020-2032) (USD Million)
9.4.5.2 China Oil Water Separator Market Estimates and Forecasts, By End-User (2020-2032) (USD Million)
9.4.6 India
9.4.5.1 India Oil Water Separator Market Estimates and Forecasts, By Technology (2020-2032) (USD Million)
9.4.5.2 India Oil Water Separator Market Estimates and Forecasts, By End-User (2020-2032) (USD Million)
9.4.5 Japan
9.4.5.1 Japan Oil Water Separator Market Estimates and Forecasts, By Technology (2020-2032) (USD Million)
9.4.5.2 Japan Oil Water Separator Market Estimates and Forecasts, By End-User (2020-2032) (USD Million)
9.4.6 South Korea
9.4.6.1 South Korea Oil Water Separator Market Estimates and Forecasts, By Technology (2020-2032) (USD Million)
9.4.6.2 South Korea Oil Water Separator Market Estimates and Forecasts, By End-User (2020-2032) (USD Million)
9.4.7 Vietnam
9.4.7.1 Vietnam Oil Water Separator Market Estimates and Forecasts, By Technology (2020-2032) (USD Million)
9.2.7.2 Vietnam Oil Water Separator Market Estimates and Forecasts, By End-User (2020-2032) (USD Million)
9.4.8 Singapore
9.4.8.1 Singapore Oil Water Separator Market Estimates and Forecasts, By Technology (2020-2032) (USD Million)
9.4.8.2 Singapore Oil Water Separator Market Estimates and Forecasts, By End-User (2020-2032) (USD Million)
9.4.9 Australia
9.4.9.1 Australia Oil Water Separator Market Estimates and Forecasts, By Technology (2020-2032) (USD Million)
9.4.9.2 Australia Oil Water Separator Market Estimates and Forecasts, By End-User (2020-2032) (USD Million)
9.4.10 Rest of Asia Pacific
9.4.10.1 Rest of Asia Pacific Oil Water Separator Market Estimates and Forecasts, By Technology (2020-2032) (USD Million)
9.4.10.2 Rest of Asia Pacific Oil Water Separator Market Estimates and Forecasts, By End-User (2020-2032) (USD Million)
9.5 Middle East and Africa
9.5.1 Middle East
9.5.1.1 Trends Analysis
9.5.1.2 Middle East Oil Water Separator Market Estimates and Forecasts, by Country (2020-2032) (USD Million)
9.5.1.3 Middle East Oil Water Separator Market Estimates and Forecasts, By Technology (2020-2032) (USD Million)
9.5.1.4 Middle East Oil Water Separator Market Estimates and Forecasts, By End-User (2020-2032) (USD Million)
9.5.1.5 UAE
9.5.1.5.1 UAE Oil Water Separator Market Estimates and Forecasts, By Technology (2020-2032) (USD Million)
9.5.1.5.2 UAE Oil Water Separator Market Estimates and Forecasts, By End-User (2020-2032) (USD Million)
9.5.1.6 Egypt
9.5.1.6.1 Egypt Oil Water Separator Market Estimates and Forecasts, By Technology (2020-2032) (USD Million)
9.5.1.6.2 Egypt Oil Water Separator Market Estimates and Forecasts, By End-User (2020-2032) (USD Million)
9.5.1.7 Saudi Arabia
9.5.1.7.1 Saudi Arabia Oil Water Separator Market Estimates and Forecasts, By Technology (2020-2032) (USD Million)
9.5.1.7.2 Saudi Arabia Oil Water Separator Market Estimates and Forecasts, By End-User (2020-2032) (USD Million)
9.5.1.8 Qatar
9.5.1.8.1 Qatar Oil Water Separator Market Estimates and Forecasts, By Technology (2020-2032) (USD Million)
9.5.1.8.2 Qatar Oil Water Separator Market Estimates and Forecasts, By End-User (2020-2032) (USD Million)
9.5.1.9 Rest of Middle East
9.5.1.9.1 Rest of Middle East Oil Water Separator Market Estimates and Forecasts, By Technology (2020-2032) (USD Million)
9.5.1.9.2 Rest of Middle East Oil Water Separator Market Estimates and Forecasts, By End-User (2020-2032) (USD Million)
9.5.2 Africa
9.5.2.1 Trends Analysis
9.5.2.2 Africa Oil Water Separator Market Estimates and Forecasts, by Country (2020-2032) (USD Million)
9.5.2.3 Africa Oil Water Separator Market Estimates and Forecasts, By Technology (2020-2032) (USD Million)
9.5.2.4 Africa Oil Water Separator Market Estimates and Forecasts, By End-User (2020-2032) (USD Million)
9.5.2.5 South Africa
9.5.2.5.1 South Africa Oil Water Separator Market Estimates and Forecasts, By Technology (2020-2032) (USD Million)
9.5.2.5.2 South Africa Oil Water Separator Market Estimates and Forecasts, By End-User (2020-2032) (USD Million)
9.5.2.6 Nigeria
9.5.2.6.1 Nigeria Oil Water Separator Market Estimates and Forecasts, By Technology (2020-2032) (USD Million)
9.5.2.6.2 Nigeria Oil Water Separator Market Estimates and Forecasts, By End-User (2020-2032) (USD Million)
9.5.2.7 Rest of Africa
9.5.2.7.1 Rest of Africa Oil Water Separator Market Estimates and Forecasts, By Technology (2020-2032) (USD Million)
9.5.2.7.2 Rest of Africa Oil Water Separator Market Estimates and Forecasts, By End-User (2020-2032) (USD Million)
9.6 Latin America
9.6.1 Trends Analysis
9.6.2 Latin America Oil Water Separator Market Estimates and Forecasts, by Country (2020-2032) (USD Million)
9.6.3 Latin America Oil Water Separator Market Estimates and Forecasts, By Technology (2020-2032) (USD Million)
9.6.4 Latin America Oil Water Separator Market Estimates and Forecasts, By End-User (2020-2032) (USD Million)
9.6.5 Brazil
9.6.5.1 Brazil Oil Water Separator Market Estimates and Forecasts, By Technology (2020-2032) (USD Million)
9.6.5.2 Brazil Oil Water Separator Market Estimates and Forecasts, By End-User (2020-2032) (USD Million)
9.6.6 Argentina
9.6.6.1 Argentina Oil Water Separator Market Estimates and Forecasts, By Technology (2020-2032) (USD Million)
9.6.6.2 Argentina Oil Water Separator Market Estimates and Forecasts, By End-User (2020-2032) (USD Million)
9.6.7 Colombia
9.6.7.1 Colombia Oil Water Separator Market Estimates and Forecasts, By Technology (2020-2032) (USD Million)
9.6.7.2 Colombia Oil Water Separator Market Estimates and Forecasts, By End-User (2020-2032) (USD Million)
9.6.8 Rest of Latin America
9.6.8.1 Rest of Latin America Oil Water Separator Market Estimates and Forecasts, By Technology (2020-2032) (USD Million)
9.6.8.2 Rest of Latin America Oil Water Separator Market Estimates and Forecasts, By End-User (2020-2032) (USD Million)
10. Company Profiles
10.1 EnekaUAB (Lithuania)
10.1.1 Company Overview
10.1.2 Financial
10.1.3 Products/ Services Offered
110.1.4 SWOT Analysis
10.2 Highland Tank (U.S.)
10.2.1 Company Overview
10.2.2 Financial
10.2.3 Products/ Services Offered
10.2.4 SWOT Analysis
10.3 Mercer International Inc. (U.S.)
10.3.1 Company Overview
10.3.2 Financial
10.3.3 Products/ Services Offered
10.3.4 SWOT Analysis
10.4 Veolia (France)
10.4.1 Company Overview
10.4.2 Financial
10.4.3 Products/ Services Offered
10.4.4 SWOT Analysis
10.5 Wärtsilä (Finland)
10.5.1 Company Overview
10.5.2 Financial
10.5.3 Products/ Services Offered
10.5.4 SWOT Analysis
10.6 Llalco Fluid Technology, S.L. (Spain)
10.6.1 Company Overview
10.6.2 Financial
10.6.3 Products/ Services Offered
10.6.4 SWOT Analysis
10.7 Parkson Corporation (U.S.)
10.7.1 Company Overview
10.7.2 Financial
10.7.3 Products/ Services Offered
10.7.4 SWOT Analysis
10.8 Ellis Corporation (U.S.)
10.8.1 Company Overview
10.8.2 Financial
10.8.3 Products/ Services Offered
10.8.4 SWOT Analysis
10.9 Schlumberger (SLB) (U.S.)
10.9.1 Company Overview
10.9.2 Financial
10.9.3 Products/ Services Offered
10.9.4 SWOT Analysis
10.10 Victor Marine Ltd. (U.K.)
10.9.1 Company Overview
10.9.2 Financial
10.9.3 Products/ Services Offered
10.9.4 SWOT Analysis
11. Use Cases and Best Practices
12. Conclusion
An accurate research report requires proper strategizing as well as implementation. There are multiple factors involved in the completion of good and accurate research report and selecting the best methodology to compete the research is the toughest part. Since the research reports we provide play a crucial role in any company’s decision-making process, therefore we at SNS Insider always believe that we should choose the best method which gives us results closer to reality. This allows us to reach at a stage wherein we can provide our clients best and accurate investment to output ratio.
Each report that we prepare takes a timeframe of 350-400 business hours for production. Starting from the selection of titles through a couple of in-depth brain storming session to the final QC process before uploading our titles on our website we dedicate around 350 working hours. The titles are selected based on their current market cap and the foreseen CAGR and growth.
The 5 steps process:
Step 1: Secondary Research:
Secondary Research or Desk Research is as the name suggests is a research process wherein, we collect data through the readily available information. In this process we use various paid and unpaid databases which our team has access to and gather data through the same. This includes examining of listed companies’ annual reports, Journals, SEC filling etc. Apart from this our team has access to various associations across the globe across different industries. Lastly, we have exchange relationships with various university as well as individual libraries.

Step 2: Primary Research
When we talk about primary research, it is a type of study in which the researchers collect relevant data samples directly, rather than relying on previously collected data. This type of research is focused on gaining content specific facts that can be sued to solve specific problems. Since the collected data is fresh and first hand therefore it makes the study more accurate and genuine.
We at SNS Insider have divided Primary Research into 2 parts.
Part 1 wherein we interview the KOLs of major players as well as the upcoming ones across various geographic regions. This allows us to have their view over the market scenario and acts as an important tool to come closer to the accurate market numbers. As many as 45 paid and unpaid primary interviews are taken from both the demand and supply side of the industry to make sure we land at an accurate judgement and analysis of the market.
This step involves the triangulation of data wherein our team analyses the interview transcripts, online survey responses and observation of on filed participants. The below mentioned chart should give a better understanding of the part 1 of the primary interview.

Part 2: In this part of primary research the data collected via secondary research and the part 1 of the primary research is validated with the interviews from individual consultants and subject matter experts.
Consultants are those set of people who have at least 12 years of experience and expertise within the industry whereas Subject Matter Experts are those with at least 15 years of experience behind their back within the same space. The data with the help of two main processes i.e., FGDs (Focused Group Discussions) and IDs (Individual Discussions). This gives us a 3rd party nonbiased primary view of the market scenario making it a more dependable one while collation of the data pointers.
Step 3: Data Bank Validation
Once all the information is collected via primary and secondary sources, we run that information for data validation. At our intelligence centre our research heads track a lot of information related to the market which includes the quarterly reports, the daily stock prices, and other relevant information. Our data bank server gets updated every fortnight and that is how the information which we collected using our primary and secondary information is revalidated in real time.

Step 4: QA/QC Process
After all the data collection and validation our team does a final level of quality check and quality assurance to get rid of any unwanted or undesired mistakes. This might include but not limited to getting rid of the any typos, duplication of numbers or missing of any important information. The people involved in this process include technical content writers, research heads and graphics people. Once this process is completed the title gets uploader on our platform for our clients to read it.
Step 5: Final QC/QA Process:
This is the last process and comes when the client has ordered the study. In this process a final QA/QC is done before the study is emailed to the client. Since we believe in giving our clients a good experience of our research studies, therefore, to make sure that we do not lack at our end in any way humanly possible we do a final round of quality check and then dispatch the study to the client.
Key Segmentation
By Technology
Gravity
Sponge
Coalescing
Centrifuge
Other
By End-User
Industrial
Marine
Aerospace
Power Generation
Defense
Others
Request for Segment Customization as per your Business Requirement: Segment Customization Request
Regional Coverage:
North America
US
Canada
Mexico
Europe
Eastern Europe
Poland
Romania
Hungary
Turkey
Rest of Eastern Europe
Western Europe
Germany
France
UK
Italy
Spain
Netherlands
Switzerland
Austria
Rest of Western Europe
Asia Pacific
China
India
Japan
South Korea
Vietnam
Singapore
Australia
Rest of Asia Pacific
Middle East & Africa
Middle East
UAE
Egypt
Saudi Arabia
Qatar
Rest of Middle East
Africa
Nigeria
South Africa
Rest of Africa
Latin America
Brazil
Argentina
Colombia
Rest of Latin America
Request for Country Level Research Report: Country Level Customization Request
Available Customization
With the given market data, SNS Insider offers customization as per the company’s specific needs. The following customization options are available for the report:
Detailed Volume Analysis
Criss-Cross segment analysis (e.g. Product X Application)
Competitive Product Benchmarking
Geographic Analysis
Additional countries in any of the regions
Customized Data Representation
Detailed analysis and profiling of additional market players
The Machine Tools Market size was estimated at USD 106.55 billion in 2023 and is expected to reach USD 189.44 billion by 2032 at a CAGR of 6.65% by 2024-2032.
The Telehandler Market size was valued at USD 5.66 Billion in 2023 and is now anticipated to grow to USD 8.56 Billion by 2032, displaying a compound annual growth rate (CAGR) of 4.87% during the forecast Period 2024-2032.
The Piling Machine Market size was valued at USD 5.31 Billion in 2023. It is expected to grow to USD 7.48 Billion by 2032 and grow at a CAGR of 3.89% over the forecast period of 2024-2032.
The Industrial Pumps Market Size was valued at USD 55.95 Billion in 2023 and is expected to reach USD 87.3 Billion by 2032 and grow at a CAGR of 4.92% over the forecast period 2024-2032.
Cryogenic Tanks Market Size was valued at USD 6.78 Billion in 2023 and is expected to reach USD 10.61 Billion by 2032 and grow at a CAGR of 5.17% over the forecast period 2024-2032.
The Pumps Market size was valued at USD 95.8 Billion in 2023. It is expected to grow to USD 128.25 Billion by 2031 and grow at a CAGR of 3.71% over the forecast period of 2024-2031.

Hi! Click one of our member below to chat on Phone
© 2025 All Rights Reserved by SNS Insider Pvt Ltd


