Get More Information on OEM Insulation Market - Request Sample Report
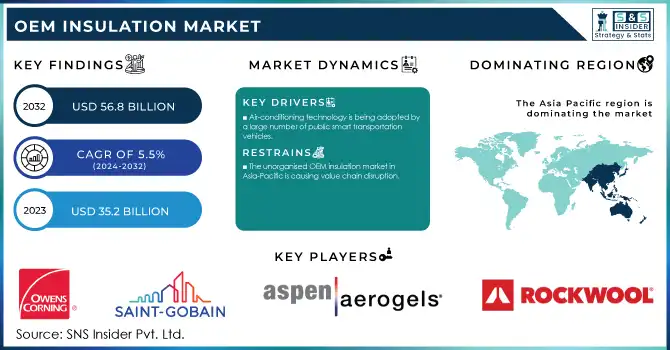
The OEM Insulation Market size was valued at USD 38.80 Billion in 2023 and is expected to reach USD 62.80 Billion by 2032, growing at a CAGR of 5.50% over the forecast period 2024-2032.
The OEM Insulation Market is set for growth, influenced by several key factors. Our report analyses raw material supply chain dynamics and the impact of energy efficiency regulations on innovation. It highlights environmental sustainability trends and evaluates performance metrics of insulation materials. Additionally, insights into price fluctuations, a cost-benefit analysis for OEMs, and advanced insulation products for niche applications will provide a comprehensive understanding of the market landscape.
Drivers
Increasing demand for energy-efficient solutions across automotive, construction, and industrial applications drives OEM insulation market growth
Demand for energy-efficient solutions across automotive, construction, and industrial sectors is hugely driving the OEM insulation market. With increasing rules and regulations to control energy usage and a mounting concern for sustainability, OEMs are opting more for insulation solutions to minimize the consumption of energy and to raise the overall efficiency of the application. In automotive, electric vehicles are emerging strongly, which mandates advanced insulation material to ensure it maintain its level of energy efficiency, thermal management, and acoustics performance. The construction industry is increasingly adopting green building standards and energy-efficient designs, hence leading to the growth of insulation needs. The imperative to reduce heating, ventilation, and air conditioning (HVAC) energy consumption has boosted the widespread use of high-performance insulation materials. Another reason is the sector of industrial applications such as power plants and manufacturing facilities that require special thermal and sound protection and safety insulation, all factors that increase the demand for these products.
Restraints
Technical challenges in integrating new insulation materials into existing manufacturing processes limit market growth
A technical challenge that hampers market growth is the integration of new insulation materials into already existing manufacturing processes. The major reason is that many manufacturers do not embrace innovative insulation materials, as this will require them to modify the already existing production lines, receive further training, or acquire new equipment, which can be expensive. For organizations that have production lines already in place for automotive or construction companies, using different insulation-related solutions may need to discontinue the ongoing manufacturing process, delaying production. Moreover, some insulation types require more advanced and specialized handling or even expert service to ensure proper performance, which can be quite a hindrance for manufacturers lacking such resources. Therefore, the complexity of change in new insulation technologies may constrain the overall use of advanced materials across the diverse OEM sectors.
Opportunities
Rising popularity of electric vehicles and renewable energy driving demand for high-performance insulation solutions
The increasing number of electric vehicles (EVs) in production and a global push toward renewable energy are significant opportunities for the OEM insulation market. During this period, OEMs will need to provide far more advanced insulation solutions to tackle temperature control and increase efficiency in energy use as demand for EVs remains rocket high. Electric vehicles need highly efficient thermal management systems, where advanced insulation materials, such as aerogels or composite insulation, are used to protect batteries and ensure optimal performance. In parallel, the renewable energy sector, particularly solar and wind energy, is increasingly adopting high-performance insulation materials for energy storage systems and transmission lines to improve energy efficiency. These emerging sectors provide a tremendous market opportunity for insulation manufacturers to develop innovative products that meet these industries' special needs.
Challenge
Supply chain disruptions and geopolitical tensions impacting the consistency of raw material availability for OEM insulation production
Supply chain disruption due to geopolitical issues, trade barriers, and natural conditions is one of the most significant threats found in OEM insulation markets. Global suppliers provide many raw materials to the insulation industry, which also include fiberglass, polyurethane, and mineral wool. Geopolitical instability, including trade wars or regional conflicts, can severely interrupt the availability and cost of these staple materials, causing bottlenecks in supply chains. Moreover, the ongoing challenges of COVID-19 and subsequent supply chain interruptions have brought to the fore the fragility of the insulation market. This may lead to a delay in production, increased raw material prices, and an overall inability to meet market demand, all of which are factors that impede the growth of the OEM insulation market.
By Material
The glass wool segment accounted for the largest share in the OEM insulation market in 2023, holding a market share of approximately 30%. Glass wool finds more application owing to its better thermal and acoustic insulation characteristics, thus a requirement for various sectors, including construction and HVAC systems. Organizations such as the U.S. DOE promote the use of glass wool in building codes and standards for insulation for its energy efficiency, thus saving heating and cooling expenses. Additionally, the construction industry is increasingly becoming sustainable, which goes well with the high performance of glass wool insulation in energy conservation. Availability of glass wool insulation products from prominent manufacturers such as Owens Corning and Saint-Gobain also strengthens its market position, since these companies are continuously innovating and enhancing the properties of their glass wool solutions.
In 2023, the thermal insulation segment dominated and accounted for the largest market share of around 55%. Thermal insulation is very important in reducing heat pathways, which is why it is one of the primary concerns ion many different fields, especially construction and HVAC systems. An increasing focus on energy efficiency and sustainability in building codes, backed by institutions such as the International Energy Agency (IEA), has been a key driver of the thermal insulation solutions market. Examples include LEED and BREEAM-based building standards that reward the installation of high-performance thermal insulation for energy-saving purposes. Additionally, the development of new thermal insulation materials, including aerogels and high-performance foams, is increasing the attractiveness of the market, enabling manufacturers to comply with strict energy efficiency regulations while improving overall building performance.
In 2023, the building and construction category dominated and accounted for the largest share of the OEM insulation market, with a share of approximately 40%. One of the leading contributions to this dominancy is elucidated as the sharp increase in building facilities across the globe specifically in residential and commercial. The increasing momentum of green building and energy-saving practices, supported by government initiatives and regulations for reducing carbon footprints, has resulted in a high demand for insulation solutions in this sector. Policies such as the U.S. Energy Star, for example, promote the application of insulation materials on new structures for better energy efficiency. Competitive Landscape Building and construction insulation products market is a fragmented market. This has led companies like Knauf Insulation, and Rockwool International to promote various types of innovative insulation development for the building and construction industry.
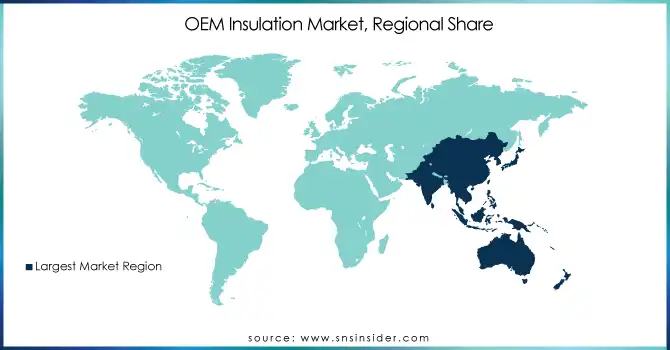
In 2023, Asia Pacific dominated and accounted for a market share of around 45% of the OEM insulation industry, due to the fast urbanization and industrialization in countries including China, India, and Japan. As the largest market, China is driving such energy-efficient buildings through various government policies including the "13th Five-Year Plan for Ecological and Environmental Protection." The demand for insulation products is further enhanced on account of India’s flourishing infrastructure and real estate sectors. In Japan, the expansion of its manufacturing industries, especially in automotive and electronics, increases the demand for insulation in OEM applications. The region’s growth looks set to continue, backed by tougher energy efficiency standards, according to the Asian Development Bank. Major players such as Owens Corning and Rockwool are expanding their operations in Asia Pacific to cater to the growing demand. Trend Classifies the Region as the major contributing Factor for the Global OEM Insulation Market
Get Customized Report as per Your Business Requirement - Request For Customized Report
Moreover, North America emerged as the fastest growing region in the OEM insulation market in 2023 and was the fastest growing region, registering high year-on-year growth at 6.7%, in terms of value sales. However, this is primarily due to growing government rules for energy efficiency and the adoption of sustainable construction. In the United States, programs like Energy Star are promoting the use of insulation in residential and commercial buildings. Furthermore, the growing use of thermal insulation in the automotive industry, more specifically, for electric vehicles (EVs) is also adding traction to the market. In addition, Canada is pushing for green building regulations, which are contributing to the growth in the demand for OEM insulation products. The drive for advanced insulation technologies such as aerogels and environmentally friendly foams being led by the U.S. Department of Energy is driving rapid growth. Major players such as Saint-Gobain, Owens Corning, and 3M are developing new solutions to meet this demand. This region exhibits substantial regulatory support, with increasing requirements for industrial and residential insulation in the upcoming timeframe positively impacting the overall growth.
Recent Highlights:
March 2024: IC Group announced the acquisition of RSL Group, a UK-based distributor of heating, ventilation and air conditioning (HVAC) products by IPCOM, a Belgium-based independent insulation company with the aim of expanding in the HVAC sector. The acquisition fits IPCOM’s mission for energy efficiency and saw Seamus Kerr, RSL’s technical director, joining IPCOM’s board. The deal ends RSL’s 116-year leadership by David Cherrill and Gerry McDonagh.
Owens Corning (Thermafiber, PINK Insulation)
Rockwool A/S (Rockwool Insulation, Comfortboard)
Covestro AG (Baytherm, Baydur)
Armacell (Armaflex, ArmaSound)
Huntsman Corporation (Polyurethane Insulation, Dymel)
Saint-Gobain ISOVER (Isover Insulation, Climaver)
Rogers Corporation (Rogers Poron, RO4000 Series)
Recticel Group (Europur, Recticel Insulation)
Aspen Aerogels Inc (Pyrogel, Spaceloft)
Morgan Advanced Materials PLC (Thermal Ceramics, Morgan Insulation)
Knauf Insulation (Knauf Earthwool, EcoBatt)
Johns Manville (JM Fiberglas, JM Insulation)
Kingspan Group (Kingspan Insulation, Kooltherm)
3M (3M Thinsulate, 3M Fire Protection)
BASF (Elastopipe, BASF Polyurethane)
Paroc Group (Paroc Stone Wool, Paroc Sandwich Panels)
China Jushi Co., Ltd. (Fiberglass Insulation, Jushi Glass Wool)
ACH Foam Technologies LLC (Achieve Foam, Foamular)
Demilec Inc. (Sealection, Heatlok)
Honeywell International, Inc. (Thermal Ceramics, Honeywell Fiber Insulation)
| Report Attributes | Details |
|---|---|
| Market Size in 2023 | USD 38.80 Billion |
| Market Size by 2032 | USD 62.80 Billion |
| CAGR | CAGR of 5.50% From 2024 to 2032 |
| Base Year | 2023 |
| Forecast Period | 2024-2032 |
| Historical Data | 2020-2022 |
| Report Scope & Coverage | Market Size, Segments Analysis, Competitive Landscape, Regional Analysis, DROC & SWOT Analysis, Forecast Outlook |
| Key Segments | •By Material (Glass Wool, Mineral Wool, Reflective Insulation, Ceramic Insulation, Foamed Plastic, Elastomeric Foam, Others) •By Application (Thermal Insulation, Acoustic Insulation, Electrical Insulation, Others) •By End-use Industry (Aerospace, Automotive, Marine, Building and Construction, Consumer Appliances, Others) |
| Regional Analysis/Coverage | North America (US, Canada, Mexico), Europe (Eastern Europe [Poland, Romania, Hungary, Turkey, Rest of Eastern Europe] Western Europe] Germany, France, UK, Italy, Spain, Netherlands, Switzerland, Austria, Rest of Western Europe]), Asia Pacific (China, India, Japan, South Korea, Vietnam, Singapore, Australia, Rest of Asia Pacific), Middle East & Africa (Middle East [UAE, Egypt, Saudi Arabia, Qatar, Rest of Middle East], Africa [Nigeria, South Africa, Rest of Africa], Latin America (Brazil, Argentina, Colombia, Rest of Latin America) |
| Company Profiles | Owens Corning, Rockwool A/S, Covestro AG, Armacell, Huntsman Corporation, Saint-Gobain ISOVER, Rogers Corporation, Recticel Group, Aspen Aerogels Inc, Morgan Advanced Materials PLC and other key players |
Ans: The Asia Pacific region dominated with a market share of around 45%.
Ans: The thermal insulation segment dominated, with a market share of around 55%.
Ans: The rising popularity of electric vehicles and renewable energy is driving demand for high-performance insulation solutions.
Ans: It is expected to reach USD 62.80 Billion by 2032, growing at a CAGR of 5.50%.
Ans: The OEM Insulation Market was valued at USD 38.80 Billion in 2023.
Table of Contents
1. Introduction
1.1 Market Definition
1.2 Scope (Inclusion and Exclusions)
1.3 Research Assumptions
2. Executive Summary
2.1 Market Overview
2.2 Regional Synopsis
2.3 Competitive Summary
3. Research Methodology
3.1 Top-Down Approach
3.2 Bottom-up Approach
3.3. Data Validation
3.4 Primary Interviews
4. Market Dynamics Impact Analysis
4.1 Market Driving Factors Analysis
4.1.1 Drivers
4.1.2 Restraints
4.1.3 Opportunities
4.1.4 Challenges
4.2 PESTLE Analysis
4.3 Porter’s Five Forces Model
5. Statistical Insights and Trends Reporting
5.1 Raw Material Supply Chain Dynamics
5.2 Energy Efficiency & Regulations Impact
5.3 Environmental Sustainability Trends
5.4 Performance Metrics of Insulation Materials
5.5 Price Fluctuations & Market Sensitivity
5.6 Cost-Benefit Analysis for OEMs
6. Competitive Landscape
6.1 List of Major Companies, By Region
6.2 Market Share Analysis, By Region
6.3 Product Benchmarking
6.3.1 Product specifications and features
6.3.2 Pricing
6.4 Strategic Initiatives
6.4.1 Marketing and promotional activities
6.4.2 Distribution and supply chain strategies
6.4.3 Expansion plans and new product launches
6.4.4 Strategic partnerships and collaborations
6.5 Technological Advancements
6.6 Market Positioning and Branding
7. OEM Insulation Market Segmentation, by Material
7.1 Chapter Overview
7.2 Glass Wool
7.2.1 Glass Wool Market Trends Analysis (2020-2032)
7.2.2 Glass Wool Market Size Estimates and Forecasts to 2032 (USD Billion)
7.3 Mineral Wool
7.3.1 Mineral Wool Market Trends Analysis (2020-2032)
7.3.2 Mineral Wool Market Size Estimates and Forecasts to 2032 (USD Billion)
7.4 Reflective Insulation
7.4.1 Reflective Insulation Market Trends Analysis (2020-2032)
7.4.2 Reflective Insulation Market Size Estimates and Forecasts to 2032 (USD Billion)
7.5 Ceramic Insulation
7.5.1 Ceramic Insulation Market Trends Analysis (2020-2032)
7.5.2 Ceramic Insulation Market Size Estimates and Forecasts to 2032 (USD Billion)
7.6 Foamed Plastic
7.6.1 Foamed Plastic Market Trends Analysis (2020-2032)
7.6.2 Foamed Plastic Market Size Estimates and Forecasts to 2032 (USD Billion)
7.7 Elastomeric Foam
7.7.1 Elastomeric Foam Market Trends Analysis (2020-2032)
7.7.2 Elastomeric Foam Market Size Estimates and Forecasts to 2032 (USD Billion)
7.8 Others
7.8.1 Others Market Trends Analysis (2020-2032)
7.8.2 Others Market Size Estimates and Forecasts to 2032 (USD Billion)
8. OEM Insulation Market Segmentation, by Application
8.1 Chapter Overview
8.2 Thermal Insulation
8.2.1 Thermal Insulation Market Trends Analysis (2020-2032)
8.2.2 Thermal Insulation Market Size Estimates and Forecasts to 2032 (USD Billion)
8.3 Acoustic Insulation
8.3.1 Acoustic Insulation Market Trends Analysis (2020-2032)
8.3.2 Acoustic Insulation Market Size Estimates and Forecasts to 2032 (USD Billion)
8.4 Electrical Insulation
8.4.1 Electrical Insulation Market Trends Analysis (2020-2032)
8.4.2 Electrical Insulation Market Size Estimates and Forecasts to 2032 (USD Billion)
8.5 Others
8.5.1 Others Market Trends Analysis (2020-2032)
8.5.2 Others Market Size Estimates and Forecasts to 2032 (USD Billion)
9. OEM Insulation Market Segmentation, by End-use Industry
9.1 Chapter Overview
9.2 Aerospace
9.2.1 Aerospace Market Trends Analysis (2020-2032)
9.2.2 Aerospace Market Size Estimates and Forecasts to 2032 (USD Billion)
9.3 Automotive
9.3.1 Automotive Market Trends Analysis (2020-2032)
9.3.2 Automotive Market Size Estimates and Forecasts to 2032 (USD Billion)
9.4 Marine
9.4.1 Marine Market Trends Analysis (2020-2032)
9.4.2 Marine Market Size Estimates and Forecasts to 2032 (USD Billion)
9.5 Building and Construction
9.5.1 Building and Construction Market Trends Analysis (2020-2032)
9.5.2 Building and Construction Market Size Estimates and Forecasts to 2032 (USD Billion)
9.6 Consumer Appliances
9.6.1 Consumer Appliances Market Trends Analysis (2020-2032)
9.6.2 Consumer Appliances Market Size Estimates and Forecasts to 2032 (USD Billion)
9.7 Others
9.7.1 Others Market Trends Analysis (2020-2032)
9.7.2 Others Market Size Estimates and Forecasts to 2032 (USD Billion)
10. Regional Analysis
10.1 Chapter Overview
10.2 North America
10.2.1 Trends Analysis
10.2.2 North America OEM Insulation Market Estimates and Forecasts, by Country (2020-2032) (USD Billion)
10.2.3 North America OEM Insulation Market Estimates and Forecasts, by Material (2020-2032) (USD Billion)
10.2.4 North America OEM Insulation Market Estimates and Forecasts, by Application (2020-2032) (USD Billion)
10.2.5 North America OEM Insulation Market Estimates and Forecasts, by End-use Industry (2020-2032) (USD Billion)
10.2.6 USA
10.2.6.1 USA OEM Insulation Market Estimates and Forecasts, by Material (2020-2032) (USD Billion)
10.2.6.2 USA OEM Insulation Market Estimates and Forecasts, by Application (2020-2032) (USD Billion)
10.2.6.3 USA OEM Insulation Market Estimates and Forecasts, by End-use Industry (2020-2032) (USD Billion)
10.2.7 Canada
10.2.7.1 Canada OEM Insulation Market Estimates and Forecasts, by Material (2020-2032) (USD Billion)
10.2.7.2 Canada OEM Insulation Market Estimates and Forecasts, by Application (2020-2032) (USD Billion)
10.2.7.3 Canada OEM Insulation Market Estimates and Forecasts, by End-use Industry (2020-2032) (USD Billion)
10.2.8 Mexico
10.2.8.1 Mexico OEM Insulation Market Estimates and Forecasts, by Material (2020-2032) (USD Billion)
10.2.8.2 Mexico OEM Insulation Market Estimates and Forecasts, by Application (2020-2032) (USD Billion)
10.2.8.3 Mexico OEM Insulation Market Estimates and Forecasts, by End-use Industry (2020-2032) (USD Billion)
10.3 Europe
10.3.1 Eastern Europe
10.3.1.1 Trends Analysis
10.3.1.2 Eastern Europe OEM Insulation Market Estimates and Forecasts, by Country (2020-2032) (USD Billion)
10.3.1.3 Eastern Europe OEM Insulation Market Estimates and Forecasts, by Material (2020-2032) (USD Billion)
10.3.1.4 Eastern Europe OEM Insulation Market Estimates and Forecasts, by Application (2020-2032) (USD Billion)
10.3.1.5 Eastern Europe OEM Insulation Market Estimates and Forecasts, by End-use Industry (2020-2032) (USD Billion)
10.3.1.6 Poland
10.3.1.6.1 Poland OEM Insulation Market Estimates and Forecasts, by Material (2020-2032) (USD Billion)
10.3.1.6.2 Poland OEM Insulation Market Estimates and Forecasts, by Application (2020-2032) (USD Billion)
10.3.1.6.3 Poland OEM Insulation Market Estimates and Forecasts, by End-use Industry (2020-2032) (USD Billion)
10.3.1.7 Romania
10.3.1.7.1 Romania OEM Insulation Market Estimates and Forecasts, by Material (2020-2032) (USD Billion)
10.3.1.7.2 Romania OEM Insulation Market Estimates and Forecasts, by Application (2020-2032) (USD Billion)
10.3.1.7.3 Romania OEM Insulation Market Estimates and Forecasts, by End-use Industry (2020-2032) (USD Billion)
10.3.1.8 Hungary
10.3.1.8.1 Hungary OEM Insulation Market Estimates and Forecasts, by Material (2020-2032) (USD Billion)
10.3.1.8.2 Hungary OEM Insulation Market Estimates and Forecasts, by Application (2020-2032) (USD Billion)
10.3.1.8.3 Hungary OEM Insulation Market Estimates and Forecasts, by End-use Industry (2020-2032) (USD Billion)
10.3.1.9 Turkey
10.3.1.9.1 Turkey OEM Insulation Market Estimates and Forecasts, by Material (2020-2032) (USD Billion)
10.3.1.9.2 Turkey OEM Insulation Market Estimates and Forecasts, by Application (2020-2032) (USD Billion)
10.3.1.9.3 Turkey OEM Insulation Market Estimates and Forecasts, by End-use Industry (2020-2032) (USD Billion)
10.3.1.10 Rest of Eastern Europe
10.3.1.10.1 Rest of Eastern Europe OEM Insulation Market Estimates and Forecasts, by Material (2020-2032) (USD Billion)
10.3.1.10.2 Rest of Eastern Europe OEM Insulation Market Estimates and Forecasts, by Application (2020-2032) (USD Billion)
10.3.1.10.3 Rest of Eastern Europe OEM Insulation Market Estimates and Forecasts, by End-use Industry (2020-2032) (USD Billion)
10.3.2 Western Europe
10.3.2.1 Trends Analysis
10.3.2.2 Western Europe OEM Insulation Market Estimates and Forecasts, by Country (2020-2032) (USD Billion)
10.3.2.3 Western Europe OEM Insulation Market Estimates and Forecasts, by Material (2020-2032) (USD Billion)
10.3.2.4 Western Europe OEM Insulation Market Estimates and Forecasts, by Application (2020-2032) (USD Billion)
10.3.2.5 Western Europe OEM Insulation Market Estimates and Forecasts, by End-use Industry (2020-2032) (USD Billion)
10.3.2.6 Germany
10.3.2.6.1 Germany OEM Insulation Market Estimates and Forecasts, by Material (2020-2032) (USD Billion)
10.3.2.6.2 Germany OEM Insulation Market Estimates and Forecasts, by Application (2020-2032) (USD Billion)
10.3.2.6.3 Germany OEM Insulation Market Estimates and Forecasts, by End-use Industry (2020-2032) (USD Billion)
10.3.2.7 France
10.3.2.7.1 France OEM Insulation Market Estimates and Forecasts, by Material (2020-2032) (USD Billion)
10.3.2.7.2 France OEM Insulation Market Estimates and Forecasts, by Application (2020-2032) (USD Billion)
10.3.2.7.3 France OEM Insulation Market Estimates and Forecasts, by End-use Industry (2020-2032) (USD Billion)
10.3.2.8 UK
10.3.2.8.1 UK OEM Insulation Market Estimates and Forecasts, by Material (2020-2032) (USD Billion)
10.3.2.8.2 UK OEM Insulation Market Estimates and Forecasts, by Application (2020-2032) (USD Billion)
10.3.2.8.3 UK OEM Insulation Market Estimates and Forecasts, by End-use Industry (2020-2032) (USD Billion)
10.3.2.9 Italy
10.3.2.9.1 Italy OEM Insulation Market Estimates and Forecasts, by Material (2020-2032) (USD Billion)
10.3.2.9.2 Italy OEM Insulation Market Estimates and Forecasts, by Application (2020-2032) (USD Billion)
10.3.2.9.3 Italy OEM Insulation Market Estimates and Forecasts, by End-use Industry (2020-2032) (USD Billion)
10.3.2.10 Spain
10.3.2.10.1 Spain OEM Insulation Market Estimates and Forecasts, by Material (2020-2032) (USD Billion)
10.3.2.10.2 Spain OEM Insulation Market Estimates and Forecasts, by Application (2020-2032) (USD Billion)
10.3.2.10.3 Spain OEM Insulation Market Estimates and Forecasts, by End-use Industry (2020-2032) (USD Billion)
10.3.2.11 Netherlands
10.3.2.11.1 Netherlands OEM Insulation Market Estimates and Forecasts, by Material (2020-2032) (USD Billion)
10.3.2.11.2 Netherlands OEM Insulation Market Estimates and Forecasts, by Application (2020-2032) (USD Billion)
10.3.2.11.3 Netherlands OEM Insulation Market Estimates and Forecasts, by End-use Industry (2020-2032) (USD Billion)
10.3.2.12 Switzerland
10.3.2.12.1 Switzerland OEM Insulation Market Estimates and Forecasts, by Material (2020-2032) (USD Billion)
10.3.2.12.2 Switzerland OEM Insulation Market Estimates and Forecasts, by Application (2020-2032) (USD Billion)
10.3.2.12.3 Switzerland OEM Insulation Market Estimates and Forecasts, by End-use Industry (2020-2032) (USD Billion)
10.3.2.13 Austria
10.3.2.13.1 Austria OEM Insulation Market Estimates and Forecasts, by Material (2020-2032) (USD Billion)
10.3.2.13.2 Austria OEM Insulation Market Estimates and Forecasts, by Application (2020-2032) (USD Billion)
10.3.2.13.3 Austria OEM Insulation Market Estimates and Forecasts, by End-use Industry (2020-2032) (USD Billion)
10.3.2.14 Rest of Western Europe
10.3.2.14.1 Rest of Western Europe OEM Insulation Market Estimates and Forecasts, by Material (2020-2032) (USD Billion)
10.3.2.14.2 Rest of Western Europe OEM Insulation Market Estimates and Forecasts, by Application (2020-2032) (USD Billion)
10.3.2.14.3 Rest of Western Europe OEM Insulation Market Estimates and Forecasts, by End-use Industry (2020-2032) (USD Billion)
10.4 Asia Pacific
10.4.1 Trends Analysis
10.4.2 Asia Pacific OEM Insulation Market Estimates and Forecasts, by Country (2020-2032) (USD Billion)
10.4.3 Asia Pacific OEM Insulation Market Estimates and Forecasts, by Material (2020-2032) (USD Billion)
10.4.4 Asia Pacific OEM Insulation Market Estimates and Forecasts, by Application (2020-2032) (USD Billion)
10.4.5 Asia Pacific OEM Insulation Market Estimates and Forecasts, by End-use Industry (2020-2032) (USD Billion)
10.4.6 China
10.4.6.1 China OEM Insulation Market Estimates and Forecasts, by Material (2020-2032) (USD Billion)
10.4.6.2 China OEM Insulation Market Estimates and Forecasts, by Application (2020-2032) (USD Billion)
10.4.6.3 China OEM Insulation Market Estimates and Forecasts, by End-use Industry (2020-2032) (USD Billion)
10.4.7 India
10.4.7.1 India OEM Insulation Market Estimates and Forecasts, by Material (2020-2032) (USD Billion)
10.4.7.2 India OEM Insulation Market Estimates and Forecasts, by Application (2020-2032) (USD Billion)
10.4.7.3 India OEM Insulation Market Estimates and Forecasts, by End-use Industry (2020-2032) (USD Billion)
10.4.8 Japan
10.4.8.1 Japan OEM Insulation Market Estimates and Forecasts, by Material (2020-2032) (USD Billion)
10.4.8.2 Japan OEM Insulation Market Estimates and Forecasts, by Application (2020-2032) (USD Billion)
10.4.8.3 Japan OEM Insulation Market Estimates and Forecasts, by End-use Industry (2020-2032) (USD Billion)
10.4.9 South Korea
10.4.9.1 South Korea OEM Insulation Market Estimates and Forecasts, by Material (2020-2032) (USD Billion)
10.4.9.2 South Korea OEM Insulation Market Estimates and Forecasts, by Application (2020-2032) (USD Billion)
10.4.9.3 South Korea OEM Insulation Market Estimates and Forecasts, by End-use Industry (2020-2032) (USD Billion)
10.4.10 Vietnam
10.4.10.1 Vietnam OEM Insulation Market Estimates and Forecasts, by Material (2020-2032) (USD Billion)
10.4.10.2 Vietnam OEM Insulation Market Estimates and Forecasts, by Application (2020-2032) (USD Billion)
10.4.10.3 Vietnam OEM Insulation Market Estimates and Forecasts, by End-use Industry (2020-2032) (USD Billion)
10.4.11 Singapore
10.4.11.1 Singapore OEM Insulation Market Estimates and Forecasts, by Material (2020-2032) (USD Billion)
10.4.11.2 Singapore OEM Insulation Market Estimates and Forecasts, by Application (2020-2032) (USD Billion)
10.4.11.3 Singapore OEM Insulation Market Estimates and Forecasts, by End-use Industry (2020-2032) (USD Billion)
10.4.12 Australia
10.4.12.1 Australia OEM Insulation Market Estimates and Forecasts, by Material (2020-2032) (USD Billion)
10.4.12.2 Australia OEM Insulation Market Estimates and Forecasts, by Application (2020-2032) (USD Billion)
10.4.12.3 Australia OEM Insulation Market Estimates and Forecasts, by End-use Industry (2020-2032) (USD Billion)
10.4.13 Rest of Asia Pacific
10.4.13.1 Rest of Asia Pacific OEM Insulation Market Estimates and Forecasts, by Material (2020-2032) (USD Billion)
10.4.13.2 Rest of Asia Pacific OEM Insulation Market Estimates and Forecasts, by Application (2020-2032) (USD Billion)
10.4.13.3 Rest of Asia Pacific OEM Insulation Market Estimates and Forecasts, by End-use Industry (2020-2032) (USD Billion)
10.5 Middle East and Africa
10.5.1 Middle East
10.5.1.1 Trends Analysis
10.5.1.2 Middle East OEM Insulation Market Estimates and Forecasts, by Country (2020-2032) (USD Billion)
10.5.1.3 Middle East OEM Insulation Market Estimates and Forecasts, by Material (2020-2032) (USD Billion)
10.5.1.4 Middle East OEM Insulation Market Estimates and Forecasts, by Application (2020-2032) (USD Billion)
10.5.1.5 Middle East OEM Insulation Market Estimates and Forecasts, by End-use Industry (2020-2032) (USD Billion)
10.5.1.6 UAE
10.5.1.6.1 UAE OEM Insulation Market Estimates and Forecasts, by Material (2020-2032) (USD Billion)
10.5.1.6.2 UAE OEM Insulation Market Estimates and Forecasts, by Application (2020-2032) (USD Billion)
10.5.1.6.3 UAE OEM Insulation Market Estimates and Forecasts, by End-use Industry (2020-2032) (USD Billion)
10.5.1.7 Egypt
10.5.1.7.1 Egypt OEM Insulation Market Estimates and Forecasts, by Material (2020-2032) (USD Billion)
10.5.1.7.2 Egypt OEM Insulation Market Estimates and Forecasts, by Application (2020-2032) (USD Billion)
10.5.1.7.3 Egypt OEM Insulation Market Estimates and Forecasts, by End-use Industry (2020-2032) (USD Billion)
10.5.1.8 Saudi Arabia
10.5.1.8.1 Saudi Arabia OEM Insulation Market Estimates and Forecasts, by Material (2020-2032) (USD Billion)
10.5.1.8.2 Saudi Arabia OEM Insulation Market Estimates and Forecasts, by Application (2020-2032) (USD Billion)
10.5.1.8.3 Saudi Arabia OEM Insulation Market Estimates and Forecasts, by End-use Industry (2020-2032) (USD Billion)
10.5.1.9 Qatar
10.5.1.9.1 Qatar OEM Insulation Market Estimates and Forecasts, by Material (2020-2032) (USD Billion)
10.5.1.9.2 Qatar OEM Insulation Market Estimates and Forecasts, by Application (2020-2032) (USD Billion)
10.5.1.9.3 Qatar OEM Insulation Market Estimates and Forecasts, by End-use Industry (2020-2032) (USD Billion)
10.5.1.10 Rest of Middle East
10.5.1.10.1 Rest of Middle East OEM Insulation Market Estimates and Forecasts, by Material (2020-2032) (USD Billion)
10.5.1.10.2 Rest of Middle East OEM Insulation Market Estimates and Forecasts, by Application (2020-2032) (USD Billion)
10.5.1.10.3 Rest of Middle East OEM Insulation Market Estimates and Forecasts, by End-use Industry (2020-2032) (USD Billion)
10.5.2 Africa
10.5.2.1 Trends Analysis
10.5.2.2 Africa OEM Insulation Market Estimates and Forecasts, by Country (2020-2032) (USD Billion)
10.5.2.3 Africa OEM Insulation Market Estimates and Forecasts, by Material (2020-2032) (USD Billion)
10.5.2.4 Africa OEM Insulation Market Estimates and Forecasts, by Application (2020-2032) (USD Billion)
10.5.2.5 Africa OEM Insulation Market Estimates and Forecasts, by End-use Industry (2020-2032) (USD Billion)
10.5.2.6 South Africa
10.5.2.6.1 South Africa OEM Insulation Market Estimates and Forecasts, by Material (2020-2032) (USD Billion)
10.5.2.6.2 South Africa OEM Insulation Market Estimates and Forecasts, by Application (2020-2032) (USD Billion)
10.5.2.6.3 South Africa OEM Insulation Market Estimates and Forecasts, by End-use Industry (2020-2032) (USD Billion)
10.5.2.7 Nigeria
10.5.2.7.1 Nigeria OEM Insulation Market Estimates and Forecasts, by Material (2020-2032) (USD Billion)
10.5.2.7.2 Nigeria OEM Insulation Market Estimates and Forecasts, by Application (2020-2032) (USD Billion)
10.5.2.7.3 Nigeria OEM Insulation Market Estimates and Forecasts, by End-use Industry (2020-2032) (USD Billion)
10.5.2.8 Rest of Africa
10.5.2.8.1 Rest of Africa OEM Insulation Market Estimates and Forecasts, by Material (2020-2032) (USD Billion)
10.5.2.8.2 Rest of Africa OEM Insulation Market Estimates and Forecasts, by Application (2020-2032) (USD Billion)
10.5.2.8.3 Rest of Africa OEM Insulation Market Estimates and Forecasts, by End-use Industry (2020-2032) (USD Billion)
10.6 Latin America
10.6.1 Trends Analysis
10.6.2 Latin America OEM Insulation Market Estimates and Forecasts, by Country (2020-2032) (USD Billion)
10.6.3 Latin America OEM Insulation Market Estimates and Forecasts, by Material (2020-2032) (USD Billion)
10.6.4 Latin America OEM Insulation Market Estimates and Forecasts, by Application (2020-2032) (USD Billion)
10.6.5 Latin America OEM Insulation Market Estimates and Forecasts, by End-use Industry (2020-2032) (USD Billion)
10.6.6 Brazil
10.6.6.1 Brazil OEM Insulation Market Estimates and Forecasts, by Material (2020-2032) (USD Billion)
10.6.6.2 Brazil OEM Insulation Market Estimates and Forecasts, by Application (2020-2032) (USD Billion)
10.6.6.3 Brazil OEM Insulation Market Estimates and Forecasts, by End-use Industry (2020-2032) (USD Billion)
10.6.7 Argentina
10.6.7.1 Argentina OEM Insulation Market Estimates and Forecasts, by Material (2020-2032) (USD Billion)
10.6.7.2 Argentina OEM Insulation Market Estimates and Forecasts, by Application (2020-2032) (USD Billion)
10.6.7.3 Argentina OEM Insulation Market Estimates and Forecasts, by End-use Industry (2020-2032) (USD Billion)
10.6.8 Colombia
10.6.8.1 Colombia OEM Insulation Market Estimates and Forecasts, by Material (2020-2032) (USD Billion)
10.6.8.2 Colombia OEM Insulation Market Estimates and Forecasts, by Application (2020-2032) (USD Billion)
10.6.8.3 Colombia OEM Insulation Market Estimates and Forecasts, by End-use Industry (2020-2032) (USD Billion)
10.6.9 Rest of Latin America
10.6.9.1 Rest of Latin America OEM Insulation Market Estimates and Forecasts, by Material (2020-2032) (USD Billion)
10.6.9.2 Rest of Latin America OEM Insulation Market Estimates and Forecasts, by Application (2020-2032) (USD Billion)
10.6.9.3 Rest of Latin America OEM Insulation Market Estimates and Forecasts, by End-use Industry (2020-2032) (USD Billion)
11. Company Profiles
11.1 Owens Corning
11.1.1 Company Overview
11.1.2 Financial
11.1.3 Products/ Services Offered
11.1.4 SWOT Analysis
11.2 Rockwool A/S
11.2.1 Company Overview
11.2.2 Financial
11.2.3 Products/ Services Offered
11.2.4 SWOT Analysis
11.3 Covestro AG
11.3.1 Company Overview
11.3.2 Financial
11.3.3 Products/ Services Offered
11.3.4 SWOT Analysis
11.4 Armacell
11.4.1 Company Overview
11.4.2 Financial
11.4.3 Products/ Services Offered
11.4.4 SWOT Analysis
11.5 Huntsman Corporation
11.5.1 Company Overview
11.5.2 Financial
11.5.3 Products/ Services Offered
11.5.4 SWOT Analysis
11.6 Saint-Gobain ISOVER
11.6.1 Company Overview
11.6.2 Financial
11.6.3 Products/ Services Offered
11.6.4 SWOT Analysis
11.7 Rogers Corporation
11.7.1 Company Overview
11.7.2 Financial
11.7.3 Products/ Services Offered
11.7.4 SWOT Analysis
11.8 Recticel Group
11.8.1 Company Overview
11.8.2 Financial
11.8.3 Products/ Services Offered
11.8.4 SWOT Analysis
11.9 Aspen Aerogels Inc
11.9.1 Company Overview
11.9.2 Financial
11.9.3 Products/ Services Offered
11.9.4 SWOT Analysis
11.10 Morgan Advanced Materials PLC
11.10.1 Company Overview
11.10.2 Financial
11.10.3 Products/ Services Offered
11.10.4 SWOT Analysis
12. Use Cases and Best Practices
13. Conclusion
An accurate research report requires proper strategizing as well as implementation. There are multiple factors involved in the completion of good and accurate research report and selecting the best methodology to compete the research is the toughest part. Since the research reports we provide play a crucial role in any company’s decision-making process, therefore we at SNS Insider always believe that we should choose the best method which gives us results closer to reality. This allows us to reach at a stage wherein we can provide our clients best and accurate investment to output ratio.
Each report that we prepare takes a timeframe of 350-400 business hours for production. Starting from the selection of titles through a couple of in-depth brain storming session to the final QC process before uploading our titles on our website we dedicate around 350 working hours. The titles are selected based on their current market cap and the foreseen CAGR and growth.
The 5 steps process:
Step 1: Secondary Research:
Secondary Research or Desk Research is as the name suggests is a research process wherein, we collect data through the readily available information. In this process we use various paid and unpaid databases which our team has access to and gather data through the same. This includes examining of listed companies’ annual reports, Journals, SEC filling etc. Apart from this our team has access to various associations across the globe across different industries. Lastly, we have exchange relationships with various university as well as individual libraries.

Step 2: Primary Research
When we talk about primary research, it is a type of study in which the researchers collect relevant data samples directly, rather than relying on previously collected data. This type of research is focused on gaining content specific facts that can be sued to solve specific problems. Since the collected data is fresh and first hand therefore it makes the study more accurate and genuine.
We at SNS Insider have divided Primary Research into 2 parts.
Part 1 wherein we interview the KOLs of major players as well as the upcoming ones across various geographic regions. This allows us to have their view over the market scenario and acts as an important tool to come closer to the accurate market numbers. As many as 45 paid and unpaid primary interviews are taken from both the demand and supply side of the industry to make sure we land at an accurate judgement and analysis of the market.
This step involves the triangulation of data wherein our team analyses the interview transcripts, online survey responses and observation of on filed participants. The below mentioned chart should give a better understanding of the part 1 of the primary interview.

Part 2: In this part of primary research the data collected via secondary research and the part 1 of the primary research is validated with the interviews from individual consultants and subject matter experts.
Consultants are those set of people who have at least 12 years of experience and expertise within the industry whereas Subject Matter Experts are those with at least 15 years of experience behind their back within the same space. The data with the help of two main processes i.e., FGDs (Focused Group Discussions) and IDs (Individual Discussions). This gives us a 3rd party nonbiased primary view of the market scenario making it a more dependable one while collation of the data pointers.
Step 3: Data Bank Validation
Once all the information is collected via primary and secondary sources, we run that information for data validation. At our intelligence centre our research heads track a lot of information related to the market which includes the quarterly reports, the daily stock prices, and other relevant information. Our data bank server gets updated every fortnight and that is how the information which we collected using our primary and secondary information is revalidated in real time.

Step 4: QA/QC Process
After all the data collection and validation our team does a final level of quality check and quality assurance to get rid of any unwanted or undesired mistakes. This might include but not limited to getting rid of the any typos, duplication of numbers or missing of any important information. The people involved in this process include technical content writers, research heads and graphics people. Once this process is completed the title gets uploader on our platform for our clients to read it.
Step 5: Final QC/QA Process:
This is the last process and comes when the client has ordered the study. In this process a final QA/QC is done before the study is emailed to the client. Since we believe in giving our clients a good experience of our research studies, therefore, to make sure that we do not lack at our end in any way humanly possible we do a final round of quality check and then dispatch the study to the client.
Key Segments:
By Material
Glass Wool
Mineral Wool
Reflective Insulation
Ceramic Insulation
Foamed Plastic
Elastomeric Foam
Others
By Application
Thermal Insulation
Acoustic Insulation
Electrical Insulation
Others
By End-use Industry
Aerospace
Automotive
Marine
Building and Construction
Consumer Appliances
Others
Request for Segment Customization as per your Business Requirement: Segment Customization Request
Regional Coverage:
North America
US
Canada
Mexico
Europe
Eastern Europe
Poland
Romania
Hungary
Turkey
Rest of Eastern Europe
Western Europe
Germany
France
UK
Italy
Spain
Netherlands
Switzerland
Austria
Rest of Western Europe
Asia Pacific
China
India
Japan
South Korea
Vietnam
Singapore
Australia
Rest of Asia Pacific
Middle East & Africa
Middle East
UAE
Egypt
Saudi Arabia
Qatar
Rest of Middle East
Africa
Nigeria
South Africa
Rest of Africa
Latin America
Brazil
Argentina
Colombia
Rest of Latin America
Request for Country Level Research Report: Country Level Customization Request
Available Customization
With the given market data, SNS Insider offers customization as per the company’s specific needs. The following customization options are available for the report:
Detailed Volume Analysis
Criss-Cross segment analysis (e.g. Product X Application)
Competitive Product Benchmarking
Geographic Analysis
Additional countries in any of the regions
Customized Data Representation
Detailed analysis and profiling of additional market players
Synthetic Fibers Market is anticipated to reach from USD 70.5 billion in 2023 to USD 117.7 billion by 2032 and growing at a CAGR of 5.9% from 2024 to 2032.
The Bio Solvents Market Size was USD 4.0 Billion in 2023. It is expected to grow to USD 5.7 Billion by 2032 and grow at a CAGR of 4.01% by 2024-2032.
The Algae Biofuel Market Size was valued at USD 9.08 billion in 2023 and is expected to reach USD 18.66 billion by 2032 and grow at a CAGR of 9.58% over the forecast period 2024-2032.
The Palm Oil Market Size was valued at USD 70.4 billion in 2023 and is expected to reach USD 106.5 billion by 2032, at a CAGR of 4.7% from 2024-2032.
Enzyme Substrates Market Size was valued at USD 14.3 Billion in 2023 and is expected to reach USD 26.1 Billion by 2032 and grow at a CAGR of 6.9% over the forecast period 2024-2032.
The Oxalic Acid Market size was valued at USD 962 million in 2023. It is estimated to hit USD 1475.97 million by 2032 and grow at a CAGR of 4.87% over the forecast period of 2024-2032.

Hi! Click one of our member below to chat on Phone
© 2025 All Rights Reserved by SNS Insider Pvt Ltd


