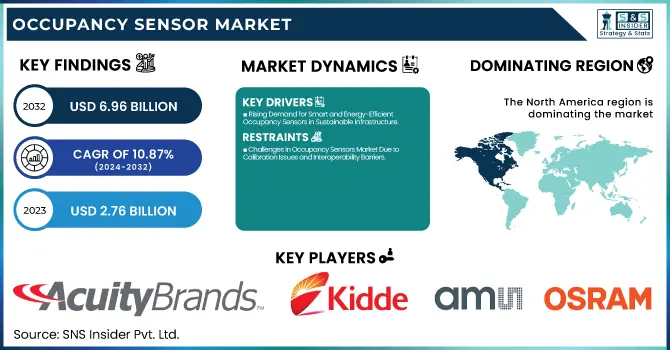
The Occupancy Sensor Market Size was valued at USD 2.76 billion in 2023 and is expected to reach USD 6.96 billion by 2032, growing at a CAGR of 10.87% over the forecast period 2024-2032. Technological evolution continues to influence the occupancy sensor market, promising enhanced performance such as increased accuracy, fast response, and AI-based adaptive sensing capabilities as compared to previous generations. Innovation is in multi-sensor integration (thermal imaging, radar), machine learning, and precision.
To Get more information on Occupancy Sensor Market - Request Free Sample Report
Sensors are used in smart buildings that generally focus on automatic lighting, HVAC optimization, and security systems that enable energy efficiency. Seamless connectivity using Zigbee, Wi-Fi, Bluetooth, and LoRaWAN is expanding the ecosystem of sensors and their integration with IoT for real-time data analytics. All of these efforts catalyze integrated occupancy sensor adoption in residential, commercial, and industrial infrastructures, integrating automation with energy management.
Key Drivers:
Rising Demand for Smart and Energy-Efficient Occupancy Sensors in Sustainable Infrastructure
Increasing focus on energy efficiency and smart building solutions are driving the occupancy sensor market. With governments across the globe tightening the noose around energy conservation laws, forces are pushing several other industries and commercial environments into the matrix of advanced occupancy sensors for both lighting and HVAC control. The increasing popularity of smart homes that are connected to IoT and automated elements of the home has been pushing the market forward. Emerging technologies such as Ethernet-like motion detection driven by AI, ensuring the sensor's accuracy, and wireless sensor networks enhancing the responsiveness of sensors render them appealing for commercial, residential, and industrial applications. Moreover, this surge growth of occupancy sensors in different sectors is also fueled by the trend of green buildings and sustainable infrastructure development.
Restrain:
Challenges in Occupancy Sensors Market Due to Calibration Issues and Interoperability Barriers
The calibration of sensors and the issue with accuracy is one of the major restraints for the market of occupancy sensors at present. False triggering because of airflow, temperature changes, or a pet moving can cause inefficiencies in controlling Lighting or HVAC. Others such as Passive Infrared (PIR) need an unobstructed line of sight; therefore, their efficiency is compromised in places where obstacles or partitions exist. Improving accuracy through integrated sensors, including dual-technology sensors (such as PIR and ultrasonic), increases system complexity and presents maintenance issues. Interoperability issues also arise, as different manufacturers may use their proprietary protocols, which can make it challenging to integrate occupancy sensors with an existing smart home or building automation system.
Opportunity:
Expanding IoT Integration and Smart City Development Unlock Growth Opportunities for Occupancy Sensors
The growing adoption of sensor integration with IoT and AI technologies, which built the ground to provide predictive analytics and real-time energy management capabilities, provides opportunities for occupancy sensor manufacturers in the coming years. The increase in the share of wireless and battery-powered sensors provides scalable, easier-to-install (especially for retrofit projects) systems. Emerging economies offer high growth potential on account of the rising urban population and smart city development plans. Furthermore, the growing security and surveillance systems demand for occupancy sensors, as there is an increasing requirement for safety solutions in commercial and residential buildings here by this market is estimated to create lucrative opportunities for the growth of the occupancy sensors market. Ongoing R&D and innovations in sensor accuracy and multi-technology integration will open up further new market opportunities.
Challenges:
Lack of Awareness and Technical Barriers Hinder Occupancy Sensor Adoption in Developing Regions
Awareness and standardization in developing regions is another important restraint. Adoption, according to one industry source, is slow, as many businesses and residential users are unaware of the benefits of occupancy sensors. Another limitation is the technical sophistication required to install and place sensors properly a significant hurdle in parts of the world where skilled labor is not readily available. This dependency on stable connectivity creates challenges, particularly for wireless sensors that need an adequate network infrastructure. To maintain market growth these issues will need to be addressed through greater education, efforts towards standardization, and improved self-learning sensor technology.
By Type
The passive infrared (PIR) sensors held the largest revenue share of over 44.1% in 2023 & are anticipated to grow at the fastest CAGR over the forecast period from 2024 to 2032. A large part of this growth can be attributed to the increasing demand for energy-efficient solutions in smart home, commercial, and industrial applications. Passive Infrared (PIR) sensors are the most popular ones because of their low cost, low power consumption, and high reliability. The market adoption is further propelled by the growing government regulations to stimulate energy conservation as well as initiatives related to the growth of smart infrastructure. Moreover, AI-powered motion detection and IoT integration are also improving the efficiency of the sensor technology and contributing to the future growth of the sensor technology.
By Connectivity
The market share of wired occupancy sensors accounted for 57.2% in 2023, owing to their reliability, stable connectivity, and extensive use in commercial and industrial applications. Ideal in areas with consistent performance and secondary signals such as office buildings, manufacturing facility, and Internet scale infrastructure.
The fastest growth rate (CAGR) from 2024 to 2032 is anticipated for wireless occupancy sensors owing to increasing emphasis on smart buildings and automation under the IoT paradigm. Due to their simplicity, scalability, and flexibility, buildings can add them easily to existing structures, which maximizes energy use.
By Application
Lighting Control accounted for the highest market share of 41.6% in 2023 and will retain its dominance by growing at the fastest CAGR from 2024 to 2032. The rising adoption of energy-saving smart lighting solutions in smart homes, commercial buildings, and industrial plants is a major factor fueling market expansion. Adoption is also spurred by government regulations promoting energy conservation and sustainability. From IoT-enabled lighting systems to AI-based automation, features to improve efficiency and user convenience blended seamlessly into the ecosystem. Apart from this, increasing awareness regarding minimizing energy usage and operational costs is propelling organizations and households to collaborate occupancy sensors with lighting control systems, which will act as a major growth contributor for the market during the forecast period.
By End Use
The market share was dominated by the commercial sector with 38.9% in 2023 owing to the widespread adoption of occupancy sensors in office buildings, shopping malls, hotels, and smarter commercial spaces. The rising focus on energy efficiency, saving money, and complying with the government has pushed the market for automated lighting, HVAC (heating, ventilation, and air conditioning) control, and security systems in commercial buildings.
From 2024 to 2032, the fastest growing sector in terms of CAGR will be the industrial sector, as industries continue to focus more on automation, workplace safety, and energy management. Demand for occupancy-wise smart sensors is following the trend of rising uptake in warehouses, manufacturing plants, and logistics settings.
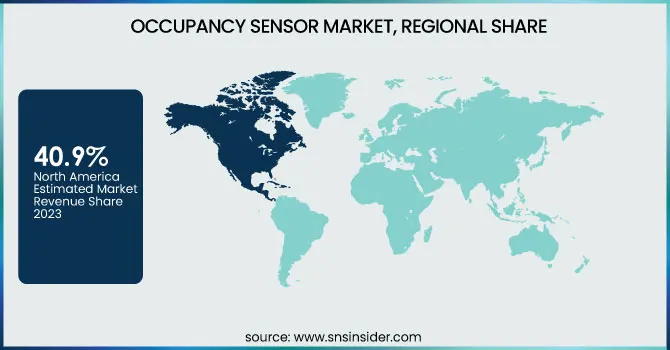
North America held the largest market share of 40.9% in the year 2023. North America is expected to continue its dominance due to stringent energy efficiency standards, rapid adoption of smart building solutions, and increasing investments in commercial infrastructure. Tighter building codes have been enforced over the years in the U.S. and Canada, notably Title 24 in California and the U.S. Department of Energy (DOE) initiatives that have advanced the push for the use of occupancy sensors to save energy. For instance, some of the largest smart office projects from companies like Google and Microsoft, deploy occupancy sensors as key components to gain insights and control over lighting and HVAC systems. Moreover, smart home adoption is growing in the region, with automated sensor solutions from companies such as Lutron and Leviton.
Asia Pacific is estimated to record the highest CAGR during the forecast period from 2024 to 2032, primarily owing to rapid urbanization, rising smart city initiatives, and increased awareness regarding energy efficiency. Heavy investments in smart infrastructure in China, India, and Japan, supported by government initiatives (e.g. India’s Smart Cities Mission) driving the adoption of sensors. One of the better-known instances is in Singapore's smart building projects, where occupancy sensors are integrated into large developments in places like Marina Bay Sands for automated energy management. Likewise, the smart home ecosystem by Chinese tech giants such as Xiaomi and Huawei and home safety needs are reinforcing demand for occupancy sensors.
Get Customized Report as per Your Business Requirement - Enquiry Now
Some of the major players in the Occupancy Sensor Market are:
Acuity Brands (Sensor Switch nLight Occupancy Sensor)
Kidde (Kidde Wireless Smoke and Carbon Monoxide Alarm)
AMS-Osram (OSRAM SFH 7776 Digital Proximity Sensor)
Pepperl+Fuchs (RPI Series Retroreflective Sensor)
System Sensor (System Sensor L-Series Ceiling-Mount Strobe)
EnOcean (EnOcean STM 550 Multi-Sensor Module)
Legrand (Wattstopper DW-311 Dual Technology Wall Switch Sensor)
Lutron Electronics (Lutron Maestro Occupancy Sensor Switch)
Schneider Electric (Schneider Electric C-Bus 360° Occupancy Sensor)
Honeywell (Honeywell IS335 Wired PIR Motion Detector)
Leviton (Leviton ODS10-ID Decora Wall Switch Occupancy Sensor)
Eaton (Eaton HALO RL5601 LED Downlight with Motion Sensor)
Siemens (Siemens RDG100T Room Thermostat with Occupancy Detection)
Panasonic (Panasonic EKMB1201111 Passive Infrared Motion Sensor)
Philips (Philips Hue Motion Sensor).
In January 2025, Kidde and Ring partnered to launch advanced smart smoke and CO alarms, offering real-time alerts via the Ring app.
In February 2024, Calumino and ams OSRAM partnered to develop next-gen thermal sensors by integrating the Mira050 CMOS sensor into Calumino's platform.
| Report Attributes | Details |
|---|---|
| Market Size in 2023 | USD 2.76 Billion |
| Market Size by 2032 | USD 6.96 Billion |
| CAGR | CAGR of 10.87% From 2024 to 2032 |
| Base Year | 2023 |
| Forecast Period | 2024-2032 |
| Historical Data | 2020-2022 |
| Report Scope & Coverage | Market Size, Segments Analysis, Competitive Landscape, Regional Analysis, DROC & SWOT Analysis, Forecast Outlook |
| Key Segments | • By Type (Passive Infrared Sensors, Ultrasonic Sensors, Dual Technology Sensors, Photoelectric Sensors) • By Connectivity (Wired, Wireless) • By Application (Lighting Control, HVAC Control, Security Systems, Energy Management) • By End Use (Residential, Commercial, Industrial, Institutional) |
| Regional Analysis/Coverage | North America (US, Canada, Mexico), Europe (Eastern Europe [Poland, Romania, Hungary, Turkey, Rest of Eastern Europe] Western Europe] Germany, France, UK, Italy, Spain, Netherlands, Switzerland, Austria, Rest of Western Europe]), Asia Pacific (China, India, Japan, South Korea, Vietnam, Singapore, Australia, Rest of Asia Pacific), Middle East & Africa (Middle East [UAE, Egypt, Saudi Arabia, Qatar, Rest of Middle East], Africa [Nigeria, South Africa, Rest of Africa], Latin America (Brazil, Argentina, Colombia, Rest of Latin America) |
| Company Profiles | Acuity Brands, Kidde, AMS-Osram, Pepperl+Fuchs, System Sensor, EnOcean, Legrand, Lutron Electronics, Schneider Electric, Honeywell, Leviton, Eaton, Siemens, Panasonic, Philips. |
Ans: The Occupancy Sensor Market is expected to grow at a CAGR of 10.87% during 2024-2032.
Ans: Occupancy Sensor Market size was USD 2.76 billion in 2023 and is expected to Reach USD 6.96 billion by 2032.
Ans: The major growth factor of the Occupancy Sensor Market is the increasing demand for energy-efficient smart building solutions, driven by strict government regulations, rising IoT adoption, and growing emphasis on sustainability.
Ans: The Lighting Control segment dominated the Occupancy Sensor Market in 2023.
Ans: North America dominated the Occupancy Sensor Market in 2023.
1. Introduction
1.1 Market Definition
1.2 Scope (Inclusion and Exclusions)
1.3 Research Assumptions
2. Executive Summary
2.1 Market Overview
2.2 Regional Synopsis
2.3 Competitive Summary
3. Research Methodology
3.1 Top-Down Approach
3.2 Bottom-up Approach
3.3. Data Validation
3.4 Primary Interviews
4. Market Dynamics Impact Analysis
4.1 Market Driving Factors Analysis
4.1.1 Drivers
4.1.2 Restraints
4.1.3 Opportunity
4.1.4 Challenges
4.2 PESTLE Analysis
4.3 Porter’s Five Forces Model
5. Statistical Insights and Trends Reporting
5.1 Technology & Performance Metrics
5.2 Product Innovation & Differentiation Metrics
5.3 Smart Building & Infrastructure Metrics
5.4 Sensor Ecosystem & Connectivity Metrics
6. Competitive Landscape
6.1 List of Major Companies, By Region
6.2 Market Share Analysis, By Region
6.3 Product Benchmarking
6.3.1 Product specifications and features
6.3.2 Pricing
6.4 Strategic Initiatives
6.4.1 Marketing and promotional activities
6.4.2 Distribution and Supply Chain Strategies
6.4.3 Expansion plans and new product launches
6.4.4 Strategic partnerships and collaborations
6.5 Technological Advancements
6.6 Market Positioning and Branding
7. Occupancy Sensor Market Segmentation, By Type
7.1 Chapter Overview
7.2 Passive Infrared Sensors
7.2.1 Passive Infrared Sensors Market Trends Analysis (2020-2032)
7.2.2 Passive Infrared Sensors Market Size Estimates and Forecasts to 2032 (USD Billion)
7.3 Ultrasonic Sensors
7.3.1 Ultrasonic Sensors Market Trends Analysis (2020-2032)
7.3.2 Ultrasonic Sensors Market Size Estimates and Forecasts to 2032 (USD Billion)
7.4 Dual Technology Sensors
7.4.1 Dual Technology Sensors Market Trends Analysis (2020-2032)
7.4.2 Dual Technology Sensors Market Size Estimates and Forecasts to 2032 (USD Billion)
7.5 Photoelectric Sensors
7.5.1 Photoelectric Sensors Market Trends Analysis (2020-2032)
7.5.2 Photoelectric Sensors Market Size Estimates and Forecasts to 2032 (USD Billion)
8. Occupancy Sensor Market Segmentation, By Connectivity
8.1 Chapter Overview
8.2 Wired
8.2.1 Wired Market Trends Analysis (2020-2032)
8.2.2 Wired Market Size Estimates and Forecasts to 2032 (USD Billion)
8.3 Wireless
8.3.1 Wireless Market Trends Analysis (2020-2032)
8.3.2 Wireless Market Size Estimates and Forecasts to 2032 (USD Billion)
9. Occupancy Sensor Market Segmentation, By Application
9.1 Chapter Overview
9.2 Lighting Control
9.2.1 Lighting Control Market Trends Analysis (2020-2032)
9.2.2 Lighting Control Market Size Estimates and Forecasts to 2032 (USD Billion)
9.3 HVAC Control
9.3.1 HVAC Control Market Trends Analysis (2020-2032)
9.3.2 HVAC Control Market Size Estimates and Forecasts to 2032 (USD Billion)
9.4 Security Systems
9.4.1 Security Systems Market Trends Analysis (2020-2032)
9.4.2 Security Systems Market Size Estimates and Forecasts to 2032 (USD Billion)
9.5 Energy Management
9.5.1 Energy Management Market Trends Analysis (2020-2032)
9.5.2 Energy Management Market Size Estimates and Forecasts to 2032 (USD Billion)
10. Occupancy Sensor Market Segmentation, By End Use
10.1 Chapter Overview
10.2 Residential
10.2.1 Residential Market Trends Analysis (2020-2032)
10.2.2 Residential Market Size Estimates and Forecasts to 2032 (USD Billion)
10.3 Commercial
10.3.1 Commercial Market Trends Analysis (2020-2032)
10.3.2 Commercial Market Size Estimates and Forecasts to 2032 (USD Billion)
10.4 Industrial
10.4.1 Industrial Market Trends Analysis (2020-2032)
10.4.2 Industrial Market Size Estimates and Forecasts to 2032 (USD Billion)
10.5 Institutional
10.5.1 Institutional Market Trends Analysis (2020-2032)
10.5.2 Institutional Market Size Estimates and Forecasts to 2032 (USD Billion)
11. Regional Analysis
11.1 Chapter Overview
11.2 North America
11.2.1 Trends Analysis
11.2.2 North America Occupancy Sensor Market Estimates and Forecasts, by Country (2020-2032) (USD Billion)
11.2.3 North America Occupancy Sensor Market Estimates and Forecasts, By Type (2020-2032) (USD Billion)
11.2.4 North America Occupancy Sensor Market Estimates and Forecasts, By Connectivity (2020-2032) (USD Billion)
11.2.5 North America Occupancy Sensor Market Estimates and Forecasts, By Application (2020-2032) (USD Billion)
11.2.6 North America Occupancy Sensor Market Estimates and Forecasts, By End Use (2020-2032) (USD Billion)
11.2.7 USA
11.2.7.1 USA Occupancy Sensor Market Estimates and Forecasts, By Type (2020-2032) (USD Billion)
11.2.7.2 USA Occupancy Sensor Market Estimates and Forecasts, By Connectivity (2020-2032) (USD Billion)
11.2.7.3 USA Occupancy Sensor Market Estimates and Forecasts, By Application (2020-2032) (USD Billion)
11.2.7.4 USA Occupancy Sensor Market Estimates and Forecasts, By End Use (2020-2032) (USD Billion)
11.2.8 Canada
11.2.8.1 Canada Occupancy Sensor Market Estimates and Forecasts, By Type (2020-2032) (USD Billion)
11.2.8.2 Canada Occupancy Sensor Market Estimates and Forecasts, By Connectivity (2020-2032) (USD Billion)
11.2.8.3 Canada Occupancy Sensor Market Estimates and Forecasts, By Application (2020-2032) (USD Billion)
11.2.8.4 Canada Occupancy Sensor Market Estimates and Forecasts, By End Use (2020-2032) (USD Billion)
11.2.9 Mexico
11.2.9.1 Mexico Occupancy Sensor Market Estimates and Forecasts, By Type (2020-2032) (USD Billion)
11.2.9.2 Mexico Occupancy Sensor Market Estimates and Forecasts, By Connectivity (2020-2032) (USD Billion)
11.2.9.3 Mexico Occupancy Sensor Market Estimates and Forecasts, By Application (2020-2032) (USD Billion)
11.2.9.4 Mexico Occupancy Sensor Market Estimates and Forecasts, By End Use (2020-2032) (USD Billion)
11.3 Europe
11.3.1 Eastern Europe
11.3.1.1 Trends Analysis
11.3.1.2 Eastern Europe Occupancy Sensor Market Estimates and Forecasts, by Country (2020-2032) (USD Billion)
11.3.1.3 Eastern Europe Occupancy Sensor Market Estimates and Forecasts, By Type (2020-2032) (USD Billion)
11.3.1.4 Eastern Europe Occupancy Sensor Market Estimates and Forecasts, By Connectivity (2020-2032) (USD Billion)
11.3.1.5 Eastern Europe Occupancy Sensor Market Estimates and Forecasts, By Application (2020-2032) (USD Billion)
11.3.1.6 Eastern Europe Occupancy Sensor Market Estimates and Forecasts, By End Use (2020-2032) (USD Billion)
11.3.1.7 Poland
11.3.1.7.1 Poland Occupancy Sensor Market Estimates and Forecasts, By Type (2020-2032) (USD Billion)
11.3.1.7.2 Poland Occupancy Sensor Market Estimates and Forecasts, By Connectivity (2020-2032) (USD Billion)
11.3.1.7.3 Poland Occupancy Sensor Market Estimates and Forecasts, By Application (2020-2032) (USD Billion)
11.3.1.7.4 Poland Occupancy Sensor Market Estimates and Forecasts, By End Use (2020-2032) (USD Billion)
11.3.1.8 Romania
11.3.1.8.1 Romania Occupancy Sensor Market Estimates and Forecasts, By Type (2020-2032) (USD Billion)
11.3.1.8.2 Romania Occupancy Sensor Market Estimates and Forecasts, By Connectivity (2020-2032) (USD Billion)
11.3.1.8.3 Romania Occupancy Sensor Market Estimates and Forecasts, By Application (2020-2032) (USD Billion)
11.3.1.8.4 Romania Occupancy Sensor Market Estimates and Forecasts, By End Use (2020-2032) (USD Billion)
11.3.1.9 Hungary
11.3.1.9.1 Hungary Occupancy Sensor Market Estimates and Forecasts, By Type (2020-2032) (USD Billion)
11.3.1.9.2 Hungary Occupancy Sensor Market Estimates and Forecasts, By Connectivity (2020-2032) (USD Billion)
11.3.1.9.3 Hungary Occupancy Sensor Market Estimates and Forecasts, By Application (2020-2032) (USD Billion)
11.3.1.9.4 Hungary Occupancy Sensor Market Estimates and Forecasts, By End Use (2020-2032) (USD Billion)
11.3.1.10 turkey
11.3.1.10.1 Turkey Occupancy Sensor Market Estimates and Forecasts, By Type (2020-2032) (USD Billion)
11.3.1.10.2 Turkey Occupancy Sensor Market Estimates and Forecasts, By Connectivity (2020-2032) (USD Billion)
11.3.1.10.3 Turkey Occupancy Sensor Market Estimates and Forecasts, By Application (2020-2032) (USD Billion)
11.3.1.10.4 Turkey Occupancy Sensor Market Estimates and Forecasts, By End Use (2020-2032) (USD Billion)
11.3.1.11 Rest of Eastern Europe
11.3.1.11.1 Rest of Eastern Europe Occupancy Sensor Market Estimates and Forecasts, By Type (2020-2032) (USD Billion)
11.3.1.11.2 Rest of Eastern Europe Occupancy Sensor Market Estimates and Forecasts, By Connectivity (2020-2032) (USD Billion)
11.3.1.11.3 Rest of Eastern Europe Occupancy Sensor Market Estimates and Forecasts, By Application (2020-2032) (USD Billion)
11.3.1.11.4 Rest of Eastern Europe Occupancy Sensor Market Estimates and Forecasts, By End Use (2020-2032) (USD Billion)
11.3.2 Western Europe
11.3.2.1 Trends Analysis
11.3.2.2 Western Europe Occupancy Sensor Market Estimates and Forecasts, by Country (2020-2032) (USD Billion)
11.3.2.3 Western Europe Occupancy Sensor Market Estimates and Forecasts, By Type (2020-2032) (USD Billion)
11.3.2.4 Western Europe Occupancy Sensor Market Estimates and Forecasts, By Connectivity (2020-2032) (USD Billion)
11.3.2.5 Western Europe Occupancy Sensor Market Estimates and Forecasts, By Application (2020-2032) (USD Billion)
11.3.2.6 Western Europe Occupancy Sensor Market Estimates and Forecasts, By End Use (2020-2032) (USD Billion)
11.3.2.7 Germany
11.3.2.7.1 Germany Occupancy Sensor Market Estimates and Forecasts, By Type (2020-2032) (USD Billion)
11.3.2.7.2 Germany Occupancy Sensor Market Estimates and Forecasts, By Connectivity (2020-2032) (USD Billion)
11.3.2.7.3 Germany Occupancy Sensor Market Estimates and Forecasts, By Application (2020-2032) (USD Billion)
11.3.2.7.4 Germany Occupancy Sensor Market Estimates and Forecasts, By End Use (2020-2032) (USD Billion)
11.3.2.8 France
11.3.2.8.1 France Occupancy Sensor Market Estimates and Forecasts, By Type (2020-2032) (USD Billion)
11.3.2.8.2 France Occupancy Sensor Market Estimates and Forecasts, By Connectivity (2020-2032) (USD Billion)
11.3.2.8.3 France Occupancy Sensor Market Estimates and Forecasts, By Application (2020-2032) (USD Billion)
11.3.2.8.4 France Occupancy Sensor Market Estimates and Forecasts, By End Use (2020-2032) (USD Billion)
11.3.2.9 UK
11.3.2.9.1 UK Occupancy Sensor Market Estimates and Forecasts, By Type (2020-2032) (USD Billion)
11.3.2.9.2 UK Occupancy Sensor Market Estimates and Forecasts, By Connectivity (2020-2032) (USD Billion)
11.3.2.9.3 UK Occupancy Sensor Market Estimates and Forecasts, By Application (2020-2032) (USD Billion)
11.3.2.9.4 UK Occupancy Sensor Market Estimates and Forecasts, By End Use (2020-2032) (USD Billion)
11.3.2.10 Italy
11.3.2.10.1 Italy Occupancy Sensor Market Estimates and Forecasts, By Type (2020-2032) (USD Billion)
11.3.2.10.2 Italy Occupancy Sensor Market Estimates and Forecasts, By Connectivity (2020-2032) (USD Billion)
11.3.2.10.3 Italy Occupancy Sensor Market Estimates and Forecasts, By Application (2020-2032) (USD Billion)
11.3.2.10.4 Italy Occupancy Sensor Market Estimates and Forecasts, By End Use (2020-2032) (USD Billion)
11.3.2.11 Spain
11.3.2.11.1 Spain Occupancy Sensor Market Estimates and Forecasts, By Type (2020-2032) (USD Billion)
11.3.2.11.2 Spain Occupancy Sensor Market Estimates and Forecasts, By Connectivity (2020-2032) (USD Billion)
11.3.2.11.3 Spain Occupancy Sensor Market Estimates and Forecasts, By Application (2020-2032) (USD Billion)
11.3.2.11.4 Spain Occupancy Sensor Market Estimates and Forecasts, By End Use (2020-2032) (USD Billion)
11.3.2.12 Netherlands
11.3.2.12.1 Netherlands Occupancy Sensor Market Estimates and Forecasts, By Type (2020-2032) (USD Billion)
11.3.2.12.2 Netherlands Occupancy Sensor Market Estimates and Forecasts, By Connectivity (2020-2032) (USD Billion)
11.3.2.12.3 Netherlands Occupancy Sensor Market Estimates and Forecasts, By Application (2020-2032) (USD Billion)
11.3.2.12.4 Netherlands Occupancy Sensor Market Estimates and Forecasts, By End Use (2020-2032) (USD Billion)
11.3.2.13 Switzerland
11.3.2.13.1 Switzerland Occupancy Sensor Market Estimates and Forecasts, By Type (2020-2032) (USD Billion)
11.3.2.13.2 Switzerland Occupancy Sensor Market Estimates and Forecasts, By Connectivity (2020-2032) (USD Billion)
11.3.2.13.3 Switzerland Occupancy Sensor Market Estimates and Forecasts, By Application (2020-2032) (USD Billion)
11.3.2.13.4 Switzerland Occupancy Sensor Market Estimates and Forecasts, By End Use (2020-2032) (USD Billion)
11.3.2.14 Austria
11.3.2.14.1 Austria Occupancy Sensor Market Estimates and Forecasts, By Type (2020-2032) (USD Billion)
11.3.2.14.2 Austria Occupancy Sensor Market Estimates and Forecasts, By Connectivity (2020-2032) (USD Billion)
11.3.2.14.3 Austria Occupancy Sensor Market Estimates and Forecasts, By Application (2020-2032) (USD Billion)
11.3.2.14.4 Austria Occupancy Sensor Market Estimates and Forecasts, By End Use (2020-2032) (USD Billion)
11.3.2.15 Rest of Western Europe
11.3.2.15.1 Rest of Western Europe Occupancy Sensor Market Estimates and Forecasts, By Type (2020-2032) (USD Billion)
11.3.2.15.2 Rest of Western Europe Occupancy Sensor Market Estimates and Forecasts, By Connectivity (2020-2032) (USD Billion)
11.3.2.15.3 Rest of Western Europe Occupancy Sensor Market Estimates and Forecasts, By Application (2020-2032) (USD Billion)
11.3.2.15.4 Rest of Western Europe Occupancy Sensor Market Estimates and Forecasts, By End Use (2020-2032) (USD Billion)
11.4 Asia Pacific
11.4.1 Trends Analysis
11.4.2 Asia Pacific Occupancy Sensor Market Estimates and Forecasts, by Country (2020-2032) (USD Billion)
11.4.3 Asia Pacific Occupancy Sensor Market Estimates and Forecasts, By Type (2020-2032) (USD Billion)
11.4.4 Asia Pacific Occupancy Sensor Market Estimates and Forecasts, By Connectivity (2020-2032) (USD Billion)
11.4.5 Asia Pacific Occupancy Sensor Market Estimates and Forecasts, By Application (2020-2032) (USD Billion)
11.4.6 Asia Pacific Occupancy Sensor Market Estimates and Forecasts, By End Use (2020-2032) (USD Billion)
11.4.7 China
11.4.7.1 China Occupancy Sensor Market Estimates and Forecasts, By Type (2020-2032) (USD Billion)
11.4.7.2 China Occupancy Sensor Market Estimates and Forecasts, By Connectivity (2020-2032) (USD Billion)
11.4.7.3 China Occupancy Sensor Market Estimates and Forecasts, By Application (2020-2032) (USD Billion)
11.4.7.4 China Occupancy Sensor Market Estimates and Forecasts, By End Use (2020-2032) (USD Billion)
11.4.8 India
11.4.8.1 India Occupancy Sensor Market Estimates and Forecasts, By Type (2020-2032) (USD Billion)
11.4.8.2 India Occupancy Sensor Market Estimates and Forecasts, By Connectivity (2020-2032) (USD Billion)
11.4.8.3 India Occupancy Sensor Market Estimates and Forecasts, By Application (2020-2032) (USD Billion)
11.4.8.4 India Occupancy Sensor Market Estimates and Forecasts, By End Use (2020-2032) (USD Billion)
11.4.9 Japan
11.4.9.1 Japan Occupancy Sensor Market Estimates and Forecasts, By Type (2020-2032) (USD Billion)
11.4.9.2 Japan Occupancy Sensor Market Estimates and Forecasts, By Connectivity (2020-2032) (USD Billion)
11.4.9.3 Japan Occupancy Sensor Market Estimates and Forecasts, By Application (2020-2032) (USD Billion)
11.4.9.4 Japan Occupancy Sensor Market Estimates and Forecasts, By End Use (2020-2032) (USD Billion)
11.4.10 South Korea
11.4.10.1 South Korea Occupancy Sensor Market Estimates and Forecasts, By Type (2020-2032) (USD Billion)
11.4.10.2 South Korea Occupancy Sensor Market Estimates and Forecasts, By Connectivity (2020-2032) (USD Billion)
11.4.10.3 South Korea Occupancy Sensor Market Estimates and Forecasts, By Application (2020-2032) (USD Billion)
11.4.10.4 South Korea Occupancy Sensor Market Estimates and Forecasts, By End Use (2020-2032) (USD Billion)
11.4.11 Vietnam
11.4.11.1 Vietnam Occupancy Sensor Market Estimates and Forecasts, By Type (2020-2032) (USD Billion)
11.4.11.2 Vietnam Occupancy Sensor Market Estimates and Forecasts, By Connectivity (2020-2032) (USD Billion)
11.4.11.3 Vietnam Occupancy Sensor Market Estimates and Forecasts, By Application (2020-2032) (USD Billion)
11.4.11.4 Vietnam Occupancy Sensor Market Estimates and Forecasts, By End Use (2020-2032) (USD Billion)
11.4.12 Singapore
11.4.12.1 Singapore Occupancy Sensor Market Estimates and Forecasts, By Type (2020-2032) (USD Billion)
11.4.12.2 Singapore Occupancy Sensor Market Estimates and Forecasts, By Connectivity (2020-2032) (USD Billion)
11.4.12.3 Singapore Occupancy Sensor Market Estimates and Forecasts, By Application (2020-2032) (USD Billion)
11.4.12.4 Singapore Occupancy Sensor Market Estimates and Forecasts, By End Use (2020-2032) (USD Billion)
11.4.13 Australia
11.4.13.1 Australia Occupancy Sensor Market Estimates and Forecasts, By Type (2020-2032) (USD Billion)
11.4.13.2 Australia Occupancy Sensor Market Estimates and Forecasts, By Connectivity (2020-2032) (USD Billion)
11.4.13.3 Australia Occupancy Sensor Market Estimates and Forecasts, By Application (2020-2032) (USD Billion)
11.4.13.4 Australia Occupancy Sensor Market Estimates and Forecasts, By End Use (2020-2032) (USD Billion)
11.4.14 Rest of Asia Pacific
11.4.14.1 Rest of Asia Pacific Occupancy Sensor Market Estimates and Forecasts, By Type (2020-2032) (USD Billion)
11.4.14.2 Rest of Asia Pacific Occupancy Sensor Market Estimates and Forecasts, By Connectivity (2020-2032) (USD Billion)
11.4.14.3 Rest of Asia Pacific Occupancy Sensor Market Estimates and Forecasts, By Application (2020-2032) (USD Billion)
11.4.14.4 Rest of Asia Pacific Occupancy Sensor Market Estimates and Forecasts, By End Use (2020-2032) (USD Billion)
11.5 Middle East and Africa
11.5.1 Middle East
11.5.1.1 Trends Analysis
11.5.1.2 Middle East Occupancy Sensor Market Estimates and Forecasts, by Country (2020-2032) (USD Billion)
11.5.1.3 Middle East Occupancy Sensor Market Estimates and Forecasts, By Type (2020-2032) (USD Billion)
11.5.1.4 Middle East Occupancy Sensor Market Estimates and Forecasts, By Connectivity (2020-2032) (USD Billion)
11.5.1.5 Middle East Occupancy Sensor Market Estimates and Forecasts, By Application (2020-2032) (USD Billion)
11.5.1.6 Middle East Occupancy Sensor Market Estimates and Forecasts, By End Use (2020-2032) (USD Billion)
11.5.1.7 UAE
11.5.1.7.1 UAE Occupancy Sensor Market Estimates and Forecasts, By Type (2020-2032) (USD Billion)
11.5.1.7.2 UAE Occupancy Sensor Market Estimates and Forecasts, By Connectivity (2020-2032) (USD Billion)
11.5.1.7.3 UAE Occupancy Sensor Market Estimates and Forecasts, By Application (2020-2032) (USD Billion)
11.5.1.7.4 UAE Occupancy Sensor Market Estimates and Forecasts, By End Use (2020-2032) (USD Billion)
11.5.1.8 Egypt
11.5.1.8.1 Egypt Occupancy Sensor Market Estimates and Forecasts, By Type (2020-2032) (USD Billion)
11.5.1.8.2 Egypt Occupancy Sensor Market Estimates and Forecasts, By Connectivity (2020-2032) (USD Billion)
11.5.1.8.3 Egypt Occupancy Sensor Market Estimates and Forecasts, By Application (2020-2032) (USD Billion)
11.5.1.8.4 Egypt Occupancy Sensor Market Estimates and Forecasts, By End Use (2020-2032) (USD Billion)
11.5.1.9 Saudi Arabia
11.5.1.9.1 Saudi Arabia Occupancy Sensor Market Estimates and Forecasts, By Type (2020-2032) (USD Billion)
11.5.1.9.2 Saudi Arabia Occupancy Sensor Market Estimates and Forecasts, By Connectivity (2020-2032) (USD Billion)
11.5.1.9.3 Saudi Arabia Occupancy Sensor Market Estimates and Forecasts, By Application (2020-2032) (USD Billion)
11.5.1.9.4 Saudi Arabia Occupancy Sensor Market Estimates and Forecasts, By End Use (2020-2032) (USD Billion)
11.5.1.10 Qatar
11.5.1.10.1 Qatar Occupancy Sensor Market Estimates and Forecasts, By Type (2020-2032) (USD Billion)
11.5.1.10.2 Qatar Occupancy Sensor Market Estimates and Forecasts, By Connectivity (2020-2032) (USD Billion)
11.5.1.10.3 Qatar Occupancy Sensor Market Estimates and Forecasts, By Application (2020-2032) (USD Billion)
11.5.1.10.4 Qatar Occupancy Sensor Market Estimates and Forecasts, By End Use (2020-2032) (USD Billion)
11.5.1.11 Rest of Middle East
11.5.1.11.1 Rest of Middle East Occupancy Sensor Market Estimates and Forecasts, By Type (2020-2032) (USD Billion)
11.5.1.11.2 Rest of Middle East Occupancy Sensor Market Estimates and Forecasts, By Connectivity (2020-2032) (USD Billion)
11.5.1.11.3 Rest of Middle East Occupancy Sensor Market Estimates and Forecasts, By Application (2020-2032) (USD Billion)
11.5.1.11.4 Rest of Middle East Occupancy Sensor Market Estimates and Forecasts, By End Use (2020-2032) (USD Billion)
11.5.2 Africa
11.5.2.1 Trends Analysis
11.5.2.2 Africa Occupancy Sensor Market Estimates and Forecasts, by Country (2020-2032) (USD Billion)
11.5.2.3 Africa Occupancy Sensor Market Estimates and Forecasts, By Type (2020-2032) (USD Billion)
11.5.2.4 Africa Occupancy Sensor Market Estimates and Forecasts, By Connectivity (2020-2032) (USD Billion)
11.5.2.5 Africa Occupancy Sensor Market Estimates and Forecasts, By Application (2020-2032) (USD Billion)
11.5.2.6 Africa Occupancy Sensor Market Estimates and Forecasts, By End Use (2020-2032) (USD Billion)
11.5.2.7 South Africa
11.5.2.7.1 South Africa Occupancy Sensor Market Estimates and Forecasts, By Type (2020-2032) (USD Billion)
11.5.2.7.2 South Africa Occupancy Sensor Market Estimates and Forecasts, By Connectivity (2020-2032) (USD Billion)
11.5.2.7.3 South Africa Occupancy Sensor Market Estimates and Forecasts, By Application (2020-2032) (USD Billion)
11.5.2.7.4 South Africa Occupancy Sensor Market Estimates and Forecasts, By End Use (2020-2032) (USD Billion)
11.5.2.8 Nigeria
11.5.2.8.1 Nigeria Occupancy Sensor Market Estimates and Forecasts, By Type (2020-2032) (USD Billion)
11.5.2.8.2 Nigeria Occupancy Sensor Market Estimates and Forecasts, By Connectivity (2020-2032) (USD Billion)
11.5.2.8.3 Nigeria Occupancy Sensor Market Estimates and Forecasts, By Application (2020-2032) (USD Billion)
11.5.2.8.4 Nigeria Occupancy Sensor Market Estimates and Forecasts, By End Use (2020-2032) (USD Billion)
11.5.2.9 Rest of Africa
11.5.2.9.1 Rest of Africa Occupancy Sensor Market Estimates and Forecasts, By Type (2020-2032) (USD Billion)
11.5.2.9.2 Rest of Africa Occupancy Sensor Market Estimates and Forecasts, By Connectivity (2020-2032) (USD Billion)
11.5.2.9.3 Rest of Africa Occupancy Sensor Market Estimates and Forecasts, By Application (2020-2032) (USD Billion)
11.5.2.9.4 Rest of Africa Occupancy Sensor Market Estimates and Forecasts, By End Use (2020-2032) (USD Billion)
11.6 Latin America
11.6.1 Trends Analysis
11.6.2 Latin America Occupancy Sensor Market Estimates and Forecasts, by Country (2020-2032) (USD Billion)
11.6.3 Latin America Occupancy Sensor Market Estimates and Forecasts, By Type (2020-2032) (USD Billion)
11.6.4 Latin America Occupancy Sensor Market Estimates and Forecasts, By Connectivity (2020-2032) (USD Billion)
11.6.5 Latin America Occupancy Sensor Market Estimates and Forecasts, By Application (2020-2032) (USD Billion)
11.6.6 Latin America Occupancy Sensor Market Estimates and Forecasts, By End Use (2020-2032) (USD Billion)
11.6.7 Brazil
11.6.7.1 Brazil Occupancy Sensor Market Estimates and Forecasts, By Type (2020-2032) (USD Billion)
11.6.7.2 Brazil Occupancy Sensor Market Estimates and Forecasts, By Connectivity (2020-2032) (USD Billion)
11.6.7.3 Brazil Occupancy Sensor Market Estimates and Forecasts, By Application (2020-2032) (USD Billion)
11.6.7.4 Brazil Occupancy Sensor Market Estimates and Forecasts, By End Use (2020-2032) (USD Billion)
11.6.8 Argentina
11.6.8.1 Argentina Occupancy Sensor Market Estimates and Forecasts, By Type (2020-2032) (USD Billion)
11.6.8.2 Argentina Occupancy Sensor Market Estimates and Forecasts, By Connectivity (2020-2032) (USD Billion)
11.6.8.3 Argentina Occupancy Sensor Market Estimates and Forecasts, By Application (2020-2032) (USD Billion)
11.6.8.4 Argentina Occupancy Sensor Market Estimates and Forecasts, By End Use (2020-2032) (USD Billion)
11.6.9 Colombia
11.6.9.1 Colombia Occupancy Sensor Market Estimates and Forecasts, By Type (2020-2032) (USD Billion)
11.6.9.2 Colombia Occupancy Sensor Market Estimates and Forecasts, By Connectivity (2020-2032) (USD Billion)
11.6.9.3 Colombia Occupancy Sensor Market Estimates and Forecasts, By Application (2020-2032) (USD Billion)
11.6.9.4 Colombia Occupancy Sensor Market Estimates and Forecasts, By End Use (2020-2032) (USD Billion)
11.6.10 Rest of Latin America
11.6.10.1 Rest of Latin America Occupancy Sensor Market Estimates and Forecasts, By Type (2020-2032) (USD Billion)
11.6.10.2 Rest of Latin America Occupancy Sensor Market Estimates and Forecasts, By Connectivity (2020-2032) (USD Billion)
11.6.10.3 Rest of Latin America Occupancy Sensor Market Estimates and Forecasts, By Application (2020-2032) (USD Billion)
11.6.10.4 Rest of Latin America Occupancy Sensor Market Estimates and Forecasts, By End Use (2020-2032) (USD Billion)
12. Company Profiles
12.1 Acuity Brands.
12.1.1 Company Overview
12.1.2 Financial
12.1.3 Products/ Services Offered
12.1.4 SWOT Analysis
12.2 Kidde
12.2.1 Company Overview
12.2.2 Financial
12.2.3 Products/ Services Offered
12.2.4 SWOT Analysis
12.3 AMS-Osram.
12.3.1 Company Overview
12.3.2 Financial
12.3.3 Products/ Services Offered
12.3.4 SWOT Analysis
12.4 Pepperl+Fuchs.
12.4.1 Company Overview
12.4.2 Financial
12.4.3 Products/ Services Offered
12.4.4 SWOT Analysis
12.5 System Sensor
12.5.1 Company Overview
12.5.2 Financial
12.5.3 Products/ Services Offered
12.5.4 SWOT Analysis
12.6 EnOcean
12.6.1 Company Overview
12.6.2 Financial
12.6.3 Products/ Services Offered
12.6.4 SWOT Analysis
12.7 Legrand
12.7.1 Company Overview
12.7.2 Financial
12.7.3 Products/ Services Offered
12.7.4 SWOT Analysis
12.8 Lutron Electronics
12.8.1 Company Overview
12.8.2 Financial
12.8.3 Products/ Services Offered
12.8.4 SWOT Analysis
12.9 Schneider Electric
12.9.1 Company Overview
12.9.2 Financial
12.9.3 Products/ Services Offered
12.9.4 SWOT Analysis
12.10 Honeywell
12.10.1 Company Overview
12.10.2 Financial
12.10.3 Products/ Services Offered
12.10.4 SWOT Analysis
13. Use Cases and Best Practices
14. Conclusion
An accurate research report requires proper strategizing as well as implementation. There are multiple factors involved in the completion of good and accurate research report and selecting the best methodology to compete the research is the toughest part. Since the research reports we provide play a crucial role in any company’s decision-making process, therefore we at SNS Insider always believe that we should choose the best method which gives us results closer to reality. This allows us to reach at a stage wherein we can provide our clients best and accurate investment to output ratio.
Each report that we prepare takes a timeframe of 350-400 business hours for production. Starting from the selection of titles through a couple of in-depth brain storming session to the final QC process before uploading our titles on our website we dedicate around 350 working hours. The titles are selected based on their current market cap and the foreseen CAGR and growth.
The 5 steps process:
Step 1: Secondary Research:
Secondary Research or Desk Research is as the name suggests is a research process wherein, we collect data through the readily available information. In this process we use various paid and unpaid databases which our team has access to and gather data through the same. This includes examining of listed companies’ annual reports, Journals, SEC filling etc. Apart from this our team has access to various associations across the globe across different industries. Lastly, we have exchange relationships with various university as well as individual libraries.

Step 2: Primary Research
When we talk about primary research, it is a type of study in which the researchers collect relevant data samples directly, rather than relying on previously collected data. This type of research is focused on gaining content specific facts that can be sued to solve specific problems. Since the collected data is fresh and first hand therefore it makes the study more accurate and genuine.
We at SNS Insider have divided Primary Research into 2 parts.
Part 1 wherein we interview the KOLs of major players as well as the upcoming ones across various geographic regions. This allows us to have their view over the market scenario and acts as an important tool to come closer to the accurate market numbers. As many as 45 paid and unpaid primary interviews are taken from both the demand and supply side of the industry to make sure we land at an accurate judgement and analysis of the market.
This step involves the triangulation of data wherein our team analyses the interview transcripts, online survey responses and observation of on filed participants. The below mentioned chart should give a better understanding of the part 1 of the primary interview.

Part 2: In this part of primary research the data collected via secondary research and the part 1 of the primary research is validated with the interviews from individual consultants and subject matter experts.
Consultants are those set of people who have at least 12 years of experience and expertise within the industry whereas Subject Matter Experts are those with at least 15 years of experience behind their back within the same space. The data with the help of two main processes i.e., FGDs (Focused Group Discussions) and IDs (Individual Discussions). This gives us a 3rd party nonbiased primary view of the market scenario making it a more dependable one while collation of the data pointers.
Step 3: Data Bank Validation
Once all the information is collected via primary and secondary sources, we run that information for data validation. At our intelligence centre our research heads track a lot of information related to the market which includes the quarterly reports, the daily stock prices, and other relevant information. Our data bank server gets updated every fortnight and that is how the information which we collected using our primary and secondary information is revalidated in real time.

Step 4: QA/QC Process
After all the data collection and validation our team does a final level of quality check and quality assurance to get rid of any unwanted or undesired mistakes. This might include but not limited to getting rid of the any typos, duplication of numbers or missing of any important information. The people involved in this process include technical content writers, research heads and graphics people. Once this process is completed the title gets uploader on our platform for our clients to read it.
Step 5: Final QC/QA Process:
This is the last process and comes when the client has ordered the study. In this process a final QA/QC is done before the study is emailed to the client. Since we believe in giving our clients a good experience of our research studies, therefore, to make sure that we do not lack at our end in any way humanly possible we do a final round of quality check and then dispatch the study to the client.
By Type
Passive Infrared Sensors
Dual Technology Sensors
By Connectivity
Wired
Wireless
By Application
Lighting Control
HVAC Control
Security Systems
Energy Management
By End Use
Residential
Commercial
Industrial
Institutional
Request for Segment Customization as per your Business Requirement: Segment Customization Request
Regional Coverage:
North America
US
Canada
Mexico
Europe
Eastern Europe
Poland
Romania
Hungary
Turkey
Rest of Eastern Europe
Western Europe
Germany
France
UK
Italy
Spain
Netherlands
Switzerland
Austria
Rest of Western Europe
Asia Pacific
China
India
Japan
South Korea
Vietnam
Singapore
Australia
Rest of Asia Pacific
Middle East & Africa
Middle East
UAE
Egypt
Saudi Arabia
Qatar
Rest of Middle East
Africa
Nigeria
South Africa
Rest of Africa
Latin America
Brazil
Argentina
Colombia
Rest of Latin America
Request for Country Level Research Report: Country Level Customization Request
Available Customization
With the given market data, SNS Insider offers customization as per the company’s specific needs. The following customization options are available for the report:
Detailed Volume Analysis
Criss-Cross segment analysis (e.g. Product X Application)
Competitive Product Benchmarking
Geographic Analysis
Additional countries in any of the regions
Customized Data Representation
Detailed analysis and profiling of additional market players
The Consumer Electronics Market size was valued at USD 956.12 Billion in 2023 & will reach USD 1775.27 Billion by 2032, with a CAGR of 7.14% by 2024-2032.
The Tunable Laser Market Size was valued at $18.88 Billion in 2023 and it is expected to reach $54.06 Billion by 2032 at CAGR of 12.4% During 2024-2032
The 8K technology market size was valued at USD 12.29 billion in 2023 and is expected to grow to USD 197.70 billion by 2032 and grow at a CAGR Of 36.2 % over the forecast period of 2024-2032.
The Machine-to-Machine (M2M) Market Size was valued at USD 23.62 billion in 2023 and is expected to grow at a CAGR of 4.60% to reach USD 35.40 billion by 2032.
The Logic Analyzer Market Size was valued at USD 2.09 billion in 2023 and is projected to grow at a CAGR of 4.97% to reach USD 3.23 billion by 2032.
The Holographic Display Market Size was valued at USD 2.85 Billion in 2023 and is expected to reach USD 17.71 Billion by 2032 and grow at a CAGR of 22.55% over the forecast period 2024-2032.

Hi! Click one of our member below to chat on Phone
© 2025 All Rights Reserved by SNS Insider Pvt Ltd


