Observability Tools and Platforms Market Report Scope & Overview:
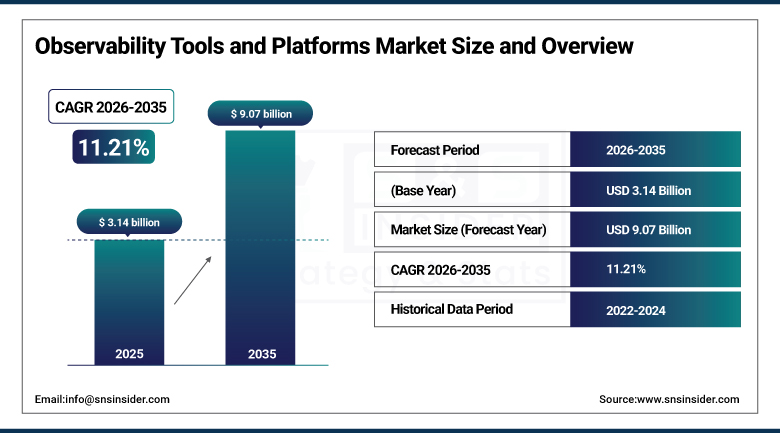
The Observability Tools and Platforms Market was valued at USD 3.14 Billion in 2025 and is expected to reach USD 9.07 Billion by 2035, growing at a CAGR of 11.21% from 2026 to 2035.
Growth in the Observability Tools and Platforms Market is being driven by the complexity associated with contemporary IT environments, comprising cloud-native applications, microservice architectures, hybrid clouds, and other such aspects. There is a need to have visibility into applications, infrastructure, and network performance for maintaining uptime and ensuring reliability. The rise in digital transformation activities across various industries is fueling the deployment of observability solutions that offer capabilities such as monitoring, logging, tracing, and analytics to facilitate business operations.
Moreover, the rising adoption of approaches such as DevOps, Site Reliability Engineering, and automated IT operations is also driving the demand for observability platforms. Businesses are using AI-enabled observability platforms to identify anomalies, make predictions about failures, and improve performance through proactive measures. The growing use of digital services, high customer demands for seamless experiences, and operational efficiency are some of the factors aiding in the growth of the global observability tools and platforms market.
Observability Tools and Platforms Market Size and Forecast
-
Market Size in 2026E: USD 3.49 Billion
-
Market Size by 2035: USD 9.07 Billion
-
CAGR: 11.21% from 2026 to 2035
-
Fastest Growing Region: Asia Pacific
-
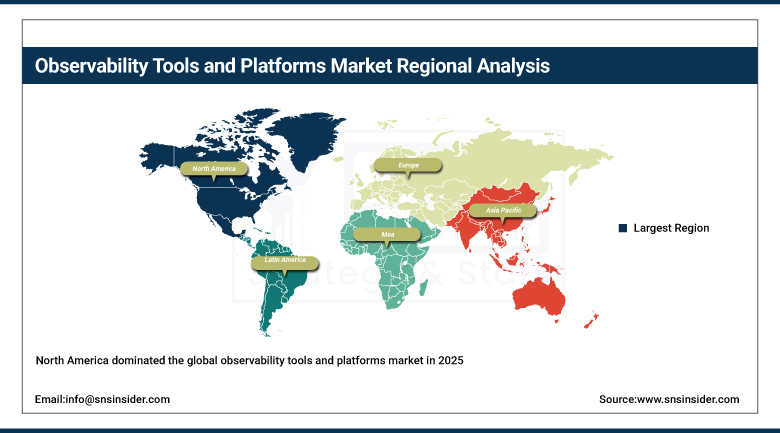
Largest Region: North America
To Get more information on Observability Tools and Platforms Market - Request Free Sample Report
Observability Tools and Platforms Market Trends
-
AI-powered observability solutions are enabling predictive monitoring, anomaly detection, and proactive issue resolution across complex IT environments.
-
OpenTelemetry adoption is increasing as organizations seek vendor-neutral telemetry data collection and greater interoperability between observability tools.
-
FinOps integration is driving the convergence of observability and cloud cost management to optimize performance and infrastructure spending.
-
Continuous profiling is gaining traction by providing code-level insights to improve application performance and resource utilization.
-
Security observability is emerging as platforms combine performance monitoring with threat detection for unified operational and security visibility.
U.S. Observability Tools and Platforms Market Outlook
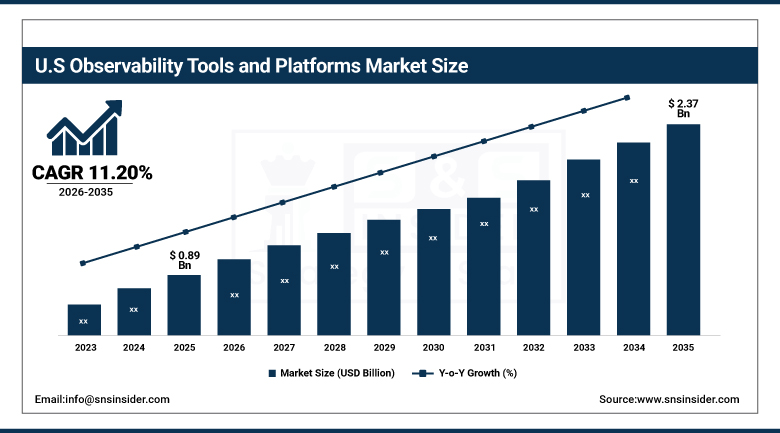
The U.S. Observability Tools and Platforms Market was valued at approximately USD 0.89 Billion in 2025 and is expected to reach approximately USD 2.37 Billion by 2035, growing at a CAGR of approximately 11.20%.
The U.S. is the epicenter of observability platform innovation and commercial activity, with the home of Datadog, New Relic, Dynatrace, Splunk, and Grafana Labs platform sales setting the benchmark in terms of distributed system observability commercial measurement. This is driven by the massive scale of cloud migration in the U.S., the prevalence of Kubernetes and microservice architecture which present observability challenges beyond the ability of legacy monitoring tools to solve, and the DevSecOps movement that places responsibility on engineers to ensure system performance. Civilian federal agency IT modernization projects and the availability needs of the financial services industry also provide extra structured procurement incentive.
In 2024, Datadog expanded its AI Observability product suite with LLM monitoring capabilities designed to track token consumption, latency, error rates, and prompt performance across AI application deployments, extending the observability paradigm from traditional infrastructure telemetry to the emerging category of generative AI application performance management.
Observability Tools and Platforms Market Segment Analysis
-
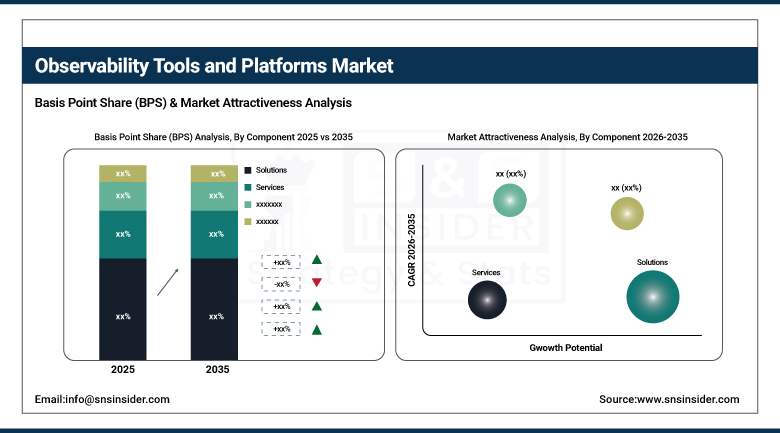
By Component, the Solutions segment dominated the observability tools and platforms market with approximately 69% share in 2025, while the Services segment is the fastest growing at approximately 12.75% CAGR.
-
By Deployment, the Cloud segment dominated the observability tools and platforms market with approximately 65% share in 2025, while the On-premises segment is the fastest growing at approximately 12.58% CAGR.
-
By Organization Size, the Large Enterprises segment dominated the observability tools and platforms market with approximately 68% share in 2025, while the SMEs segment is the fastest growing as cloud-delivered observability platforms.
-
By Vertical, the IT & Telecommunications segment dominated the observability tools and platforms market with the largest share in 2025, while the Healthcare & Life Sciences segment is the fastest growing as digital health platform adoption.
By Component, solutions dominate, services grow fastest
Solutions maintained dominance of the components position with about 69% share of the observability tools and platforms market in 2025. The unified observability platform spending is the main technology spend where the capability for centralized telemetry ingestion, anomaly detection using artificial intelligence (AI), and signal correlation makes up the operational bedrock of the enterprise IT performance management. Every cloud-native application implementation which uses Kubernetes orchestration, service mesh connectivity, and serverless functions invokes the requirement for observability instrumentation whose management becomes necessary through dedicated solutions.
Services is the fastest growing component segment at about 12.75% CAGR due to the increasing complexity in observability platforms' integration into existing IT service management (ITSM) processes, continuous integration / continuous delivery (CI/CD) pipeline, and incident management processes. Every enterprise implementing an observability platform requires services engagement which would cover all aspects from instrumentation strategy to dashboard creation, alerting policy formulation to runbook automation.
By Deployment, cloud dominates, on-premises grows fastest
Cloud deployment held the dominant share of the observability tool and platform market with around 65% in 2025. The automatic scaling of cloud observability platforms for high-volume telemetry processing and ingestion, easy API integration with cloud-native observability services from AWS CloudWatch, Azure Monitor, and Google Cloud Operations Suite, and the subscription economics model with cost tied to organizational size make up the specification preference for the majority of enterprise observability buying.
On-premises is the fastest-growing deployment type with a growth rate of 12.58% CAGR as the data governance requirements of the financial sector regulatory authorities, security classification requirements of the government and defense IT, and latency requirements of industrial operation technology monitoring result in structured demand for self-hosted observability which cannot be met through cloud-based offerings. Every regulated financial institution that prohibits the telemetry processing of its customer data by third-party cloud observability platforms constitutes an on-premises observability sale.
By Organization Size, large enterprises dominate, SMEs grow fastest
Large enterprises continued to be the leading organization size in terms of observability tools and platforms market share in 2025, accounting for around 68% of observability spending. The commercial attractiveness of observability spending in large enterprises derives from the combination of their extensive portfolio of distributed applications, multi-cloud IT infrastructure across multiple cloud platforms and hundreds of applications, and SLAs where failure to meet the agreed levels results in higher penalties, thus making them more motivated than average for investing in comprehensive observability monitoring solutions.
The SME segment is the fastest growing organization size, as the increasing awareness about the cost of downtime of digital businesses, cloud observability platforms priced for per-host or per user, and the growth in the ecosystem of observability-as-a-service makes them invest in observability for the first time in an organised way instead of just monitoring infrastructure. Each SME whose downtime in customer-facing applications results in significant revenue loss or customer churn has its motivation for investing in observability driven by commercial outcomes.
By Vertical, IT & telecom dominates, healthcare & life sciences grow fastest
IT and telecommunication maintained their dominating vertical positions in the observability tools and platforms market in 2025. The observability investments of the technology sector are outstanding since the industry vertical not only developed but also consumes the largest amount of cloud-native infrastructure that has microservices-based deployments creating the most complex observability instrumentation per company. All software companies that have SLA requirements of application availability monitoring, all cloud providers having SLA guarantees for infrastructure reliability, and all telecom operators with their network software monitoring requirements make IT and telecom a dominant vertical.
The healthcare and life sciences vertical is the fastest-growing one because of the growth in digital health platform usage in the sector, development of AI clinical decision support applications with performance reliability being crucial for patient safety, and uptime requirements of the electronic health records systems that will otherwise interrupt patient care.
Regional Analysis
|
Region |
Major Country |
Share within Region, 2025 (%) |
|---|---|---|
|
North America |
United States |
87.4% |
|
Europe |
Germany |
22.3% |
|
Asia Pacific |
China |
44.8% |
|
Middle East & Africa |
UAE |
31.2% |
|
Latin America |
Brazil |
44.2% |
North America Observability Tools and Platforms Market Insights
North America dominated the global observability tools and platforms market in 2025 due to the highest enterprise cloud adoption rate among all regions, the location of Datadog, Dynatrace, New Relic, Splunk, and Grafana Labs commercial headquarters, and the most advanced DevOps engineering environment with the standardization of SLO-based reliability engineering which motivates observability investments. The United States generated around 87.4% of North American revenues because of its exceptional enterprise software engineering scale and cloud infrastructure investments.
Canada generated around 12.6% of North American revenues through cloud adoption in Canada’s technology industry, observability investments motivated by the compliance requirements in the financial services industry, and technology companies’ engineering offices established in Toronto and Vancouver with cloud-native engineering practices.
Get Customized Report as per Your Business Requirement - Enquiry Now
Europe Observability Tools and Platforms Market Insights
Europe is a compliance-driven observability market driven by requirements for data processing transparency under the GDPR, IT system availability and monitoring under the NIS2 directive for essential organizations, and IT risk management in the financial industry under the Digital Operational Resilience Act. Germany represents 22.3% of Europe's revenue through investment in operational technology monitoring within its industrial IT and manufacturing industries and high-availability requirements in the financial services industry.
The United Kingdom, France, and the Netherlands are important second-tier European markets due to investment in observability in the financial services industry, DevOps adoption in the technology industry, and network performance monitoring for telecommunications operators. Dynatrace's presence at its headquarters in Austria and the software engineering investment in the European technology industry drive its commercial growth in the region.
Asia Pacific Observability Tools and Platforms Market Insights
Asia Pacific is currently the fastest growing observability platform regional market, owing to the cloud-native development practices in China's technology sector; India's rapidly growing IT services sector's DevOps practices; Japan's investments in modernizing its enterprise IT; and South Korea's technology manufacturing sector's digital transformation initiatives. China makes up about 44.8% of the Asia Pacific revenue share due to the scale of investment in cloud infrastructure and the adoption of microservices architecture in the technology sector.
India stands out as the most commercially vibrant developing market within the Asia Pacific region, thanks to the DevSecOps practices within its IT services sector's global delivery center; the emerging SaaS product companies ecosystem's cloud-native development practices; and digital platform reliability investments within its financial services sector.
MEA & Latin America Observability Tools and Platforms Market Insights
Revenues from the UAE take the lead in the Middle East and Africa region at about 31.2% owing to investments in smart cities' digital infrastructure monitoring, financial services sector's highly available IT needs and cloud-native technology adoption by the technology sector's innovation ecosystem. The Vision 2030 technology infrastructure investments in Saudi Arabia create additional Gulf-region demand. Revenues from Brazil take the lead in the Latin America region at about 44.2% due to the country's investments in observability of its digital platform in the financial services sector, adoption of DevOps in the technology sector and network performance monitoring in the telecommunications sector.
Market Dynamics
Growth Drivers: Multi-cloud and hybrid IT complexity requiring unified real-time observability and AI-driven automation reducing mean time to resolution
The fast emergence of multi-cloud, hybrid cloud, and containers will be the most structurally important growth driver for the observability market. The telemetry fragmentation issue created by monitoring tools native to different cloud providers used by companies deploying their applications on multiple clouds at the same time becomes an issue solved by observability platforms. The migration from monolithic to microservices architecture increases the number of instrumented systems by orders of magnitude. In order to manage this observability complexity, there needs to be a specific approach, including distributed tracing and service dependency mapping.
Reducing MTTR through AI-driven automation will bring clear business value to justify investments beyond cost benefits. Downtime of each application will lead to lost revenue, customer loss probability, and potential violation of SLA terms, which will result in costs calculated across enterprise application portfolio leading to high investment motivation. Proactive incident prevention brought by observability platforms due to anomaly detection will allow calculating ROI to maintain investments into the platform at commodity prices.
Restraints: High total cost of ownership and telemetry data volume management complexity
Costs involved in implementing and running observability initiatives make it challenging for organizations with limited budgets to adopt such initiatives. Costs associated with license costs of platforms, telemetry data ingestion and storage, and technical personnel needed to establish proper observability coverage pose total cost of ownership challenges for small businesses and enterprise IT organizations with tight budgets.
Increased volume of logs, metrics, and traces make it hard for traditional systems to manage the data effectively. Identification of signals amid telemetry data of high cardinality, correlation of information collected from diverse sources, and maintenance of good performance for queries on massive historical datasets require constant investment.
Opportunities: Cloud-native and serverless architecture growth and OpenTelemetry standardization expanding addressable market
The biggest commercial opportunity for the observability market to grow is the rise in adoption of cloud native and serverless architectures. Every company that uses Kubernetes for orchestration, service mesh for networking, and serverless functions will require observability features which legacy APMs are not able to provide, thus giving rise to more purchases of observability platforms by companies who had thought their monitoring solution was sufficient.
The development of OpenTelemetry as a standard framework for instrumentation will result in a growing number of observable applications which emit telemetry in a standardized way, allowing observability backends to compete based on their analytics abilities and not based on the reach of their instrumentation solutions. Every application that uses OpenTelemetry SDK instrumentation emits telemetry which can be consumed by all observability backends that support OpenTelemetry.
Recent Developments:
-
2024: Datadog launched AI Observability in 2024 with LLM monitoring capabilities covering token consumption, latency tracking, and prompt performance analytics, extending full-stack observability to generative AI application performance management.
-
2024: Dynatrace released Davis AI enhancements in 2024 with expanded causal AI capabilities providing automated root cause determination across infrastructure, application, and business events, reducing mean time to resolution for complex multi-layer performance incidents.
-
2024: New Relic launched NRQL AI-assisted query generation in 2024 enabling natural language queries against observability telemetry data, reducing the time-to-insight for engineering teams that lack deep query language proficiency.
Observability Tools and Platforms Market Key Players
-
Datadog Inc.
-
Dynatrace LLC
-
New Relic Inc.
-
Splunk Inc. (Cisco)
-
Grafana Labs
-
Elastic NV
-
Honeycomb.io Inc.
-
Lightstep Inc. (ServiceNow)
-
AppDynamics LLC (Cisco)
-
IBM Corporation
-
Microsoft Corporation (Azure Monitor)
-
Amazon Web Services Inc.
-
Google LLC (Cloud Operations Suite)
-
Sumo Logic Inc.
-
Instana Inc. (IBM)
-
Cribl Inc.
-
Chronosphere Inc.
-
Coralogix Ltd.
-
Logz.io Inc.
-
SolarWinds Corporation
Observability Tools and Platforms Market Report Scope:
| Report Attributes | Details |
|---|---|
| Market Size in 2025 | USD 3.14 Billion |
| Market Size by 2035 | USD 9.07 Billion |
| CAGR | CAGR of 11.21% From 2026 to 2035 |
| Base Year | 2025 |
| Forecast Period | 2026-2035 |
| Historical Data | 2022-2024 |
| Report Scope & Coverage | Market Size, Segments Analysis, Competitive Landscape, Regional Analysis, DROC & SWOT Analysis, Forecast Outlook |
| Key Segments | • By Component (Solutions, Services) • By Deployment (Cloud, On-premises) • By Organization Size (Large Enterprises, SMEs) • By Vertical (Manufacturing, Retail & E-commerce, Government & Public Sector, IT & Telecommunications, Healthcare & Life Sciences, BFSI, Others) |
| Regional Analysis/Coverage | North America (US, Canada), Europe (Germany, UK, France, Italy, Spain, Russia, Poland, Rest of Europe), Asia Pacific (China, India, Japan, South Korea, Australia, ASEAN Countries, Rest of Asia Pacific), Middle East & Africa (UAE, Saudi Arabia, Qatar, South Africa, Rest of Middle East & Africa), Latin America (Brazil, Argentina, Mexico, Colombia, Rest of Latin America). |
| Company Profiles | Datadog Inc., Dynatrace LLC, New Relic Inc., Splunk Inc. (Cisco), Grafana Labs, Elastic NV, Honeycomb.io Inc., Lightstep Inc. (ServiceNow), AppDynamics LLC (Cisco), IBM Corporation, Microsoft Corporation (Azure Monitor), Amazon Web Services Inc., Google LLC (Cloud Operations Suite), Sumo Logic Inc., Instana Inc. (IBM), Cribl Inc., Chronosphere Inc., Coralogix Ltd., Logz.io Inc., and SolarWinds Corporation are leading global observability and application performance monitoring companies enabling real-time cloud monitoring, log analytics, and digital infrastructure visibility across enterprise IT and DevOps environments. |
Frequently Asked Questions
Rapid adoption of multi-cloud and hybrid IT environments multiplying instrumentation complexity beyond legacy monitoring tool capability, and enterprise demand for AI-driven real-time anomaly detection that reduces mean time to resolution and minimizes the revenue impact of application downtime.
The Observability Tools and Platforms Market is expected to grow at a CAGR of 11.21% from 2026 to 2035.
The Observability Tools and Platforms Market was valued at USD 3.14 Billion in 2025.
North America dominated in 2025, driven by the highest enterprise cloud adoption rate and the commercial headquarters presence of Datadog, Dynatrace, New Relic, and Splunk, while Asia Pacific is the fastest growing region.
Solutions dominated with approximately 69% share in 2025, while Services is the fastest growing segment at approximately 12.75% CAGR.
Get in Touch
