Get More Information on Nutritional Analysis Market - Request Sample Report
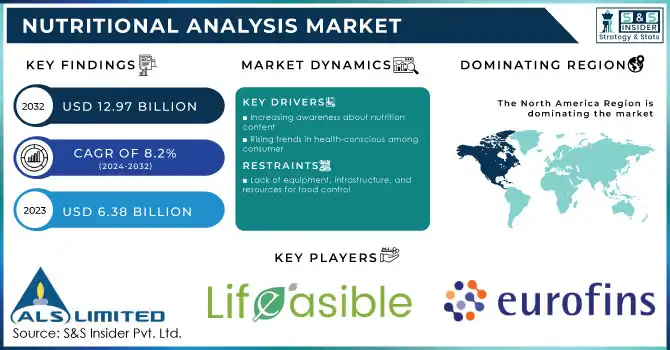
The Nutritional Analysis Market size was valued at USD 6.38 billion in 2023 and is expected to grow to USD 12.97 billion by 2032, at a CAGR of 8.2% over the forecast period of 2024-2032.
The nutritional analysis consists of testing food and beverages for various components such as proteins, carbohydrates, fats, sodium, vitamins & minerals, and others to create nutritional labeling for the back of product packaging. To ensure infant food safety, regulatory authorities have placed severe standards on organic baby foods. Because nutrition is essential for child growth, providing nutritional information will impact product buying decisions. Infant meals are frequently tested for adulteration and purity. As a result of these factors, the nutritional analysis market has grown at a faster rate.
Creating a product entails estimating cost and ingredient composition, and establishing the ingredient composition necessitates many lab investigations. The nutritional information about a product will also influence the consumer's purchase decision. As a result, when developing a food product, formulators have depended on nutritional analysis for trial samples.
Due to rising health concerns, consumers desire clean, mineral and vitamin enriched water that is always fresh. Water hardness test strips will therefore become much more common in the future. National primary drinking water regulations with enforced restrictions on the number of contaminants that could be harmful to human health have been developed by the Environmental Protection Agency. While supplying water to its customers, all civil and municipal authorities that offer public water must abide by these regulations.
KEY DRIVERS
Increasing awareness about nutrition content
Rising trends in health-conscious among consumer
Various cultural, economic, psychological, and lifestyle aspects have always had an impact on how consumers make their purchasing decisions for food and grocery items. This awareness relates to consumer health, disease, and diet. Consumers can learn more about the ingredients of food goods through the food labels that are presented on the package. Consumers may rely heavily on television commercials as a source of information.
Increasing awareness among consumers of food nutrition is another important market driver. A nutritional analysis lab offers food product testing services for the development of new products, supporting businesses in upholding the nutritional content of their new products as a standard.
RESTRAIN
Lack of equipment, infrastructure, and resources for food control
Developing countries lack the sophisticated organizations and necessary technologies for nutrient testing. Due to scarce resources, constrained technology, and subpar management, the infrastructure of food inspection laboratories in developing nations is anticipated to be bare. The market for nutritional analysis has been constrained by problems such lack of institutional coordination, a lack of knowledge to implement regulations at low levels, tools, and updated standards. Particularly in nations like Cuba, Bangladesh, and Ethiopia, food control laboratories are ill-equipped and lack qualified analytical staff.
OPPORTUNITY
Stringent food and drink regulations of the Regulatory Authorities
Food producers are subject to rules from governments all over the world that require them to list the nutritional content of their products. Nutritional analysis services are in demand as a result, and they can assist food producers in adhering to the rules. Calories, fat, carbs, protein, fiber, sugar, salt, vitamins, and minerals are among the nutritional data that must be listed on food labels. Nutritional analysis tests are in demand from the food and beverage industry. The market for nutritional analysis is developing in emerging nations as a result of fast industrialization, flourishing food trade with North America and Europe (free trade agreements), increased need for better water, and greater regulatory attention to safeguarding consumer wellness.
CHALLENGES
Time-consuming testing procedures and inconsistent food nutritional labeling laws
Traditional nutritional analysis techniques, such as laboratory testing, can be time- and money-consuming. Food producers who need to launch new goods or make changes to existing items fast may find this to be a hindrance. There isn't a single set of rules for food nutrition labeling that is widely followed. Because of this, it may be challenging for food makers to follow international rules.
The war is having a huge detrimental impact on food security and nutrition content globally. According to the World Food Programme (WFP), food costs have risen by 30% since the start of the war. The war has made it more difficult to acquire accurate results on food availability, nutritional content analysis, and consumption. This is because food markets have been disrupted and people have been uprooted from their homes. As a result, tracking changes in dietary nutritional status is more difficult. Because of increased food prices, some people may be eating less meat and more plant-based foods as a result of the war. Furthermore, consumers may be eating more processed foods since they are more convenient.
Food prices tend to rise during recessions when demand falls and supply remains constant or falls. People may find it more difficult to afford healthful meals as a result of this. Recessions can cause dietary shifts as consumers opt for less expensive, less nutritious meals. This increases the danger of malnutrition, particularly among vulnerable populations like children and the elderly. According to a study conducted by the United Nations Food and Agriculture Organization, the number of people facing acute food insecurity grew by 100 million owing in part to the COVID-19 pandemic and the ensuing economic recession.
by Parameter
Fat Profile
Vitamin Profile
Mineral Profile
Proteins
Total Dietary Fiber
Sugar Profile
Cholesterol
Calories
by Product Type
Bakery & Confectionery
Snacks
Dairy & Desserts
Meat & Poultry
Baby Food
Others
by Objective
New Product Development
Product Labelling
Quality Control
Regulation Compliance
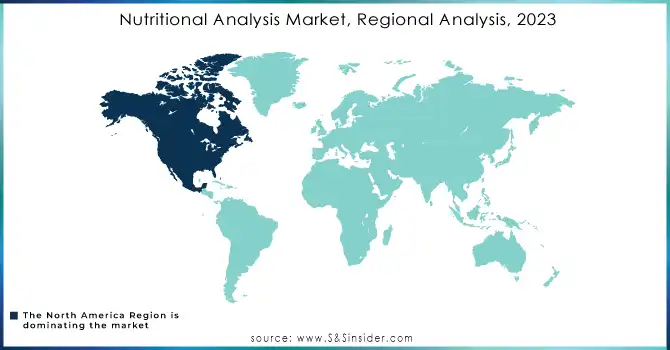
North America has dominated the nutritional analysis market and will continue to do so during the projection period due to high product consumption in the United States and Canada, as well as stringent product labeling requirements. Many developing countries are becoming more aware of nutritional and health issues.
The Asia-Pacific region will experience the fastest growth due to rising levels of usage of protein-rich food items, increased consumer awareness of the benefits, improvements in food nutrition and product labeling policies, a growing population, changing lifestyles, and rising personal disposable income. Poor nutritional health practices and Malnutrition are being addressed by government entities in the Asia Pacific region.
Europe's regional market has a significant growth owing to an increase in food safety standards and regulations. There is a growing awareness about the nutritional content of food products.
Get Customized Report as per your Business Requirement - Request For Customized Report
REGIONAL COVERAGE
North America
US
Canada
Mexico
Europe
Eastern Europe
Poland
Romania
Hungary
Turkey
Rest of Eastern Europe
Western Europe
Germany
France
UK
Italy
Spain
Netherlands
Switzerland
Austria
Rest of Western Europe
Asia Pacific
China
India
Japan
South Korea
Vietnam
Singapore
Australia
Rest of Asia Pacific
Middle East & Africa
Middle East
UAE
Egypt
Saudi Arabia
Qatar
Rest of Middle East
Africa
Nigeria
South Africa
Rest of Africa
Latin America
Brazil
Argentina
Colombia
Rest of Latin America
ALS Limited, Lifeasible, Eurofins Scientific, TUV SUD AG, Opal Research and Analytical Services, Pat-Chem Laboratories LLC, SGS SA, Microbac Laboratories, Inc., Intertek Group plc, Compu-Food Analysis, and other key players are mentioned in the final report.
In 2022 Nestle SA will begin displaying the nutritional value of its portfolio items as part of its annual reports published beginning with the 2022 annual report. The Nestle team will use the method of Health Star Rating to evaluate the nutrition content of its food and beverage items.
In 2022 Intertek, a global Total Quality Assurance provider, announces the launch of an enhanced adulteration panel analysis service created and supplied exclusively by our dietary supplements and organic product testing facility in Champaign, Illinois.
Report Attributes | Details |
Market Size in 2023 | US$ 6.38 Billion |
Market Size by 2032 | US$ 12.97 Billion |
CAGR | CAGR of 8.2% From 2024 to 2032 |
Base Year | 2023 |
Forecast Period | 2024-2032 |
Historical Data | 2020-2022 |
Report Scope & Coverage | Market Size, Segments Analysis, Competitive Landscape, Regional Analysis, DROC & SWOT Analysis, Forecast Outlook |
Key Segments | • By Parameter (Fat Profile, Vitamin Profile, Mineral Profile, Proteins, Moisture, Total Dietary Fiber, Sugar Profile, Cholesterol, Calories) • By Product Type (Bakery and confectionery, Snacks, Dairy and desserts, Meat and poultry, baby food, Others) • By Objective (New Product Development, Product Labelling, Quality Control, Regulation Compliance) |
Regional Analysis/Coverage | North America (US, Canada, Mexico), Europe (Eastern Europe [Poland, Romania, Hungary, Turkey, Rest of Eastern Europe] Western Europe] Germany, France, UK, Italy, Spain, Netherlands, Switzerland, Austria, Rest of Western Europe]), Asia Pacific (China, India, Japan, South Korea, Vietnam, Singapore, Australia, Rest of Asia Pacific), Middle East & Africa (Middle East [UAE, Egypt, Saudi Arabia, Qatar, Rest of Middle East], Africa [Nigeria, South Africa, Rest of Africa], Latin America (Brazil, Argentina, Colombia Rest of Latin America) |
Company Profiles | ALS Limited, Lifeasible, Eurofins Scientific, TUV SUD AG, Opal Research and Analytical Services, Pat-Chem Laboratories LLC, SGS SA, Microbac Laboratories, Inc., Intertek Group plc, Compu-Food Analysis |
Key Drivers | • Increasing awareness about nutrition content • Rising trends in health-conscious among consumer |
Market Challenges | • Time-consuming testing procedures and inconsistent food nutritional labeling laws |
Ans: Nutritional Analysis Market size was valued at USD 5.9 billion in 2022
Ans: Nutritional Analysis Market is anticipated to expand by 8.2% from 2023 to 2030.
Ans: Opportunities are Stringent food and drink regulations of the Regulatory Authorities drive the nutritional analysis market.
Ans: USD 11.08 billion is expected to grow by 2030.
Ans: The challenges are Time-consuming testing procedures of analysis and inconsistent food nutritional labeling laws
Table of Contents
1. Introduction
1.1 Market Definition
1.2 Scope
1.3 Research Assumptions
2. Research Methodology
3. Market Dynamics
3.1 Drivers
3.2 Restraints
3.3 Opportunities
3.4 Challenges
4. Impact Analysis
4.1 Impact of the Russia-Ukraine War
4.2 Impact of Ongoing Recession
4.2.1 Introduction
4.2.2 Impact on major economies
4.2.2.1 US
4.2.2.2 Canada
4.2.2.3 Germany
4.2.2.4 France
4.2.2.5 United Kingdom
4.2.2.6 China
4.2.2.7 Japan
4.2.2.8 South Korea
4.2.2.9 Rest of the World
5. Value Chain Analysis
6. Porter’s 5 forces model
7. PEST Analysis
8. Nutritional Analysis Market Segmentation, By Parameter
8.1 Fat Profile
8.2 Vitamin Profile
8.3 Mineral Profile
8.4 Proteins
8.5 Total Dietary Fiber
8.6 Sugar Profile
8.7 Cholesterol
8.8 Calories
9. Nutritional Analysis Market Segmentation, By Product Type
9.1 Bakery & Confectionery
9.2 Snacks
9.3 Dairy & Desserts
9.4 Meat & Poultry
9.5 Baby Food
9.5 Others
10. Nutritional Analysis Market Segmentation, By Objective
10.1 New Product Development
10.2 Product Labelling
10.3 Quality Control
10.4 Regulation Compliance
11. Regional Analysis
11.1 Introduction
11.2 North America
11.2.1 North America Nutritional Analysis Market by Country
11.2.2 North America Nutritional Analysis Market by Parameter
11.2.3 North America Nutritional Analysis Market by Product Type
11.2.4 North America Nutritional Analysis Market by Objective
11.2.5 USA
11.2.5.1 USA Nutritional Analysis Market by Parameter
11.2.5.2 USA Nutritional Analysis Market by Product Type
11.2.5.3 USA Nutritional Analysis Market by Objective
11.2.6 Canada
11.2.6.1 Canada Nutritional Analysis Market by Parameter
11.2.6.2 Canada Nutritional Analysis Market by Product Type
11.2.6.3 Canada Nutritional Analysis Market by Objective
11.2.7 Mexico
11.2.7.1 Mexico Nutritional Analysis Market by Parameter
11.2.7.2 Mexico Nutritional Analysis Market by Product Type
11.2.7.3 Mexico Nutritional Analysis Market by Objective
11.3 Europe
11.3.1 Eastern Europe
11.3.1.1 Eastern Europe Nutritional Analysis Market by Country
11.3.1.2 Eastern Europe Nutritional Analysis Market by Parameter
11.3.1.3 Eastern Europe Nutritional Analysis Market by Product Type
11.3.1.4 Eastern Europe Nutritional Analysis Market by Objective
11.3.1.5 Poland
11.3.1.5.1 Poland Nutritional Analysis Market by Parameter
11.3.1.5.2 Poland Nutritional Analysis Market by Product Type
11.3.1.5.3 Poland Nutritional Analysis Market by Objective
11.3.1.6 Romania
11.3.1.6.1 Romania Nutritional Analysis Market by Parameter
11.3.1.6.2 Romania Nutritional Analysis Market by Product Type
11.3.1.6.4 Romania Nutritional Analysis Market by Objective
11.3.1.7 Turkey
11.3.1.7.1 Turkey Nutritional Analysis Market by Parameter
11.3.1.7.2 Turkey Nutritional Analysis Market by Product Type
11.3.1.7.3 Turkey Nutritional Analysis Market by Objective
11.3.1.8 Rest of Eastern Europe
11.3.1.8.1 Rest of Eastern Europe Nutritional Analysis Market by Parameter
11.3.1.8.2 Rest of Eastern Europe Nutritional Analysis Market by Product Type
11.3.1.8.3 Rest of Eastern Europe Nutritional Analysis Market by Objective
11.3.2 Western Europe
11.3.2.1 Western Europe Nutritional Analysis Market by Parameter
11.3.2.2 Western Europe Nutritional Analysis Market by Product Type
11.3.2.3 Western Europe Nutritional Analysis Market by Objective
11.3.2.4 Germany
11.3.2.4.1 Germany Nutritional Analysis Market by Parameter
11.3.2.4.2 Germany Nutritional Analysis Market by Product Type
11.3.2.4.3 Germany Nutritional Analysis Market by Objective
11.3.2.5 France
11.3.2.5.1 France Nutritional Analysis Market by Parameter
11.3.2.5.2 France Nutritional Analysis Market by Product Type
11.3.2.5.3 France Nutritional Analysis Market by Objective
11.3.2.6 UK
11.3.2.6.1 UK Nutritional Analysis Market by Parameter
11.3.2.6.2 UK Nutritional Analysis Market by Product Type
11.3.2.6.3 UK Nutritional Analysis Market by Objective
11.3.2.7 Italy
11.3.2.7.1 Italy Nutritional Analysis Market by Parameter
11.3.2.7.2 Italy Nutritional Analysis Market by Product Type
11.3.2.7.3 Italy Nutritional Analysis Market by Objective
11.3.2.8 Spain
11.3.2.8.1 Spain Nutritional Analysis Market by Parameter
11.3.2.8.2 Spain Nutritional Analysis Market by Product Type
11.3.2.8.3 Spain Nutritional Analysis Market by Objective
11.3.2.9 Netherlands
11.3.2.9.1 Netherlands Nutritional Analysis Market by Parameter
11.3.2.9.2 Netherlands Nutritional Analysis Market by Product Type
11.3.2.9.3 Netherlands Nutritional Analysis Market by Objective
11.3.2.10 Switzerland
11.3.2.10.1 Switzerland Nutritional Analysis Market by Parameter
11.3.2.10.2 Switzerland Nutritional Analysis Market by Product Type
11.3.2.10.3 Switzerland Nutritional Analysis Market by Objective
11.3.2.11.1 Austria
11.3.2.11.2 Austria Nutritional Analysis Market by Parameter
11.3.2.11.3 Austria Nutritional Analysis Market by Product Type
11.3.2.11.4 Austria Nutritional Analysis Market by Objective
11.3.2.12 Rest of Western Europe
11.3.2.12.1 Rest of Western Europe Nutritional Analysis Market by Parameter
11.3.2.12.2 Rest of Western Europe Nutritional Analysis Market by Product Type
11.3.2.12.3 Rest of Western Europe Nutritional Analysis Market by Objective
11.4 Asia-Pacific
11.4.1 Asia-Pacific Nutritional Analysis Market by Country
11.4.2 Asia-Pacific Nutritional Analysis Market by Parameter
11.4.3 Asia-Pacific Nutritional Analysis Market by Product Type
11.4.4 Asia-Pacific Nutritional Analysis Market by Objective
11.4.5 China
11.4.5.1 China Nutritional Analysis Market by Parameter
11.4.5.2 China Nutritional Analysis Market by Objective
11.4.5.3 China Nutritional Analysis Market by Product Type
11.4.6 India
11.4.6.1 India Nutritional Analysis Market by Parameter
11.4.6.2 India Nutritional Analysis Market by Product Type
11.4.6.3 India Nutritional Analysis Market by Objective
11.4.7 Japan
11.4.7.1 Japan Nutritional Analysis Market by Parameter
11.4.7.2 Japan Nutritional Analysis Market by Product Type
11.4.7.3 Japan Nutritional Analysis Market by Objective
11.4.8 South Korea
11.4.8.1 South Korea Nutritional Analysis Market by Parameter
11.4.8.2 South Korea Nutritional Analysis Market by Product Type
11.4.8.3 South Korea Nutritional Analysis Market by Objective
11.4.9 Vietnam
11.4.9.1 Vietnam Nutritional Analysis Market by Parameter
11.4.9.2 Vietnam Nutritional Analysis Market by Product Type
11.4.9.3 Vietnam Nutritional Analysis Market by Objective
11.4.10 Singapore
11.4.10.1 Singapore Nutritional Analysis Market by Parameter
11.4.10.2 Singapore Nutritional Analysis Market by Product Type
11.4.10.3 Singapore Nutritional Analysis Market by Objective
11.4.11 Australia
11.4.11.1 Australia Nutritional Analysis Market by Parameter
11.4.11.2 Australia Nutritional Analysis Market by Product Type
11.4.11.3 Australia Nutritional Analysis Market by Objective
11.4.12 Rest of Asia-Pacific
11.4.12.1 Rest of Asia-Pacific Nutritional Analysis Market by Parameter
11.4.12.2 Rest of Asia-Pacific Nutritional Analysis Market by Product Type
11.4.12.3 Rest of Asia-Pacific Nutritional Analysis Market by Objective
11.5 Middle East & Africa
11.5.1 Middle East
11.5.1.1 Middle East Nutritional Analysis Market by Country
11.5.1.2 Middle East Nutritional Analysis Market by Parameter
11.5.1.3 Middle East Nutritional Analysis Market by Product Type
11.5.1.4 Middle East Nutritional Analysis Market by Objective
11.5.1.5 UAE
11.5.1.5.1 UAE Nutritional Analysis Market by Parameter
11.5.1.5.2 UAE Nutritional Analysis Market by Product Type
11.5.1.5.3 UAE Nutritional Analysis Market by Objective
11.5.1.6 Egypt
11.5.1.6.1 Egypt Nutritional Analysis Market by Parameter
11.5.1.6.2 Egypt Nutritional Analysis Market by Product Type
11.5.1.6.3 Egypt Nutritional Analysis Market by Objective
11.5.1.7 Saudi Arabia
11.5.1.7.1 Saudi Arabia Nutritional Analysis Market by Parameter
11.5.1.7.2 Saudi Arabia Nutritional Analysis Market by Product Type
11.5.1.7.3 Saudi Arabia Nutritional Analysis Market by Objective
11.5.1.8 Qatar
11.5.1.8.1 Qatar Nutritional Analysis Market by Parameter
11.5.1.8.2 Qatar Nutritional Analysis Market by Product Type
11.5.1.8.3 Qatar Nutritional Analysis Market by Objective
11.5.1.9 Rest of Middle East
11.5.1.9.1 Rest of Middle East Nutritional Analysis Market by Parameter
11.5.1.9.2 Rest of Middle East Nutritional Analysis Market by Product Type
11.5.1.9.3 Rest of Middle East Nutritional Analysis Market by Objective
11.5.2 Africa
11.5.2.1 Africa Transfusion Diagnostics Market by Country
11.5.2.2 Africa Nutritional Analysis Market by Parameter
11.5.2.3 Africa Nutritional Analysis Market by Product Type
11.5.2.4 Africa Nutritional Analysis Market by Objective
11.5.2.5 Nigeria
11.5.2.5.1 Nigeria Nutritional Analysis Market by Parameter
11.5.2.5.2 Nigeria Nutritional Analysis Market by Product Type
11.5.2.5.3 Nigeria Nutritional Analysis Market by Objective
11.5.2.6 South Africa
11.5.2.6.1 South Africa Nutritional Analysis Market by Parameter
11.5.2.6.2 South Africa Nutritional Analysis Market by Product Type
11.5.2.6.3 South Africa Nutritional Analysis Market by Objective
11.5.2.7 Rest of Africa
11.5.2.7.1 Rest of Africa Nutritional Analysis Market by Parameter
11.5.2.7.2 Rest of Africa Nutritional Analysis Market by Product Type
11.5.2.7.3 Rest of Africa Nutritional Analysis Market by Objective
11.6 Latin America
11.6.1 Latin America Nutritional Analysis Market by Country
11.6.2 Latin America Nutritional Analysis Market by Parameter
11.6.3 Latin America Nutritional Analysis Market by Product Type
11.6.4 Latin America Nutritional Analysis Market by Objective
11.6.5 Brazil
11.6.5.1 Brazil Nutritional Analysis Market by Parameter
11.6.5.2 Brazil Nutritional Analysis Market by Product Type
11.6.5.3 Brazil Nutritional Analysis Market by Objective
11.6.6 Argentina
11.6.6.1 Argentina Nutritional Analysis Market by Parameter
11.6.6.2 Argentina Nutritional Analysis Market by Product Type
11.6.6.3 Argentina Nutritional Analysis Market by Objective
11.6.7 Colombia
11.6.7.1 Colombia Nutritional Analysis Market by Parameter
11.6.7.2 Colombia Nutritional Analysis Market by Product Type
11.6.7.3 Colombia Nutritional Analysis Market by Objective
11.6.8 Rest of Latin America
11.6.8.1 Rest of Latin America Nutritional Analysis Market by Parameter
11.6.8.2 Rest of Latin America Nutritional Analysis Market by Product Type
11.6.8.3 Rest of Latin America Nutritional Analysis Market by Objective
12. Company profile
12.1 ALS Limited
12.1.1 Company Overview
12.1.2 Financial
12.1.3 Products/ Services Offered
12.1.4 SWOT Analysis
12.1.5 The SNS View
12.2 TUV SUD AG
12.2.1 Company Overview
12.2.2 Financials
12.2.3 Product/Services Offered
12.2.4 SWOT Analysis
12.2.5 The SNS View
12.3 Eurofins Scientific
12.3.1 Company Overview
12.3.2 Financials
12.3.3 Product/Services Offered
12.3.4 SWOT Analysis
12.3.5 The SNS View
12.4 Lifeasible
12.4.1 Company Overview
12.4.2 Financials
12.4.3 Product/Services Offered
12.4.4 SWOT Analysis
12.4.5 The SNS View
12.5 Pat-Chem Laboratories LLC
12.5.1 Company Overview
12.5.2 Financials
12.5.3 Product/Services Offered
12.5.4 SWOT Analysis
12.5.5 The SNS View
12.6 SGS SA
12.6.1 Company Overview
12.6.2 Financials
12.6.3 Product/Services Offered
12.6.4 SWOT Analysis
12.6.5 The SNS View
12.7 Microbac Laboratories, Inc
12.7.1 Company Overview
12.7.2 Financials
12.7.3 Product/Services Offered
12.7.4 SWOT Analysis
12.7.5 The SNS View
12.8 Intertek Group Plc
12.8.1 Company Overview
12.8.2 Financials
12.8.3 Product/Services Offered
12.8.4 SWOT Analysis
12.8.5 The SNS View
12.9 Opal Research and Analytical Services, Plc
12.9.1 Company Overview
12.9.2 Financials
12.9.3 Product/Services Offered
12.9.4 SWOT Analysis
12.9.5 The SNS View
12.10 Compu-Food Analysis
12.10.1 Company Overview
12.10.2 Financials
12.10.3 Product/Services Offered
12.10.4 SWOT Analysis
12.10.5 The SNS View
13. Competitive Landscape
13.1 Competitive Benchmarking
13.2 Market Share Analysis
13.3 Recent Developments
13.3.1 Industry News
13.3.2 Company News
13.3.3 Mergers & Acquisitions
14. Use Case and Best Practices
15. Conclusion
An accurate research report requires proper strategizing as well as implementation. There are multiple factors involved in the completion of good and accurate research report and selecting the best methodology to compete the research is the toughest part. Since the research reports we provide play a crucial role in any company’s decision-making process, therefore we at SNS Insider always believe that we should choose the best method which gives us results closer to reality. This allows us to reach at a stage wherein we can provide our clients best and accurate investment to output ratio.
Each report that we prepare takes a timeframe of 350-400 business hours for production. Starting from the selection of titles through a couple of in-depth brain storming session to the final QC process before uploading our titles on our website we dedicate around 350 working hours. The titles are selected based on their current market cap and the foreseen CAGR and growth.
The 5 steps process:
Step 1: Secondary Research:
Secondary Research or Desk Research is as the name suggests is a research process wherein, we collect data through the readily available information. In this process we use various paid and unpaid databases which our team has access to and gather data through the same. This includes examining of listed companies’ annual reports, Journals, SEC filling etc. Apart from this our team has access to various associations across the globe across different industries. Lastly, we have exchange relationships with various university as well as individual libraries.
Step 2: Primary Research
When we talk about primary research, it is a type of study in which the researchers collect relevant data samples directly, rather than relying on previously collected data. This type of research is focused on gaining content specific facts that can be sued to solve specific problems. Since the collected data is fresh and first hand therefore it makes the study more accurate and genuine.
We at SNS Insider have divided Primary Research into 2 parts.
Part 1 wherein we interview the KOLs of major players as well as the upcoming ones across various geographic regions. This allows us to have their view over the market scenario and acts as an important tool to come closer to the accurate market numbers. As many as 45 paid and unpaid primary interviews are taken from both the demand and supply side of the industry to make sure we land at an accurate judgement and analysis of the market.
This step involves the triangulation of data wherein our team analyses the interview transcripts, online survey responses and observation of on filed participants. The below mentioned chart should give a better understanding of the part 1 of the primary interview.
Part 2: In this part of primary research the data collected via secondary research and the part 1 of the primary research is validated with the interviews from individual consultants and subject matter experts.
Consultants are those set of people who have at least 12 years of experience and expertise within the industry whereas Subject Matter Experts are those with at least 15 years of experience behind their back within the same space. The data with the help of two main processes i.e., FGDs (Focused Group Discussions) and IDs (Individual Discussions). This gives us a 3rd party nonbiased primary view of the market scenario making it a more dependable one while collation of the data pointers.
Step 3: Data Bank Validation
Once all the information is collected via primary and secondary sources, we run that information for data validation. At our intelligence centre our research heads track a lot of information related to the market which includes the quarterly reports, the daily stock prices, and other relevant information. Our data bank server gets updated every fortnight and that is how the information which we collected using our primary and secondary information is revalidated in real time.
Step 4: QA/QC Process
After all the data collection and validation our team does a final level of quality check and quality assurance to get rid of any unwanted or undesired mistakes. This might include but not limited to getting rid of the any typos, duplication of numbers or missing of any important information. The people involved in this process include technical content writers, research heads and graphics people. Once this process is completed the title gets uploader on our platform for our clients to read it.
Step 5: Final QC/QA Process:
This is the last process and comes when the client has ordered the study. In this process a final QA/QC is done before the study is emailed to the client. Since we believe in giving our clients a good experience of our research studies, therefore, to make sure that we do not lack at our end in any way humanly possible we do a final round of quality check and then dispatch the study to the client.
The Dietary Supplements Market size was USD 164.81 billion by 2022 with CAGR 8.5% from 2023 to 2030 and reach USD 316.53 Billion by 2030.
Liquid Flavor Market Size was esteemed at USD 12.06 billion out of 2022 and is supposed to arrive at USD 18.77 billion by 2030, and develop at a CAGR of 5.68% over the forecast period 2023-2030.
The Corn Grit Market size was USD 881.23 million in 2023, is expected to Reach USD 1439.01 million by 2032, and grow at a CAGR of 5.6% over the forecast period of 2024-2032.
The Organic Chocolate Spreads Market Size was esteemed at USD 592.27 billion out of 2022 and is supposed to arrive at USD 894.48 billion by 2030 and develop at a CAGR of 5.2% over the forecast period 2023-2030.
The Kava Root Extract Market size was USD 1.24 billion in 2023 and is expected to Reach USD 4.68 billion by 2032 and grow at a CAGR of 15.9 % over the forecast period of 2024-2032.
Lecithin Market Size was esteemed at USD 586.28 million out of 2022 and is supposed to arrive at USD 1105.4 million by 2030, and develop at a CAGR of 8.25% over the forecast period 2023-2030.
Hi! Click one of our member below to chat on Phone