image

Nutrigenomics Market Size & Growth Overview:
Nutrigenomics Market Revenue Analysis

To Get More Information on Nutrigenomics Market - Request Sample Report

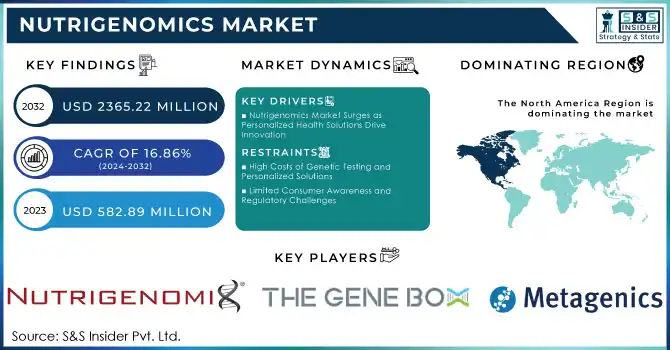
The Nutrigenomics Market Size valued at USD 582.89 million in 2023 and is projected to reach USD 2365.22 million by 2032, with a growing CAGR of 16.86% during the forecast period of 2024-2032.

The nutrigenomics market is witnessing significant growth as it revolutionizes the intersection of nutrition and genetics. This innovative field tailors dietary recommendations based on individual genetic profiles, offering personalized strategies to prevent and manage chronic conditions like obesity, diabetes, and cardiovascular diseases. Studies have revealed how genetic variations, such as those in the FTO and APOA2 genes, impact metabolism and dietary responses, highlighting the potential of nutrigenomics in addressing unique nutritional needs.

The surge in chronic diseases has increased demand for preventive healthcare solutions, making nutrigenomics pivotal in reshaping health management. Functional foods and supplements form a significant part of this market, enabling consumers to target specific health goals. For instance, omega-3 supplements are recommended for individuals with certain inflammation-related genetic markers. The integration of artificial intelligence and big data analytics has further propelled the market, offering precise insights into gene-diet interactions and enabling the development of effective nutritional strategies.

Collaborations between healthcare providers, research institutions, and nutrigenomics companies are accelerating advancements in the field. Research emphasizes that nutrigenomics enhances individual health outcomes and has implications for public health policies, especially in mitigating risks associated with non-communicable diseases.

As consumer awareness about personalized wellness grows and technological innovations continue to drive deeper genetic insights, nutrigenomics is emerging as a cornerstone of preventative and precision healthcare. This dynamic market is poised to transform the global health landscape by enabling individuals to make informed dietary choices tailored to their genetic makeup.

Market Dynamics

Drivers

  • Nutrigenomics Market Surges as Personalized Health Solutions Drive Innovation

The nutrigenomics market is propelled by rising consumer awareness of personalized health solutions and the growing prevalence of chronic diseases such as obesity, diabetes, and cardiovascular disorders. Advances in genomic research and technologies like AI and machine learning have made genetic testing more accessible and precise, enabling tailored dietary recommendations. Functional foods and supplements aligned with genetic insights have gained traction, driven by the increasing demand for preventive healthcare solutions.

The global shift toward precision medicine and wellness also drives the market. Nutrigenomics offers unique opportunities to address lifestyle-related disorders by identifying genetic markers that influence nutrient absorption and metabolism. For example, individuals with variations in the MTHFR gene benefit from folate-rich diets, showcasing the potential for targeted interventions.

Collaborations between nutrigenomics companies, healthcare providers, and research institutions are expanding the adoption of these technologies while growing investments in research and development accelerate innovation. Consumer preferences for evidence-based dietary solutions and the integration of big data analytics further enhance the market's growth prospects.

In addition, government and institutional initiatives, such as strategic plans from organizations like the NIH, support advancements in nutritional genomics to tackle public health challenges. These factors collectively drive the expansion of the nutrigenomics market, positioning it as a transformative force in healthcare.

Restraints

  • High Costs of Genetic Testing and Personalized Solutions

The expense associated with genetic testing and customized dietary recommendations limits accessibility, particularly in developing regions with lower disposable incomes.

  • Limited Consumer Awareness and Regulatory Challenges

A lack of widespread understanding of nutrigenomics and varying global regulatory standards for genetic testing and functional foods hinder market growth.

Segmentation Insights

By Product

The Reagents & Kits segment dominated the nutrigenomics market in 2023, holding a significant market share of approximately 60.0%. Reagents and kits are essential components in the genetic testing process, providing the tools needed to extract, analyze, and interpret genetic material from biological samples. These products are crucial for both clinical and research applications, enabling the identification of genetic variations that influence an individual’s nutritional needs. The widespread use of these reagents and kits in hospitals, clinics, and research institutions for genetic testing contributes to their dominant position in the market. As the demand for personalized nutrition and precision health solutions increases, the role of reagents and kits remains fundamental to the nutrigenomics industry.

The Services segment, including genetic counseling and personalized nutrition services, is experiencing rapid growth. This growth is driven by an increasing consumer demand for tailored health solutions, as more individuals seek personalized nutrition based on genetic testing results. As advancements in genomics and genetic testing make these services more accessible, healthcare providers and research institutions are expanding their offerings in this area. Services such as genetic testing consultations, customized diet planning, and continuous monitoring are expected to witness significant growth, making this segment the fastest growing in the nutrigenomics market. Projected to grow at a CAGR of 11%, this segment's expansion is a response to the global shift toward precision health and wellness.

By Application

The Obesity application dominated the nutrigenomics market in 2023, accounting for approximately 35.0% of the market share. Obesity is a growing global concern, with increasing prevalence linked to lifestyle choices, genetic predispositions, and environmental factors. Nutrigenomics plays a vital role in addressing this issue by offering personalized dietary recommendations based on genetic analysis. By identifying genes involved in metabolism, appetite regulation, and fat storage, nutrigenomics allows for more effective and individualized interventions. As consumers and healthcare providers focus more on personalized health and preventive measures, the obesity segment continues to lead the market.

The Cardiovascular Diseases application is the fastest growing in the nutrigenomics market. With the rising global incidence of cardiovascular diseases, there is a heightened focus on early diagnosis and personalized prevention strategies. Nutrigenomics provides valuable insights into genetic variations that influence heart health, such as those affecting cholesterol levels, blood pressure, and inflammation. By offering tailored dietary recommendations and lifestyle changes based on genetic profiles, nutrigenomics is increasingly used to manage and prevent cardiovascular risk factors. This segment is expected to grow at a CAGR of 12%, driven by the growing demand for precision medicine in the prevention and management of heart disease.

Regional Analysis

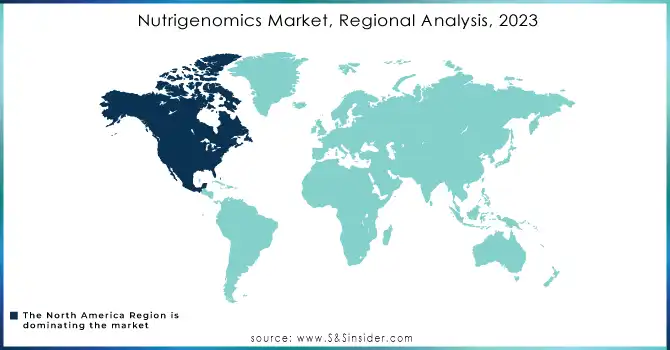
The North American region was the leading market for nutrigenomics, holding a substantial share of the global market in 2023. This dominance is fueled by the widespread adoption of personalized health solutions, significant advancements in genomic research, and a robust healthcare infrastructure. The United States plays a key role in this growth, driven by a rising consumer demand for preventive healthcare and genetic testing services. Factors such as high disposable incomes, increasing awareness of health issues like obesity and cardiovascular diseases, and the presence of prominent nutrigenomics companies contribute to the region's growth. North America is expected to continue its leadership in the coming years, supported by ongoing innovation, strategic partnerships, and substantial investments in research and development.

Europe followed closely behind, with countries like Germany, the UK, and France at the forefront of the market. The region's nutrigenomics market is driven by growing consumer interest in personalized nutrition and the support of government initiatives that promote the integration of genomics into healthcare. Additionally, the increasing demand for functional foods and supplements, that offer preventive health benefits, is helping to expand the market. As European consumers increasingly prioritize health and wellness, the market is projected to experience steady growth.

The Asia-Pacific region is emerging as the fastest-growing market for nutrigenomics, driven by heightened healthcare awareness, the rising prevalence of lifestyle-related diseases, and broader access to genetic testing. Countries such as China, India, and Japan are seeing a surge in demand for nutrigenomics services, spurred by an expanding, health-conscious population. The rapid urbanization and growing middle class in this region are expected to fuel the sector's growth in the years ahead.
Nutrigenomics Market, Regional Analysis, 2023
Need Any Customization Research On Nutrigenomics Market - Inquiry Now

Key Nutrigenomics Companies

  • Nutrigenomix DNAfit Nutrigenomics Testing, Genetic Testing for Personalized Nutrition

  • The Gene Box - Gene Box Health Report, Nutrigenomics Test

  • Metagenics - DNA Methylation Support, Nutrigenomic Testing Panels

  • Xcode Life - Genetic Nutrition Reports, DNA-based Weight Loss & Diet Plan

  • GX Sciences, LLC (Fagron) - Nutrigenomic Testing Kit, DNA-based Personalized Health & Wellness Reports

  • Cura Integrative Medicine - Nutrigenomic Test for Personalized Wellness

  • dnalife - DNA Test for Personalized Health, Nutrigenomics Reports

  • Genova Diagnostics (GDX) - Nutrigenomic Health Panel, Genetic Health Profile

  • HOLISTIC HEALTH INTERNATIONAL, LLC - Genetic Health Reports, Personalized Nutrigenomics Testing

  • Vitagene - DNA Test for Personalized Nutrition, Custom Supplement Plan

  • Mapmygenome - Genomepatri (Genomic Health Report), MyGenome Report

  • Gini Health - Personalized Health Reports, Nutritional DNA Reports

  • geneOmbio - Genetic Health Testing, DNA Reports for Personalized Nutrition

  • 23andMe Inc. - Health + Ancestry DNA Test, Personalized Health Reports

  • DNAfit - DNAfit Nutritional Testing, Fitness & Diet Reports

  • GX Sciences Inc. - Nutrigenomic Health Tests, Customized Nutrition Recommendations

Recent Developments

In June 2023, Xcode Life launched the Gene Nutrition Test, which covers nearly 50 aspects of nutrition. This test helps individuals understand how their genes affect metabolism, nutrient absorption, and food sensitivities, providing personalized and credible nutrition recommendations tailored to their unique genetic profile.

In June 2023, GX Sciences partnered with GetHairMD to offer personalized hair loss solutions, leveraging genetic insights for targeted treatments. This collaboration aims to provide customized solutions based on individual genetic profiles, enhancing the effectiveness of hair loss management strategies.

Nutrigenomics Market Report Scope:

Report Attributes Details
Market Size in 2023 US$ 582.89 Million 
Market Size by 2032 US$ 2365.22 Million 
CAGR CAGR of 16.86% From 2024 to 2032
Base Year 2023
Forecast Period 2024-2032
Historical Data 2020-2022
Report Scope & Coverage Market Size, Segments Analysis, Competitive  Landscape, Regional Analysis, DROC & SWOT Analysis, Forecast Outlook
Key Segments • By Product (Reagents & Kits, Services)
• By Application (Obesity, Cardiovascular Diseases, Cancer Research, Others)
• By Technique (Saliva, Buccal Swab, Blood)
• By End Use (Hospitals & Clinics, Others)
Regional Analysis/Coverage North America (US, Canada, Mexico), Europe (Eastern Europe [Poland, Romania, Hungary, Turkey, Rest of Eastern Europe] Western Europe] Germany, France, UK, Italy, Spain, Netherlands, Switzerland, Austria, Rest of Western Europe]), Asia Pacific (China, India, Japan, South Korea, Vietnam, Singapore, Australia, Rest of Asia Pacific), Middle East & Africa (Middle East [UAE, Egypt, Saudi Arabia, Qatar, Rest of Middle East], Africa [Nigeria, South Africa, Rest of Africa], Latin America (Brazil, Argentina, Colombia, Rest of Latin America)
Company Profiles Nutrigenomix, The Gene Box, Metagenics, Xcode Life, GX Sciences, LLC (Fagron), Cura Integrative Medicine, dnalife, Genova Diagnostics (GDX), HOLISTIC HEALTH INTERNATIONAL, LLC, Vitagene, Mapmygenome, Gini Health, geneOmbio, 23andMe Inc., DNAfit, GX Sciences Inc.
Key Drivers • Nutrigenomics Market Surges as Personalized Health Solutions Drive Innovation
Restraints • High Costs of Genetic Testing and Personalized Solutions
• Limited Consumer Awareness and Regulatory Challenges

Frequently Asked Questions

Ans: Massive Potential for Extraordinary Profits from Risky Investments.

Ans: Personalized medicine market size was valued at USD 582.89 million in 2023.

Ans: The nutrigenomics market is expected to grow to USD 2365.22 million by 2032.

Ans: Nutrigenomics market is anticipated to expand by 16.86% from 2024 to 2032.

Ans: North America segment is expected to held the highest market share in 2024.

Table of Contents

1. Introduction

1.1 Market Definition

1.2 Scope (Inclusion and Exclusions)

1.3 Research Assumptions

2. Executive Summary

2.1 Market Overview

2.2 Regional Synopsis

2.3 Competitive Summary

3. Research Methodology

3.1 Top-Down Approach

3.2 Bottom-up Approach

3.3. Data Validation

3.4 Primary Interviews

4. Market Dynamics Impact Analysis

4.1 Market Driving Factors Analysis

4.1.1 Drivers

4.1.2 Restraints

4.1.3 Opportunities

4.1.4 Challenges

4.2 PESTLE Analysis

4.3 Porter’s Five Forces Model

5. Statistical Insights and Trends Reporting

5.1 Incidence and Prevalence of Nutritional Disorders (2023)

5.2 Consumer Adoption and Prescription Trends (2023) by Region

5.3 Device Volume and Nutrigenomic Testing, by Region (2020-2032)

5.4 Healthcare Spending on Nutrigenomics (by Region, Government, Commercial, Private, Out-of-Pocket), 2023

6. Competitive Landscape

6.1 List of Major Companies, By Region

6.2 Market Share Analysis, By Region

6.3 Product Benchmarking

6.3.1 Product specifications and features

6.3.2 Pricing

6.4 Strategic Initiatives

6.4.1 Marketing and promotional activities

6.4.2 Distribution and Supply Chain Strategies

6.4.3 Expansion plans and new product launches

6.4.4 Strategic partnerships and collaborations

6.5 Technological Advancements

6.6 Market Positioning and Branding

7. Nutrigenomics Market Segmentation, by Product

 7.1 Chapter Overview

 7.2 Reagents & Kits

    7.2.1 Reagents & Kits Market Trends Analysis (2020-2032)

    7.2.2 Reagents & Kits Market Size Estimates and Forecasts to 2032 (USD Million)

 7.3 Services

   7.3.1 Services Market Trends Analysis (2020-2032)

   7.3.2 Services Market Size Estimates and Forecasts to 2032 (USD Million)

8. Nutrigenomics Market Segmentation, By Application

8.1 Chapter Overview

  8.2 Obesity

8.2.1 Obesity Market Trends Analysis (2020-2032)

8.2.2 Obesity Market Size Estimates and Forecasts to 2032 (USD Million)

  8.3 Cardiovascular Diseases

8.3.1 Cardiovascular Diseases Market Trends Analysis (2020-2032)

8.3.2 Cardiovascular Diseases Market Size Estimates And Forecasts To 2032 (USD Million)

 8.4 Cancer Research

8.4.1 Cancer Research Market Trends Analysis (2020-2032)

8.4.2 Cancer Research Market Size Estimates And Forecasts To 2032 (USD Million)

8.5 Others

8.5.1 Others Market Trends Analysis (2020-2032)

8.5.2 Others Market Size Estimates And Forecasts To 2032 (USD Million)

9. Nutrigenomics Market Segmentation, by Technique

 9.1 Chapter Overview

 9.2 Saliva

   9.2.1 Saliva Market Trends Analysis (2020-2032)

9.2.2 Saliva Market Size Estimates and Forecasts to 2032 (USD Million)

 9.3 Buccal Swab

   9.3.1 Buccal Swab Market Trends Analysis (2020-2032)

9.3.2 Buccal Swab Market Size Estimates and Forecasts to 2032 (USD Million)

9.4 Blood

   9.4.1 Blood Market Trends Analysis (2020-2032)

9.4.2 Blood Market Size Estimates and Forecasts to 2032 (USD Million)

10. Nutrigenomics Market Segmentation, By End-use

10.1 Chapter Overview

  10.2 Hospitals & Clinics

10.2.1 Hospitals & Clinics Market Trends Analysis (2020-2032)

10.2.2 Hospitals & Clinics Market Size Estimates and Forecasts to 2032 (USD Million)

 10.3 Others

10.3.1 Others Market Trends Analysis (2020-2032)

10.3.2 Others Market Size Estimates and Forecasts to 2032 (USD Million)

11. Regional Analysis

11.1 Chapter Overview

11.2 North America

11.2.1 Trends Analysis

11.2.2 North America Nutrigenomics Market Estimates and Forecasts, by Country (2020-2032) (USD Million)

11.2.3 North America Nutrigenomics Market Estimates and Forecasts, by Product (2020-2032) (USD Million)

11.2.4 North America Nutrigenomics Market Estimates and Forecasts, By Application (2020-2032) (USD Million)

11.2.5 North America Nutrigenomics Market Estimates and Forecasts, by Technique (2020-2032) (USD Million)

11.2.6 North America Nutrigenomics Market Estimates and Forecasts, By End-use (2020-2032) (USD Million)

11.2.7 USA

11.2.7.1 USA Nutrigenomics Market Estimates and Forecasts, by Product (2020-2032) (USD Million)

11.2.7.2 USA Nutrigenomics Market Estimates and Forecasts, By Application (2020-2032) (USD Million)

11.2.7.3 USA Nutrigenomics Market Estimates and Forecasts, by Technique (2020-2032) (USD Million)

11.2.7.4 USA Nutrigenomics Market Estimates and Forecasts, By End-use (2020-2032) (USD Million)

11.2.8 Canada

11.2.8.1 Canada Nutrigenomics Market Estimates and Forecasts, by Product (2020-2032) (USD Million)

11.2.8.2 Canada Nutrigenomics Market Estimates and Forecasts, By Application (2020-2032) (USD Million)

11.2.8.3 Canada Nutrigenomics Market Estimates and Forecasts, by Technique (2020-2032) (USD Million)

11.2.8.4 Canada Nutrigenomics Market Estimates and Forecasts, By End-use (2020-2032) (USD Million)

11.2.9 Mexico

11.2.9.1 Mexico Nutrigenomics Market Estimates and Forecasts, by Product (2020-2032) (USD Million)

11.2.9.2 Mexico Nutrigenomics Market Estimates and Forecasts, By Application (2020-2032) (USD Million)

11.2.9.3 Mexico Nutrigenomics Market Estimates and Forecasts, by Technique (2020-2032) (USD Million)

11.2.9.4 Mexico Nutrigenomics Market Estimates and Forecasts, By End-use (2020-2032) (USD Million

11.3 Europe

11.3.1 Eastern Europe

11.3.1.1 Trends Analysis

11.3.1.2 Eastern Europe Nutrigenomics Market Estimates and Forecasts, by Country (2020-2032) (USD Million)

11.3.1.3 Eastern Europe Nutrigenomics Market Estimates and Forecasts, by Product (2020-2032) (USD Million)

11.3.1.4 Eastern Europe Nutrigenomics Market Estimates and Forecasts, By Application (2020-2032) (USD Million)

11.3.1.5 Eastern Europe Nutrigenomics Market Estimates and Forecasts, by Technique (2020-2032) (USD Million)

11.3.1.6 Eastern Europe Nutrigenomics Market Estimates and Forecasts, By End-use (2020-2032) (USD Million)

11.3.1.7 Poland

11.3.1.7.1 Poland Nutrigenomics Market Estimates and Forecasts, by Product (2020-2032) (USD Million)

11.3.1.7.2 Poland Nutrigenomics Market Estimates and Forecasts, By Application (2020-2032) (USD Million)

11.3.1.7.3 Poland Nutrigenomics Market Estimates and Forecasts, by Technique (2020-2032) (USD Million)

11.3.1.7.4 Poland Nutrigenomics Market Estimates and Forecasts, By End-use (2020-2032) (USD Million)

11.3.1.8 Romania

11.3.1.8.1 Romania Nutrigenomics Market Estimates and Forecasts, by Product (2020-2032) (USD Million)

11.3.1.8.2 Romania Nutrigenomics Market Estimates and Forecasts, By Application (2020-2032) (USD Million)

11.3.1.8.3 Romania Nutrigenomics Market Estimates and Forecasts, by Technique (2020-2032) (USD Million)

11.3.1.8.4 Romania Nutrigenomics Market Estimates and Forecasts, By End-use (2020-2032) (USD Million)

11.3.1.9 Hungary

11.3.1.9.1 Hungary Nutrigenomics Market Estimates and Forecasts, by Product (2020-2032) (USD Million)

11.3.1.9.2 Hungary Nutrigenomics Market Estimates and Forecasts, By Application (2020-2032) (USD Million)

11.3.1.9.3 Hungary Nutrigenomics Market Estimates and Forecasts, by Technique (2020-2032) (USD Million)

11.3.1.9.4 Hungary Nutrigenomics Market Estimates and Forecasts, By End-use (2020-2032) (USD Million)

11.3.1.10 Turkey

11.3.1.10.1 Turkey Nutrigenomics Market Estimates and Forecasts, by Product (2020-2032) (USD Million)

11.3.1.10.2 Turkey Nutrigenomics Market Estimates and Forecasts, By Application (2020-2032) (USD Million)

11.3.1.10.3 Turkey Nutrigenomics Market Estimates and Forecasts, by Technique (2020-2032) (USD Million)

11.3.1.10.4 Turkey Nutrigenomics Market Estimates and Forecasts, By End-use (2020-2032) (USD Million)

11.3.1.11 Rest of Eastern Europe

11.3.1.11.1 Rest of Eastern Europe Nutrigenomics Market Estimates and Forecasts, by Product (2020-2032) (USD Million)

11.3.1.11.2 Rest of Eastern Europe Nutrigenomics Market Estimates and Forecasts, By Application (2020-2032) (USD Million)

11.3.1.11.3 Rest of Eastern Europe Nutrigenomics Market Estimates and Forecasts, by Technique (2020-2032) (USD Million)

11.3.1.11.4 Rest of Eastern Europe Nutrigenomics Market Estimates and Forecasts, By End-use (2020-2032) (USD Million)

11.3.2 Western Europe

11.3.2.1 Trends Analysis

11.3.2.2 Western Europe Nutrigenomics Market Estimates and Forecasts, by Country (2020-2032) (USD Million)

11.3.2.3 Western Europe Nutrigenomics Market Estimates and Forecasts, by Product (2020-2032) (USD Million)

11.3.2.4 Western Europe Nutrigenomics Market Estimates and Forecasts, By Application (2020-2032) (USD Million)

11.3.2.5 Western Europe Nutrigenomics Market Estimates and Forecasts, by Technique (2020-2032) (USD Million)

11.3.2.6 Western Europe Nutrigenomics Market Estimates and Forecasts, By End-use (2020-2032) (USD Million)

11.3.2.7 Germany

11.3.2.7.1 Germany Nutrigenomics Market Estimates and Forecasts, by Product (2020-2032) (USD Million)

11.3.2.7.2 Germany Nutrigenomics Market Estimates and Forecasts, By Application (2020-2032) (USD Million)

11.3.2.7.3 Germany Nutrigenomics Market Estimates and Forecasts, by Technique (2020-2032) (USD Million)

11.3.2.7.4 Germany Nutrigenomics Market Estimates and Forecasts, By End-use (2020-2032) (USD Million)

11.3.2.8 France

11.3.2.8.1 France Nutrigenomics Market Estimates and Forecasts, by Product (2020-2032) (USD Million)

11.3.2.8.2 France Nutrigenomics Market Estimates and Forecasts, By Application (2020-2032) (USD Million)

11.3.2.8.3 France Nutrigenomics Market Estimates and Forecasts, by Technique (2020-2032) (USD Million)

11.3.2.8.4 France Nutrigenomics Market Estimates and Forecasts, By End-use (2020-2032) (USD Million)

11.3.2.9 UK

11.3.2.9.1 UK Nutrigenomics Market Estimates and Forecasts, by Product (2020-2032) (USD Million)

11.3.2.9.2 UK Nutrigenomics Market Estimates and Forecasts, By Application (2020-2032) (USD Million)

11.3.2.9.3 UK Nutrigenomics Market Estimates and Forecasts, by Technique (2020-2032) (USD Million)

11.3.2.9.4 UK Nutrigenomics Market Estimates and Forecasts, By End-use (2020-2032) (USD Million)

11.3.2.10 Italy

11.3.2.10.1 Italy Nutrigenomics Market Estimates and Forecasts, by Product (2020-2032) (USD Million)

11.3.2.10.2 Italy Nutrigenomics Market Estimates and Forecasts, By Application (2020-2032) (USD Million)

11.3.2.10.3 Italy Nutrigenomics Market Estimates and Forecasts, by Technique (2020-2032) (USD Million)

11.3.2.10.4 Italy Nutrigenomics Market Estimates and Forecasts, By End-use (2020-2032) (USD Million)

11.3.2.11 Spain

11.3.2.11.1 Spain Nutrigenomics Market Estimates and Forecasts, by Product (2020-2032) (USD Million)

11.3.2.11.2 Spain Nutrigenomics Market Estimates and Forecasts, By Application (2020-2032) (USD Million)

11.3.2.11.3 Spain Nutrigenomics Market Estimates and Forecasts, by Technique (2020-2032) (USD Million)

11.3.2.11.4 Spain Nutrigenomics Market Estimates and Forecasts, By End-use (2020-2032) (USD Million)

11.3.2.12 Netherlands

11.3.2.12.1 Netherlands Nutrigenomics Market Estimates and Forecasts, by Product (2020-2032) (USD Million)

11.3.2.12.2 Netherlands Nutrigenomics Market Estimates and Forecasts, By Application (2020-2032) (USD Million)

11.3.2.12.3 Netherlands Nutrigenomics Market Estimates and Forecasts, by Technique (2020-2032) (USD Million)

11.3.2.12.4 Netherlands Nutrigenomics Market Estimates and Forecasts, By End-use (2020-2032) (USD Million)

11.3.2.13 Switzerland

11.3.2.13.1 Switzerland Nutrigenomics Market Estimates and Forecasts, by Product (2020-2032) (USD Million)

11.3.2.13.2 Switzerland Nutrigenomics Market Estimates and Forecasts, By Application  (2020-2032) (USD Million)

11.3.2.13.3 Switzerland Nutrigenomics Market Estimates and Forecasts, by Technique (2020-2032) (USD Million)

11.3.2.13.4 Switzerland Nutrigenomics Market Estimates and Forecasts, By End-use (2020-2032) (USD Million)

11.3.2.14 Austria

11.3.2.14.1 Austria Nutrigenomics Market Estimates and Forecasts, by Product (2020-2032) (USD Million)

11.3.2.14.2 Austria Nutrigenomics Market Estimates and Forecasts, By Application  (2020-2032) (USD Million)

11.3.2.14.3 Austria Nutrigenomics Market Estimates and Forecasts, by Technique (2020-2032) (USD Million)

11.3.2.14.4 Austria Nutrigenomics Market Estimates and Forecasts, By End-use (2020-2032) (USD Million)

11.3.2.15 Rest of Western Europe

11.3.2.15.1 Rest of Western Europe Nutrigenomics Market Estimates and Forecasts, by Product (2020-2032) (USD Million)

11.3.2.15.2 Rest of Western Europe Nutrigenomics Market Estimates and Forecasts, By Application (2020-2032) (USD Million)

11.3.2.15.3 Rest of Western Europe Nutrigenomics Market Estimates and Forecasts, by Technique (2020-2032) (USD Million)

11.3.2.15.4 Rest of Western Europe Nutrigenomics Market Estimates and Forecasts, By End-use (2020-2032) (USD Million)

11.4 Asia Pacific

11.4.1 Trends Analysis

11.4.2 Asia Pacific Nutrigenomics Market Estimates and Forecasts, by Country (2020-2032) (USD Million)

11.4.3 Asia Pacific Nutrigenomics Market Estimates and Forecasts, by Product (2020-2032) (USD Million)

11.4.4 Asia Pacific Nutrigenomics Market Estimates and Forecasts, By Application (2020-2032) (USD Million)

11.4.5 Asia Pacific Nutrigenomics Market Estimates and Forecasts, by Technique (2020-2032) (USD Million)

11.4.6 Asia Pacific Nutrigenomics Market Estimates and Forecasts, By End-use (2020-2032) (USD Million)

11.4.7 China

11.4.7.1 China Nutrigenomics Market Estimates and Forecasts, by Product (2020-2032) (USD Million)

11.4.7.2 China Nutrigenomics Market Estimates and Forecasts, By Application (2020-2032) (USD Million)

11.4.7.3 China Nutrigenomics Market Estimates and Forecasts, by Technique (2020-2032) (USD Million)

11.4.7.4 China Nutrigenomics Market Estimates and Forecasts, By End-use (2020-2032) (USD Million)

11.4.8 India

11.4.8.1 India Nutrigenomics Market Estimates and Forecasts, by Product (2020-2032) (USD Million)

11.4.8.2 India Nutrigenomics Market Estimates and Forecasts, By Application (2020-2032) (USD Million)

11.4.8.3 India Nutrigenomics Market Estimates and Forecasts, by Technique (2020-2032) (USD Million)

11.4.8.4 India Nutrigenomics Market Estimates and Forecasts, By End-use (2020-2032) (USD Million)

11.4.9 Japan

11.4.9.1 Japan Nutrigenomics Market Estimates and Forecasts, by Product (2020-2032) (USD Million)

11.4.9.2 Japan Nutrigenomics Market Estimates and Forecasts, By Application (2020-2032) (USD Million)

11.4.9.3 Japan Nutrigenomics Market Estimates and Forecasts, by Technique (2020-2032) (USD Million)

11.4.9.4 Japan Nutrigenomics Market Estimates and Forecasts, By End-use (2020-2032) (USD Million)

11.4.10 South Korea

11.4.10.1 South Korea Nutrigenomics Market Estimates and Forecasts, by Product (2020-2032) (USD Million)

11.4.10.2 South Korea Nutrigenomics Market Estimates and Forecasts, By Application (2020-2032) (USD Million)

11.4.10.3 South Korea Nutrigenomics Market Estimates and Forecasts, by Technique (2020-2032) (USD Million)

11.4.10.4 South Korea Nutrigenomics Market Estimates and Forecasts, By End-use (2020-2032) (USD Million)

11.4.11 Vietnam

11.4.11.1 Vietnam Nutrigenomics Market Estimates and Forecasts, by Product (2020-2032) (USD Million)

11.4.11.2 Vietnam Nutrigenomics Market Estimates and Forecasts, By Application (2020-2032) (USD Million)

11.4.11.3 Vietnam Nutrigenomics Market Estimates and Forecasts, by Technique (2020-2032) (USD Million)

11.4.11.4 Vietnam Nutrigenomics Market Estimates and Forecasts, By End-use (2020-2032) (USD Million)

11.4.12 Singapore

11.4.12.1 Singapore Nutrigenomics Market Estimates and Forecasts, by Product (2020-2032) (USD Million)

11.4.12.2 Singapore Nutrigenomics Market Estimates and Forecasts, By Application (2020-2032) (USD Million)

11.4.12.3 Singapore Nutrigenomics Market Estimates and Forecasts, by Technique (2020-2032) (USD Million)

11.4.12.4 Singapore Nutrigenomics Market Estimates and Forecasts, By End-use (2020-2032) (USD Million)

11.4.13 Australia

11.4.13.1 Australia Nutrigenomics Market Estimates and Forecasts, by Product (2020-2032) (USD Million)

11.4.13.2 Australia Nutrigenomics Market Estimates and Forecasts, By Application (2020-2032) (USD Million)

11.4.13.3 Australia Nutrigenomics Market Estimates and Forecasts, by Technique (2020-2032) (USD Million)

11.4.13.4 Australia Nutrigenomics Market Estimates and Forecasts, By End-use (2020-2032) (USD Million)

11.4.14 Rest of Asia Pacific

11.4.14.1 Rest of Asia Pacific Nutrigenomics Market Estimates and Forecasts, by Product (2020-2032) (USD Million)

11.4.14.2 Rest of Asia Pacific Nutrigenomics Market Estimates and Forecasts, By Application (2020-2032) (USD Million)

11.4.14.3 Rest of Asia Pacific Nutrigenomics Market Estimates and Forecasts, by Technique (2020-2032) (USD Million)

11.4.14.4 Rest of Asia Pacific Nutrigenomics Market Estimates and Forecasts, By End-use (2020-2032) (USD Million)

11.5 Middle East and Africa

11.5.1 Middle East

11.5.1.1 Trends Analysis

11.5.1.2 Middle East Nutrigenomics Market Estimates and Forecasts, by Country (2020-2032) (USD Million)

11.5.1.3 Middle East Nutrigenomics Market Estimates and Forecasts, by Product (2020-2032) (USD Million)

11.5.1.4 Middle East Nutrigenomics Market Estimates and Forecasts, By Application (2020-2032) (USD Million)

11.5.1.5 Middle East Nutrigenomics Market Estimates and Forecasts, by Technique (2020-2032) (USD Million)

11.5.1.6 Middle East Nutrigenomics Market Estimates and Forecasts, By End-use (2020-2032) (USD Million)

11.5.1.7 UAE

11.5.1.7.1 UAE Nutrigenomics Market Estimates and Forecasts, by Product (2020-2032) (USD Million)

11.5.1.7.2 UAE Nutrigenomics Market Estimates and Forecasts, By Application (2020-2032) (USD Million)

11.5.1.7.3 UAE Nutrigenomics Market Estimates and Forecasts, by Technique (2020-2032) (USD Million)

11.5.1.7.4 UAE Nutrigenomics Market Estimates and Forecasts, By End-use (2020-2032) (USD Million)

11.5.1.8 Egypt

11.5.1.8.1 Egypt Nutrigenomics Market Estimates and Forecasts, by Product (2020-2032) (USD Million)

11.5.1.8.2 Egypt Nutrigenomics Market Estimates and Forecasts, By Application (2020-2032) (USD Million)

11.5.1.8.3 Egypt Nutrigenomics Market Estimates and Forecasts, by Technique (2020-2032) (USD Million)

11.5.1.8.4 Egypt Nutrigenomics Market Estimates and Forecasts, By End-use (2020-2032) (USD Million)

11.5.1.9 Saudi Arabia

11.5.1.9.1 Saudi Arabia Nutrigenomics Market Estimates and Forecasts, by Product (2020-2032) (USD Million)

11.5.1.9.2 Saudi Arabia Nutrigenomics Market Estimates and Forecasts, By Application (2020-2032) (USD Million)

11.5.1.9.3 Saudi Arabia Nutrigenomics Market Estimates and Forecasts, by Technique (2020-2032) (USD Million)

11.5.1.9.4 Saudi Arabia Nutrigenomics Market Estimates and Forecasts, By End-use (2020-2032) (USD Million)

11.5.1.10 Qatar

11.5.1.10.1 Qatar Nutrigenomics Market Estimates and Forecasts, by Product (2020-2032) (USD Million)

11.5.1.10.2 Qatar Nutrigenomics Market Estimates and Forecasts, By Application (2020-2032) (USD Million)

11.5.1.10.3 Qatar Nutrigenomics Market Estimates and Forecasts, by Technique (2020-2032) (USD Million)

11.5.1.10.4 Qatar Nutrigenomics Market Estimates and Forecasts, By End-use (2020-2032) (USD Million)

11.5.1.11 Rest of Middle East

11.5.1.11.1 Rest of Middle East Nutrigenomics Market Estimates and Forecasts, by Product (2020-2032) (USD Million)

11.5.1.11.2 Rest of Middle East Nutrigenomics Market Estimates and Forecasts, By Application (2020-2032) (USD Million)

11.5.1.11.3 Rest of Middle East Nutrigenomics Market Estimates and Forecasts, by Technique (2020-2032) (USD Million)

11.5.1.11.4 Rest of Middle East Nutrigenomics Market Estimates and Forecasts, By End-use (2020-2032) (USD Million)

11.5.2 Africa

11.5.2.1 Trends Analysis

11.5.2.2 Africa Nutrigenomics Market Estimates and Forecasts, by Country (2020-2032) (USD Million)

11.5.2.3 Africa Nutrigenomics Market Estimates and Forecasts, by Product (2020-2032) (USD Million)

11.5.2.4 Africa Nutrigenomics Market Estimates and Forecasts, By Application (2020-2032) (USD Million)

11.5.2.5 Africa Nutrigenomics Market Estimates and Forecasts, by Technique (2020-2032) (USD Million)

11.5.2.6 Africa Nutrigenomics Market Estimates and Forecasts, By End-use (2020-2032) (USD Million)

11.5.2.7 South Africa

11.5.2.7.1 South Africa Nutrigenomics Market Estimates and Forecasts, by Product (2020-2032) (USD Million)

11.5.2.7.2 South Africa Nutrigenomics Market Estimates and Forecasts, By Application (2020-2032) (USD Million)

11.5.2.7.3 South Africa Nutrigenomics Market Estimates and Forecasts, by Technique (2020-2032) (USD Million)

11.5.2.7.4 South Africa Nutrigenomics Market Estimates and Forecasts, By End-use (2020-2032) (USD Million)

11.5.2.8 Nigeria

11.5.2.8.1 Nigeria Nutrigenomics Market Estimates and Forecasts, by Product (2020-2032) (USD Million)

11.5.2.8.2 Nigeria Nutrigenomics Market Estimates and Forecasts, By Application (2020-2032) (USD Million)

11.5.2.8.3 Nigeria Nutrigenomics Market Estimates and Forecasts, by Technique (2020-2032) (USD Million)

11.5.2.8.4 Nigeria Nutrigenomics Market Estimates and Forecasts, By End-use (2020-2032) (USD Million)

11.5.2.9 Rest of Africa

11.5.2.9.1 Rest of Africa Nutrigenomics Market Estimates and Forecasts, by Product (2020-2032) (USD Million)

11.5.2.9.2 Rest of Africa Nutrigenomics Market Estimates and Forecasts, By Application (2020-2032) (USD Million)

11.5.2.9.3 Rest of Africa Nutrigenomics Market Estimates and Forecasts, by Technique (2020-2032) (USD Million)

11.5.2.9.4 Rest of Africa Nutrigenomics Market Estimates and Forecasts, By End-use (2020-2032) (USD Million)

11.6 Latin America

11.6.1 Trends Analysis

11.6.2 Latin America Nutrigenomics Market Estimates and Forecasts, by Country (2020-2032) (USD Million)

11.6.3 Latin America Nutrigenomics Market Estimates and Forecasts, by Product (2020-2032) (USD Million)

11.6.4 Latin America Nutrigenomics Market Estimates and Forecasts, By Application (2020-2032) (USD Million)

11.6.5 Latin America Nutrigenomics Market Estimates and Forecasts, by Technique (2020-2032) (USD Million)

11.6.6 Latin America Nutrigenomics Market Estimates and Forecasts, By End-use (2020-2032) (USD Million)

11.6.7 Brazil

11.6.7.1 Brazil Nutrigenomics Market Estimates and Forecasts, by Product (2020-2032) (USD Million)

11.6.7.2 Brazil Nutrigenomics Market Estimates and Forecasts, By Application (2020-2032) (USD Million)

11.6.7.3 Brazil Nutrigenomics Market Estimates and Forecasts, by Technique (2020-2032) (USD Million)

11.6.7.4 Brazil Nutrigenomics Market Estimates and Forecasts, By End-use (2020-2032) (USD Million)

11.6.8 Argentina

11.6.8.1 Argentina Nutrigenomics Market Estimates and Forecasts, by Product (2020-2032) (USD Million)

11.6.8.2 Argentina Nutrigenomics Market Estimates and Forecasts, By Application (2020-2032) (USD Million)

11.6.8.3 Argentina Nutrigenomics Market Estimates and Forecasts, by Technique (2020-2032) (USD Million)

11.6.8.4 Argentina Nutrigenomics Market Estimates and Forecasts, By End-use (2020-2032) (USD Million)

11.6.9 Colombia

11.6.9.1 Colombia Nutrigenomics Market Estimates and Forecasts, by Product (2020-2032) (USD Million)

11.6.9.2 Colombia Nutrigenomics Market Estimates and Forecasts, By Application (2020-2032) (USD Million)

11.6.9.3 Colombia Nutrigenomics Market Estimates and Forecasts, by Technique (2020-2032) (USD Million)

11.6.9.4 Colombia Nutrigenomics Market Estimates and Forecasts, By End-use (2020-2032) (USD Million)

11.6.10 Rest of Latin America

11.6.10.1 Rest of Latin America Nutrigenomics Market Estimates and Forecasts, by Product (2020-2032) (USD Million)

11.6.10.2 Rest of Latin America Nutrigenomics Market Estimates and Forecasts, By Application (2020-2032) (USD Million)

11.6.10.3 Rest of Latin America Nutrigenomics Market Estimates and Forecasts, by Technique (2020-2032) (USD Million)

11.6.10.4 Rest of Latin America Nutrigenomics Market Estimates and Forecasts, By End-use (2020-2032) (USD Million)

12. Company Profiles

12.1 Nutrigenomix

12.1.1 Company Overview

12.1.2 Financial

12.1.3 Products/ Services Offered

12.1.4 SWOT Analysis

12.2 The Gene Box

12.2.1 Company Overview

12.2.2 Financial

12.2.3 Products/ Services Offered

12.2.4 SWOT Analysis

12.3 Metagenics

  12.3.1 Company Overview

12.3.2 Financial

12.3.3 Products/ Services Offered

12.3.4 SWOT Analysis

12.4 Xcode Life

12.4.1 Company Overview

12.4.2 Financial

12.4.3 Products/ Services Offered

12.4.4 SWOT Analysis

12.5 Genova Diagnostics (GDX)

12.5.1 Company Overview

12.5.2 Financial

12.5.3 Products/ Services Offered

12.5.4 SWOT Analysis

12.6 23andMe Inc.

12.6.1 Company Overview

12.6.2 Financial

12.6.3 Products/ Services Offered

12.6.4 SWOT Analysis

12.7 GX Sciences Inc.

   12.7.1 Company Overview

12.7.2 Financial

12.7.3 Products/ Services Offered

12.7.4 SWOT Analysis

12.8 DNAfit

12.8.1 Company Overview

12.8.2 Financial

12.8.3 Products/ Services Offered

12.8.4 SWOT Analysis

12.9 HOLISTIC HEALTH INTERNATIONAL, LLC

12.9.1 Company Overview

12.9.2 Financial

12.9.3 Products/ Services Offered

12.9.4 SWOT Analysis

12.10 Vitagene

12.10.1 Company Overview

12.10.2 Financial

12.10.3 Products/ Services Offered

12.10.4 SWOT Analysis

13. Use Cases and Best Practices

14. Conclusio

An accurate research report requires proper strategizing as well as implementation. There are multiple factors involved in the completion of good and accurate research report and selecting the best methodology to compete the research is the toughest part. Since the research reports we provide play a crucial role in any company’s decision-making process, therefore we at SNS Insider always believe that we should choose the best method which gives us results closer to reality. This allows us to reach at a stage wherein we can provide our clients best and accurate investment to output ratio.

Each report that we prepare takes a timeframe of 350-400 business hours for production. Starting from the selection of titles through a couple of in-depth brain storming session to the final QC process before uploading our titles on our website we dedicate around 350 working hours. The titles are selected based on their current market cap and the foreseen CAGR and growth.


The 5 steps process:

Step 1: Secondary Research:

Secondary Research or Desk Research is as the name suggests is a research process wherein, we collect data through the readily available information. In this process we use various paid and unpaid databases which our team has access to and gather data through the same. This includes examining of listed companies’ annual reports, Journals, SEC filling etc. Apart from this our team has access to various associations across the globe across different industries. Lastly, we have exchange relationships with various university as well as individual libraries.

Secondary Research

Step 2: Primary Research

When we talk about primary research, it is a type of study in which the researchers collect relevant data samples directly, rather than relying on previously collected data.  This type of research is focused on gaining content specific facts that can be sued to solve specific problems. Since the collected data is fresh and first hand therefore it makes the study more accurate and genuine.

We at SNS Insider have divided Primary Research into 2 parts.

Part 1 wherein we interview the KOLs of major players as well as the upcoming ones across various geographic regions. This allows us to have their view over the market scenario and acts as an important tool to come closer to the accurate market numbers. As many as 45 paid and unpaid primary interviews are taken from both the demand and supply side of the industry to make sure we land at an accurate judgement and analysis of the market.

This step involves the triangulation of data wherein our team analyses the interview transcripts, online survey responses and observation of on filed participants. The below mentioned chart should give a better understanding of the part 1 of the primary interview.

Primary Research

Part 2: In this part of primary research the data collected via secondary research and the part 1 of the primary research is validated with the interviews from individual consultants and subject matter experts.

Consultants are those set of people who have at least 12 years of experience and expertise within the industry whereas Subject Matter Experts are those with at least 15 years of experience behind their back within the same space. The data with the help of two main processes i.e., FGDs (Focused Group Discussions) and IDs (Individual Discussions). This gives us a 3rd party nonbiased primary view of the market scenario making it a more dependable one while collation of the data pointers.

Step 3: Data Bank Validation

Once all the information is collected via primary and secondary sources, we run that information for data validation. At our intelligence centre our research heads track a lot of information related to the market which includes the quarterly reports, the daily stock prices, and other relevant information. Our data bank server gets updated every fortnight and that is how the information which we collected using our primary and secondary information is revalidated in real time.

Data Bank Validation

Step 4: QA/QC Process

After all the data collection and validation our team does a final level of quality check and quality assurance to get rid of any unwanted or undesired mistakes. This might include but not limited to getting rid of the any typos, duplication of numbers or missing of any important information. The people involved in this process include technical content writers, research heads and graphics people. Once this process is completed the title gets uploader on our platform for our clients to read it.

Step 5: Final QC/QA Process:

This is the last process and comes when the client has ordered the study. In this process a final QA/QC is done before the study is emailed to the client. Since we believe in giving our clients a good experience of our research studies, therefore, to make sure that we do not lack at our end in any way humanly possible we do a final round of quality check and then dispatch the study to the client.

Key Market Segments

By Product

By Application

  • Obesity

  • Cardiovascular Diseases

  • Cancer Research

  • Others

By Technique

  • Saliva

  • Buccal Swab

  • Blood

By End Use

  • Hospitals & Clinics

  • Others

Request for Segment Customization as per your Business Requirement: Segment Customization Request

Regional Coverage:

North America

  • US

  • Canada

  • Mexico

Europe

  • Eastern Europe

    • Poland

    • Romania

    • Hungary

    • Turkey

    • Rest of Eastern Europe

  • Western Europe

    • Germany

    • France

    • UK

    • Italy

    • Spain

    • Netherlands

    • Switzerland

    • Austria

    • Rest of Western Europe

Asia Pacific

  • China

  • India

  • Japan

  • South Korea

  • Vietnam

  • Singapore

  • Australia

  • Rest of Asia Pacific

Middle East & Africa

Middle East

  • UAE

  • Egypt

  • Saudi Arabia

  • Qatar

  • Rest of the Middle East

Africa

  • Nigeria

  • South Africa

  • Rest of Africa

Latin America

  • Brazil

  • Argentina

  • Colombia

  • Rest of Latin America

Request for Country Level Research Report: Country Level Customization Request

Available Customization

With the given market data, SNS Insider offers customization as per the company’s specific needs. The following customization options are available for the report:

  • Product Analysis

  • Criss-Cross segment analysis (e.g. Product X Application)

  • Product Matrix which gives a detailed comparison of the product portfolio of each company

  • Geographic Analysis

  • Additional countries in any of the regions

  • Company Information

  • Detailed analysis and profiling of additional market players (Up to five)


  •            5000 (33% Discount)


  •            8950 (40% Discount)


  •            3050 (23% Discount)

Start a Conversation

Hi! Click one of our member below to chat on Phone