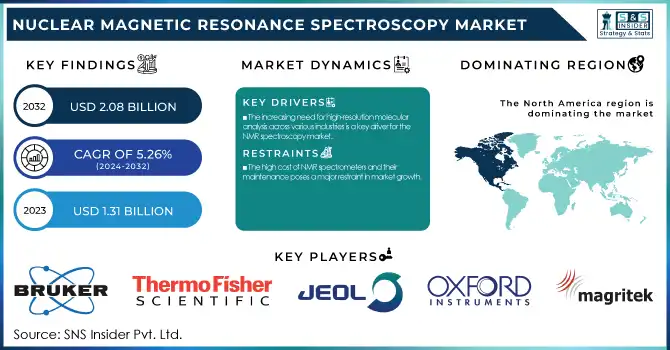
The Nuclear Magnetic Resonance Spectroscopy Market Size was valued at USD 1.31 billion in 2023 and is expected to reach USD 2.08 billion by 2032 and grow at a CAGR of 5.26% over the forecast period 2024-2032. This report identifies adoption and usage patterns, with a focus on the growing demand for NMR in pharmaceutical research, material science, and diagnostic use. The research investigates technological developments, such as greater field strength instruments and enhanced data processing methods, in addition to increasing research and academic funding that drives innovation in spectroscopy use. It also investigates cost and pricing patterns, considering the effect of instrument affordability, maintenance costs, and accessibility of funding on market growth. The report also reviews how these trends collectively impact the changing dynamics of the NMR Spectroscopy market.
To Get more information on Nuclear Magnetic Resonance Spectroscopy Market - Request Free Sample Report
Drivers
The increasing need for high-resolution molecular analysis across various industries is a key driver for the NMR spectroscopy market.
Pharmaceutical and biotechnology industries utilize NMR in depth for drug development, biomarker discovery, and quality analysis, making their research more efficient. The increasing incidence of chronic diseases has heightened the need for cutting-edge spectroscopic methodologies in structural biology and metabolomics. Moreover, the food industry utilizes NMR spectroscopy for food safety, detection of contaminations, and authenticity testing, complying with rigorous regulatory guidelines. The development of benchtop NMR spectrometers, presenting affordable and accessible options, is further accelerating adoption in small-scale research laboratories and industrial processes. Technological innovations, including high-field NMR systems above 1 GHz, are extending the frontiers of molecular study, enabling scientists to analyze intricate biological organizations with unprecedented accuracy. The combination of AI and automation for NMR data analysis is enhancing precision and minimizing processing time, bringing the technology within reach of more industries. As government and private sector funding for life sciences research continues to grow, demand for NMR spectroscopy is likely to accelerate, especially in drug development, personalized medicine, and chemical analysis applications.
Restraints
The high cost of NMR spectrometers and their maintenance poses a major restraint in market growth.
High-field NMR systems (over 600 MHz) are capital-intensive, costing more than USD 5 million, and thus out of reach for most small research laboratories and academic institutions. The expense of superconducting magnets, which are needed for high-resolution imaging, adds to the overall cost. Cryogenic cooling systems and helium reliance drive up operational costs, with maintenance being costly and complicated. Limited availability of funds in developing countries hinders the extensive implementation of NMR spectroscopy due to the inability of numerous research centers and hospitals to purchase sophisticated spectrometers. A second major limitation is the need for highly trained personnel to run and analyze NMR data. Most analytical tools like mass spectrometry or chromatography do not demand special skills, but NMR demands specialized talent, usually out of reach for institutions with limited experienced personnel. Additionally, other spectroscopic techniques like Fourier Transform Infrared (FTIR) and Raman spectroscopy offer quicker and cheaper analytical options, competing with NMR in some applications. Even with advancements in benchtop NMR technology, low-field systems are constrained by sensitivity and resolution, limiting their application in high-precision research areas like drug discovery and structural biology.
Opportunities
The growing adoption of NMR spectroscopy in clinical diagnostics and environmental monitoring presents significant market opportunities.
NMR is becoming an important tool for the early detection of disease, metabolic profiling, and personalized medicine. Its potential to deliver non-invasive, high-resolution metabolic fingerprints is being investigated in fields such as cancer research, neurodegenerative diseases, and metabolic disorders. The combination of NMR with artificial intelligence (AI) and machine learning is also broadening its application in predictive analytics for healthcare. In addition, the growing emphasis on environmental monitoring and sustainability is propelling demand for NMR spectroscopy in water quality testing, soil analysis, and the detection of environmental contaminants. The technology's capability to examine contaminants without sample destruction makes it suitable for regulatory and industrial monitoring. The creation of miniaturized and transportable benchtop NMR systems is unveiling new applications in on-site testing and real-time industrial quality control, especially in food safety, agriculture, and petrochemical industries. Increasing collaboration between academic institutions and industry players is also driving innovation, resulting in affordable solutions and better accessibility of NMR spectroscopy. With more government and private funding support, commercialization of low-cost NMR solutions would further boost its take-up by emerging markets.
Challenges
One of the major challenges in the NMR spectroscopy market is the global helium shortage, which directly impacts the operation of high-field NMR spectrometers.
Liquid helium is used for cooling superconducting magnets, and supply restrictions have resulted in variable availability and increasing prices, impacting research facilities and industries using NMR technology. Other technologies for cooling like cryogen-free magnets are also under investigation, but extensive implementation is hindered due to heavy R&D expenditures. Another issue is the lack of standardization of NMR data interpretation between industries and areas of research. In contrast to mass spectrometry, with established databases for molecular identification, NMR spectral libraries tend to be incomplete and hence difficult to interpret consistently. Moreover, the complexity of multi-dimensional NMR methods necessitates highly trained manpower, which prevents it from reaching non-experts. The time-consuming analysis as compared to other spectroscopy methods is another obstacle, as industries require quicker and more automated analysis solutions. The lag in the clinic's adoption of high-field NMR owing to regulatory barriers constrains its future growth in the healthcare industry further. Technology innovation, greater investment in cryogen-free equipment, and standardized analytical methods will be needed to overcome these challenges and enhance data reliability and efficiency.
By Product
The instruments segment led the NMR spectroscopy market with a strong share of 80.3% in 2023. This leadership is mainly fueled by the exorbitant price of NMR spectrometers, growing use in research institutes and academic institutions, and ongoing technological innovation in high-field and benchtop NMR systems. The need for high-resolution imaging and molecular analysis has also increased the growth of this segment.
Conversely, the consumables segment will experience the fastest growth over the forecast period. The increasing demand for deuterated solvents, NMR tubes, and other critical reagents for diagnostic and analytical purposes is driving its demand. Rising NMR applications in pharmaceutical research and quality control are further propelling the growth of this segment.
By Type
The high-field NMR spectroscopy segment dominated the market with a commanding 88.7% share in 2023. This is because it has superior sensitivity, excellent resolution, and widespread application in structural biology, pharmaceutical research, and sophisticated material science applications. High-field NMR systems are essential for the analysis of complex molecules and, hence preferred in academic and industrial research.
At the same time, the low-field NMR spectroscopy segment is anticipated to expand at the highest growth rate. Growing demand for compact, affordable, and easy-to-use NMR systems in food analysis, agriculture, and routine industrial processes is fueling its uptake. Its expanding application in quality control and real-time monitoring is also contributing to its growth.
By End Use
The academic segment led as the primary end-use segment, holding a market share of 46.9% in 2023. The large-scale application of NMR spectroscopy in research programs at universities, structural biology, and studies in molecular chemistry has established it as the industry leader. Apart from this, growing government expenditures on academic research and the presence of well-developed research institutes across the world have also given a boost to the demand for NMR devices in this space.
On the other hand, the food and agriculture sector is anticipated to experience the fastest growth during the forecast period. The increasing demand for food safety testing, quality assurance, and authenticity analysis has fueled the use of NMR spectroscopy in the industry. The technology's capability to deliver non-destructive and comprehensive molecular information on food composition and contaminants is fueling its uptake in agricultural and food applications.
The North American market led the NMR spectroscopy market in 2023, led by robust research funding, presence of key industry players, and widespread use in pharmaceutical and biotechnology research. The United States is particularly dominant, with high usage rates in academic and pharmaceutical R&D and large investments in advanced NMR technology.
Europe followed closely, with Germany, the UK, and France among the leading market players. Europe is supported by a strong research infrastructure, collaborations between industry stakeholders and academic institutions, and government incentives for life sciences and material science applications. Increasing demand for high-field NMR in metabolomics and structural biology further secures Europe's market position.
The Asia-Pacific region is anticipated to experience the highest growth during the forecast period, driven by growing investments in research facilities, growing pharmaceutical and biotech sectors, and growing applications in food safety and agriculture. China, Japan, and India are among the most important contributors, with China experiencing swift developments in NMR-based research and industrial uses. Government efforts to promote scientific research and growing partnerships with international players further boost market growth.
Get Customized Report as per Your Business Requirement - Enquiry Now
Key Players and Their Products in the Nuclear Magnetic Resonance (NMR) Spectroscopy Market
Bruker Corporation – AVANCE NEO, Fourier 80, BioSpin
Thermo Fisher Scientific Inc. – picoSpin Series
JEOL Ltd. – JNM-ECZ Series, JNM-ECZR Series
Oxford Instruments – MQC+ Benchtop NMR Analyzers, Pulsar Benchtop NMR
Nanalysis Corp. – 60PRO, 100PRO, NMReady-60
Magritek – Spinsolve Series
Niumag Corporation – MicroMR Series, MacroMR Series
QoneTec AG – NMR Probes & Accessories
Cosa Xentaur – Benchtop NMR Systems
Anasazi Instruments, Inc. – Eft-60 NMR, Eft-90 NMR
Buck Scientific – NMR Spectrometers
Tel Atomic Incorporated – Educational NMR Systems
TecMag – Redstone NMR Spectrometers
Recent Developments
In Dec 2024, Bruker announced the acceptance of a 1.2 GHz Ascend NMR spectrometer at the Swiss High-field NMR Facility, operated by the University of Basel, ETH Zürich, and the University of Zürich. Installed at the University of Zürich, this advanced instrument will enhance research in structural biology and macromolecular analysis. It is the second 1.2 GHz NMR in Switzerland, complementing the first at ETH Zürich, which focuses on solid-state NMR, material studies, and biological research.
Report Attributes | Details |
---|---|
Market Size in 2023 | USD 1.31 billion |
Market Size by 2032 | USD 2.08 billion |
CAGR | CAGR of 5.26% From 2024 to 2032 |
Base Year | 2023 |
Forecast Period | 2024-2032 |
Historical Data | 2020-2022 |
Report Scope & Coverage | Market Size, Segments Analysis, Competitive Landscape, Regional Analysis, DROC & SWOT Analysis, Forecast Outlook |
Key Segments | • By Product [Instruments, Consumables] • By Type [Low-field NMR spectroscopy, High-field NMR spectroscopy] • By End Use [Academic, Pharmaceutical & Biotech companies, Agriculture and Food, Chemical Industries, Others] |
Regional Analysis/Coverage | North America (US, Canada, Mexico), Europe (Eastern Europe [Poland, Romania, Hungary, Turkey, Rest of Eastern Europe] Western Europe] Germany, France, UK, Italy, Spain, Netherlands, Switzerland, Austria, Rest of Western Europe]), Asia Pacific (China, India, Japan, South Korea, Vietnam, Singapore, Australia, Rest of Asia Pacific), Middle East & Africa (Middle East [UAE, Egypt, Saudi Arabia, Qatar, Rest of Middle East], Africa [Nigeria, South Africa, Rest of Africa], Latin America (Brazil, Argentina, Colombia, Rest of Latin America) |
Company Profiles | Bruker Corporation, Thermo Fisher Scientific Inc., JEOL Ltd., Oxford Instruments, Nanalysis Corp., Magritek, Niumag Corporation, QoneTec AG, Cosa Xentaur, Anasazi Instruments, Inc., Buck Scientific, Tel Atomic Incorporated, TecMag. |
Ans: The Nuclear Magnetic Resonance Spectroscopy market is projected to grow at a CAGR of 5.26% during the forecast period.
Ans: By 2032, the Nuclear Magnetic Resonance Spectroscopy market is expected to reach USD 2.08 billion, up from USD 1.31 billion in 2023.
Ans: The increasing need for high-resolution molecular analysis across various industries is a key driver for the NMR spectroscopy market.
Ans: The high cost of NMR spectrometers and their maintenance poses a major restraint in market growth.
Ans: North America is the dominant region in the Nuclear Magnetic Resonance Spectroscopy market.
Table of contents:
1. Introduction
1.1 Market Definition
1.2 Scope (Inclusion and Exclusions)
1.3 Research & Academic Institutes Assumptions
2. Executive Summary
2.1 Market Overview
2.2 Regional Synopsis
2.3 Competitive Summary
3. Research & Academic Institutes Methodology
3.1 Top-Down Approach
3.2 Bottom-up Approach
3.3. Data Validation
3.4 Primary Interviews
4. Market Dynamics Impact Analysis
4.1 Market Driving Factors Analysis
4.1.1 Drivers
4.1.2 Restraints
4.1.3 Opportunities
4.1.4 Challenges
4.2 PESTLE Analysis
4.3 Porter’s Five Forces Model
5. Statistical Insights and Trends Reporting
5.1 Adoption and Utilization Trends (2023-2032)
5.2 Technology Trends and Advancements
5.3 Research & Academic Funding Trends (2023-2032)
5.4 Cost and Pricing Trends
6. Competitive Landscape
6.1 List of Major Companies, By Region
6.2 Market Share Analysis, By Region
6.3 Product Benchmarking
6.3.1 Product specifications and features
6.3.2 Pricing
6.4 Strategic Initiatives
6.4.1 Marketing and Promotional Activities
6.4.2 Distribution and Supply Chain Strategies
6.4.3 Expansion plans and new Product launches
6.4.4 Strategic partnerships and collaborations
6.5 Technological Advancements
6.6 Market Positioning and Branding
7. Nuclear Magnetic Resonance Spectroscopy Market Segmentation, by Product
7.1 Chapter Overview
7.2 Instruments
7.2.1 Instruments Market Trends Analysis (2020-2032)
7.2.2 Instruments Market Size Estimates and Forecasts to 2032 (USD Billion)
7.3 Consumables
7.3.1 Consumables Market Trends Analysis (2020-2032)
7.3.2 Consumables Market Size Estimates and Forecasts to 2032 (USD Billion)
8. Nuclear Magnetic Resonance Spectroscopy Market Segmentation, by Type
8.1 Chapter Overview
8.2 Low-field NMR spectroscopy
8.2.1 Low-field NMR Spectroscopy Market Trends Analysis (2020-2032)
8.2.2 Low-field NMR Spectroscopy Market Size Estimates and Forecasts to 2032 (USD Billion)
8.3 High-field NMR spectroscopy
8.3.1 High-field NMR Spectroscopy Market Trends Analysis (2020-2032)
8.3.2 High-field NMR Spectroscopy Market Size Estimates and Forecasts to 2032 (USD Billion)
9. Nuclear Magnetic Resonance Spectroscopy Market Segmentation, by End-use
9.1 Chapter Overview
9.2 Academic
9.2.1 Academic Market Trends Analysis (2020-2032)
9.2.2 Academic Market Size Estimates and Forecasts to 2032 (USD Billion)
9.3 Pharmaceutical & Biotech companies
9.3.1 Pharmaceutical & Biotech Companies Market Trends Analysis (2020-2032)
9.3.2 Pharmaceutical & Biotech Companies Market Size Estimates and Forecasts to 2032 (USD Billion)
9.4 Agriculture and Food
9.4.1 Agriculture and Food Market Trends Analysis (2020-2032)
9.4.2 Agriculture and Food Market Size Estimates and Forecasts to 2032 (USD Billion)
9.5 Chemical Industries
9.5.1 Chemical Industries Market Trends Analysis (2020-2032)
9.5.2 Chemical Industries Market Size Estimates and Forecasts to 2032 (USD Billion)
9.6 Others
9.6.1 Others Market Trends Analysis (2020-2032)
9.6.2 Others Market Size Estimates and Forecasts to 2032 (USD Billion)
10. Regional Analysis
10.1 Chapter Overview
10.2 North America
10.2.1 Trends Analysis
10.2.2 North America Nuclear Magnetic Resonance Spectroscopy Market Estimates and Forecasts, by Country (2020-2032) (USD Billion)
10.2.3 North America Nuclear Magnetic Resonance Spectroscopy Market Estimates and Forecasts, by Product (2020-2032) (USD Billion)
10.2.4 North America Nuclear Magnetic Resonance Spectroscopy Market Estimates and Forecasts, by Type (2020-2032) (USD Billion)
10.2.5 North America Nuclear Magnetic Resonance Spectroscopy Market Estimates and Forecasts, by End-use (2020-2032) (USD Billion)
10.2.6 USA
10.2.6.1 USA Nuclear Magnetic Resonance Spectroscopy Market Estimates and Forecasts, by Product (2020-2032) (USD Billion)
10.2.6.2 USA Nuclear Magnetic Resonance Spectroscopy Market Estimates and Forecasts, by Type (2020-2032) (USD Billion)
10.2.6.3 USA Nuclear Magnetic Resonance Spectroscopy Market Estimates and Forecasts, by End-use (2020-2032) (USD Billion)
10.2.7 Canada
10.2.7.1 Canada Nuclear Magnetic Resonance Spectroscopy Market Estimates and Forecasts, by Product (2020-2032) (USD Billion)
10.2.7.2 Canada Nuclear Magnetic Resonance Spectroscopy Market Estimates and Forecasts, by Type (2020-2032) (USD Billion)
10.2.7.3 Canada Nuclear Magnetic Resonance Spectroscopy Market Estimates and Forecasts, by End-use (2020-2032) (USD Billion)
10.2.8 Mexico
10.2.8.1 Mexico Nuclear Magnetic Resonance Spectroscopy Market Estimates and Forecasts, by Product (2020-2032) (USD Billion)
10.2.8.2 Mexico Nuclear Magnetic Resonance Spectroscopy Market Estimates and Forecasts, by Type (2020-2032) (USD Billion)
10.2.8.3 Mexico Nuclear Magnetic Resonance Spectroscopy Market Estimates and Forecasts, by End-use (2020-2032) (USD Billion)
10.3 Europe
10.3.1 Eastern Europe
10.3.1.1 Trends Analysis
10.3.1.2 Eastern Europe Nuclear Magnetic Resonance Spectroscopy Market Estimates and Forecasts, by Country (2020-2032) (USD Billion)
10.3.1.3 Eastern Europe Nuclear Magnetic Resonance Spectroscopy Market Estimates and Forecasts, by Product (2020-2032) (USD Billion)
10.3.1.4 Eastern Europe Nuclear Magnetic Resonance Spectroscopy Market Estimates and Forecasts, by Type (2020-2032) (USD Billion)
10.3.1.5 Eastern Europe Nuclear Magnetic Resonance Spectroscopy Market Estimates and Forecasts, by End-use (2020-2032) (USD Billion)
10.3.1.6 Poland
10.3.1.6.1 Poland Nuclear Magnetic Resonance Spectroscopy Market Estimates and Forecasts, by Product (2020-2032) (USD Billion)
10.3.1.6.2 Poland Nuclear Magnetic Resonance Spectroscopy Market Estimates and Forecasts, by Type (2020-2032) (USD Billion)
10.3.1.6.3 Poland Nuclear Magnetic Resonance Spectroscopy Market Estimates and Forecasts, by End-use (2020-2032) (USD Billion)
10.3.1.7 Romania
10.3.1.7.1 Romania Nuclear Magnetic Resonance Spectroscopy Market Estimates and Forecasts, by Product (2020-2032) (USD Billion)
10.3.1.7.2 Romania Nuclear Magnetic Resonance Spectroscopy Market Estimates and Forecasts, by Type (2020-2032) (USD Billion)
10.3.1.7.3 Romania Nuclear Magnetic Resonance Spectroscopy Market Estimates and Forecasts, by End-use (2020-2032) (USD Billion)
10.3.1.8 Hungary
10.3.1.8.1 Hungary Nuclear Magnetic Resonance Spectroscopy Market Estimates and Forecasts, by Product (2020-2032) (USD Billion)
10.3.1.8.2 Hungary Nuclear Magnetic Resonance Spectroscopy Market Estimates and Forecasts, by Type (2020-2032) (USD Billion)
10.3.1.8.3 Hungary Nuclear Magnetic Resonance Spectroscopy Market Estimates and Forecasts, by End-use (2020-2032) (USD Billion)
10.3.1.9 turkey
10.3.1.9.1 Turkey Nuclear Magnetic Resonance Spectroscopy Market Estimates and Forecasts, by Product (2020-2032) (USD Billion)
10.3.1.9.2 Turkey Nuclear Magnetic Resonance Spectroscopy Market Estimates and Forecasts, by Type (2020-2032) (USD Billion)
10.3.1.9.3 Turkey Nuclear Magnetic Resonance Spectroscopy Market Estimates and Forecasts, by End-use (2020-2032) (USD Billion)
10.3.1.10 Rest of Eastern Europe
10.3.1.10.1 Rest of Eastern Europe Nuclear Magnetic Resonance Spectroscopy Market Estimates and Forecasts, by Product (2020-2032) (USD Billion)
10.3.1.10.2 Rest of Eastern Europe Nuclear Magnetic Resonance Spectroscopy Market Estimates and Forecasts, by Type (2020-2032) (USD Billion)
10.3.1.10.3 Rest of Eastern Europe Nuclear Magnetic Resonance Spectroscopy Market Estimates and Forecasts, by End-use (2020-2032) (USD Billion)
10.3.2 Western Europe
10.3.2.1 Trends Analysis
10.3.2.2 Western Europe Nuclear Magnetic Resonance Spectroscopy Market Estimates and Forecasts, by Country (2020-2032) (USD Billion)
10.3.2.3 Western Europe Nuclear Magnetic Resonance Spectroscopy Market Estimates and Forecasts, by Product (2020-2032) (USD Billion)
10.3.2.4 Western Europe Nuclear Magnetic Resonance Spectroscopy Market Estimates and Forecasts, by Type (2020-2032) (USD Billion)
10.3.2.5 Western Europe Nuclear Magnetic Resonance Spectroscopy Market Estimates and Forecasts, by End-use (2020-2032) (USD Billion)
10.3.2.6 Germany
10.3.2.6.1 Germany Nuclear Magnetic Resonance Spectroscopy Market Estimates and Forecasts, by Product (2020-2032) (USD Billion)
10.3.2.6.2 Germany Nuclear Magnetic Resonance Spectroscopy Market Estimates and Forecasts, by Type (2020-2032) (USD Billion)
10.3.2.6.3 Germany Nuclear Magnetic Resonance Spectroscopy Market Estimates and Forecasts, by End-use (2020-2032) (USD Billion)
10.3.2.7 France
10.3.2.7.1 France Nuclear Magnetic Resonance Spectroscopy Market Estimates and Forecasts, by Product (2020-2032) (USD Billion)
10.3.2.7.2 France Nuclear Magnetic Resonance Spectroscopy Market Estimates and Forecasts, by Type (2020-2032) (USD Billion)
10.3.2.7.3 France Nuclear Magnetic Resonance Spectroscopy Market Estimates and Forecasts, by End-use (2020-2032) (USD Billion)
10.3.2.8 UK
10.3.2.8.1 UK Nuclear Magnetic Resonance Spectroscopy Market Estimates and Forecasts, by Product (2020-2032) (USD Billion)
10.3.2.8.2 UK Nuclear Magnetic Resonance Spectroscopy Market Estimates and Forecasts, by Type (2020-2032) (USD Billion)
10.3.2.8.3 UK Nuclear Magnetic Resonance Spectroscopy Market Estimates and Forecasts, by End-use (2020-2032) (USD Billion)
10.3.2.9 Italy
10.3.2.9.1 Italy Nuclear Magnetic Resonance Spectroscopy Market Estimates and Forecasts, by Product (2020-2032) (USD Billion)
10.3.2.9.2 Italy Nuclear Magnetic Resonance Spectroscopy Market Estimates and Forecasts, by Type (2020-2032) (USD Billion)
10.3.2.9.3 Italy Nuclear Magnetic Resonance Spectroscopy Market Estimates and Forecasts, by End-use (2020-2032) (USD Billion)
10.3.2.10 Spain
10.3.2.10.1 Spain Nuclear Magnetic Resonance Spectroscopy Market Estimates and Forecasts, by Product (2020-2032) (USD Billion)
10.3.2.10.2 Spain Nuclear Magnetic Resonance Spectroscopy Market Estimates and Forecasts, by Type (2020-2032) (USD Billion)
10.3.2.10.3 Spain Nuclear Magnetic Resonance Spectroscopy Market Estimates and Forecasts, by End-use (2020-2032) (USD Billion)
10.3.2.11 Netherlands
10.3.2.11.1 Netherlands Nuclear Magnetic Resonance Spectroscopy Market Estimates and Forecasts, by Product (2020-2032) (USD Billion)
10.3.2.11.2 Netherlands Nuclear Magnetic Resonance Spectroscopy Market Estimates and Forecasts, by Type (2020-2032) (USD Billion)
10.3.2.11.3 Netherlands Nuclear Magnetic Resonance Spectroscopy Market Estimates and Forecasts, by End-use (2020-2032) (USD Billion)
10.3.2.12 Switzerland
10.3.2.12.1 Switzerland Nuclear Magnetic Resonance Spectroscopy Market Estimates and Forecasts, by Product (2020-2032) (USD Billion)
10.3.2.12.2 Switzerland Nuclear Magnetic Resonance Spectroscopy Market Estimates and Forecasts, by Type (2020-2032) (USD Billion)
10.3.2.12.3 Switzerland Nuclear Magnetic Resonance Spectroscopy Market Estimates and Forecasts, by End-use (2020-2032) (USD Billion)
10.3.2.13 Austria
10.3.2.13.1 Austria Nuclear Magnetic Resonance Spectroscopy Market Estimates and Forecasts, by Product (2020-2032) (USD Billion)
10.3.2.13.2 Austria Nuclear Magnetic Resonance Spectroscopy Market Estimates and Forecasts, by Type (2020-2032) (USD Billion)
10.3.2.13.3 Austria Nuclear Magnetic Resonance Spectroscopy Market Estimates and Forecasts, by End-use (2020-2032) (USD Billion)
10.3.2.14 Rest of Western Europe
10.3.2.14.1 Rest of Western Europe Nuclear Magnetic Resonance Spectroscopy Market Estimates and Forecasts, by Product (2020-2032) (USD Billion)
10.3.2.14.2 Rest of Western Europe Nuclear Magnetic Resonance Spectroscopy Market Estimates and Forecasts, by Type (2020-2032) (USD Billion)
10.3.2.14.3 Rest of Western Europe Nuclear Magnetic Resonance Spectroscopy Market Estimates and Forecasts, by End-use (2020-2032) (USD Billion)
10.4 Asia Pacific
10.4.1 Trends Analysis
10.4.2 Asia Pacific Nuclear Magnetic Resonance Spectroscopy Market Estimates and Forecasts, by Country (2020-2032) (USD Billion)
10.4.3 Asia Pacific Nuclear Magnetic Resonance Spectroscopy Market Estimates and Forecasts, by Product (2020-2032) (USD Billion)
10.4.4 Asia Pacific Nuclear Magnetic Resonance Spectroscopy Market Estimates and Forecasts, by Type (2020-2032) (USD Billion)
10.4.5 Asia Pacific Nuclear Magnetic Resonance Spectroscopy Market Estimates and Forecasts, by End-use (2020-2032) (USD Billion)
10.4.6 China
10.4.6.1 China Nuclear Magnetic Resonance Spectroscopy Market Estimates and Forecasts, by Product (2020-2032) (USD Billion)
10.4.6.2 China Nuclear Magnetic Resonance Spectroscopy Market Estimates and Forecasts, by Type (2020-2032) (USD Billion)
10.4.6.3 China Nuclear Magnetic Resonance Spectroscopy Market Estimates and Forecasts, by End-use (2020-2032) (USD Billion)
10.4.7 India
10.4.7.1 India Nuclear Magnetic Resonance Spectroscopy Market Estimates and Forecasts, by Product (2020-2032) (USD Billion)
10.4.7.2 India Nuclear Magnetic Resonance Spectroscopy Market Estimates and Forecasts, by Type (2020-2032) (USD Billion)
10.4.7.3 India Nuclear Magnetic Resonance Spectroscopy Market Estimates and Forecasts, by End-use (2020-2032) (USD Billion)
10.4.8 Japan
10.4.8.1 Japan Nuclear Magnetic Resonance Spectroscopy Market Estimates and Forecasts, by Product (2020-2032) (USD Billion)
10.4.8.2 Japan Nuclear Magnetic Resonance Spectroscopy Market Estimates and Forecasts, by Type (2020-2032) (USD Billion)
10.4.8.3 Japan Nuclear Magnetic Resonance Spectroscopy Market Estimates and Forecasts, by End-use (2020-2032) (USD Billion)
10.4.9 South Korea
10.4.9.1 South Korea Nuclear Magnetic Resonance Spectroscopy Market Estimates and Forecasts, by Product (2020-2032) (USD Billion)
10.4.9.2 South Korea Nuclear Magnetic Resonance Spectroscopy Market Estimates and Forecasts, by Type (2020-2032) (USD Billion)
10.4.9.3 South Korea Nuclear Magnetic Resonance Spectroscopy Market Estimates and Forecasts, by End-use (2020-2032) (USD Billion)
10.4.10 Vietnam
10.4.10.1 Vietnam Nuclear Magnetic Resonance Spectroscopy Market Estimates and Forecasts, by Product (2020-2032) (USD Billion)
10.4.10.2 Vietnam Nuclear Magnetic Resonance Spectroscopy Market Estimates and Forecasts, by Type (2020-2032) (USD Billion)
10.4.10.3 Vietnam Nuclear Magnetic Resonance Spectroscopy Market Estimates and Forecasts, by End-use (2020-2032) (USD Billion)
10.4.11 Singapore
10.4.11.1 Singapore Nuclear Magnetic Resonance Spectroscopy Market Estimates and Forecasts, by Product (2020-2032) (USD Billion)
10.4.11.2 Singapore Nuclear Magnetic Resonance Spectroscopy Market Estimates and Forecasts, by Type (2020-2032) (USD Billion)
10.4.11.3 Singapore Nuclear Magnetic Resonance Spectroscopy Market Estimates and Forecasts, by End-use (2020-2032) (USD Billion)
10.4.12 Australia
10.4.12.1 Australia Nuclear Magnetic Resonance Spectroscopy Market Estimates and Forecasts, by Product (2020-2032) (USD Billion)
10.4.12.2 Australia Nuclear Magnetic Resonance Spectroscopy Market Estimates and Forecasts, by Type (2020-2032) (USD Billion)
10.4.12.3 Australia Nuclear Magnetic Resonance Spectroscopy Market Estimates and Forecasts, by End-use (2020-2032) (USD Billion)
10.4.13 Rest of Asia Pacific
10.4.13.1 Rest of Asia Pacific Nuclear Magnetic Resonance Spectroscopy Market Estimates and Forecasts, by Product (2020-2032) (USD Billion)
10.4.13.2 Rest of Asia Pacific Nuclear Magnetic Resonance Spectroscopy Market Estimates and Forecasts, by Type (2020-2032) (USD Billion)
10.4.13.3 Rest of Asia Pacific Nuclear Magnetic Resonance Spectroscopy Market Estimates and Forecasts, by End-use (2020-2032) (USD Billion)
10.5 Middle East and Africa
10.5.1 Middle East
10.5.1.1 Trends Analysis
10.5.1.2 Middle East Nuclear Magnetic Resonance Spectroscopy Market Estimates and Forecasts, by Country (2020-2032) (USD Billion)
10.5.1.3 Middle East Nuclear Magnetic Resonance Spectroscopy Market Estimates and Forecasts, by Product (2020-2032) (USD Billion)
10.5.1.4 Middle East Nuclear Magnetic Resonance Spectroscopy Market Estimates and Forecasts, by Type (2020-2032) (USD Billion)
10.5.1.5 Middle East Nuclear Magnetic Resonance Spectroscopy Market Estimates and Forecasts, by End-use (2020-2032) (USD Billion)
10.5.1.6 UAE
10.5.1.6.1 UAE Nuclear Magnetic Resonance Spectroscopy Market Estimates and Forecasts, by Product (2020-2032) (USD Billion)
10.5.1.6.2 UAE Nuclear Magnetic Resonance Spectroscopy Market Estimates and Forecasts, by Type (2020-2032) (USD Billion)
10.5.1.6.3 UAE Nuclear Magnetic Resonance Spectroscopy Market Estimates and Forecasts, by End-use (2020-2032) (USD Billion)
10.5.1.7 Egypt
10.5.1.7.1 Egypt Nuclear Magnetic Resonance Spectroscopy Market Estimates and Forecasts, by Product (2020-2032) (USD Billion)
10.5.1.7.2 Egypt Nuclear Magnetic Resonance Spectroscopy Market Estimates and Forecasts, by Type (2020-2032) (USD Billion)
10.5.1.7.3 Egypt Nuclear Magnetic Resonance Spectroscopy Market Estimates and Forecasts, by End-use (2020-2032) (USD Billion)
10.5.1.8 Saudi Arabia
10.5.1.8.1 Saudi Arabia Nuclear Magnetic Resonance Spectroscopy Market Estimates and Forecasts, by Product (2020-2032) (USD Billion)
10.5.1.8.2 Saudi Arabia Nuclear Magnetic Resonance Spectroscopy Market Estimates and Forecasts, by Type (2020-2032) (USD Billion)
10.5.1.8.3 Saudi Arabia Nuclear Magnetic Resonance Spectroscopy Market Estimates and Forecasts, by End-use (2020-2032) (USD Billion)
10.5.1.9 Qatar
10.5.1.9.1 Qatar Nuclear Magnetic Resonance Spectroscopy Market Estimates and Forecasts, by Product (2020-2032) (USD Billion)
10.5.1.9.2 Qatar Nuclear Magnetic Resonance Spectroscopy Market Estimates and Forecasts, by Type (2020-2032) (USD Billion)
10.5.1.9.3 Qatar Nuclear Magnetic Resonance Spectroscopy Market Estimates and Forecasts, by End-use (2020-2032) (USD Billion)
10.5.1.10 Rest of Middle East
10.5.1.10.1 Rest of Middle East Nuclear Magnetic Resonance Spectroscopy Market Estimates and Forecasts, by Product (2020-2032) (USD Billion)
10.5.1.10.2 Rest of Middle East Nuclear Magnetic Resonance Spectroscopy Market Estimates and Forecasts, by Type (2020-2032) (USD Billion)
10.5.1.10.3 Rest of Middle East Nuclear Magnetic Resonance Spectroscopy Market Estimates and Forecasts, by End-use (2020-2032) (USD Billion)
10.5.2 Africa
10.5.2.1 Trends Analysis
10.5.2.2 Africa Nuclear Magnetic Resonance Spectroscopy Market Estimates and Forecasts, by Country (2020-2032) (USD Billion)
10.5.2.3 Africa Nuclear Magnetic Resonance Spectroscopy Market Estimates and Forecasts, by Product (2020-2032) (USD Billion)
10.5.2.4 Africa Nuclear Magnetic Resonance Spectroscopy Market Estimates and Forecasts, by Type (2020-2032) (USD Billion)
10.5.2.5 Africa Nuclear Magnetic Resonance Spectroscopy Market Estimates and Forecasts, by End-use (2020-2032) (USD Billion)
10.5.2.6 South Africa
10.5.2.6.1 South Africa Nuclear Magnetic Resonance Spectroscopy Market Estimates and Forecasts, by Product (2020-2032) (USD Billion)
10.5.2.6.2 South Africa Nuclear Magnetic Resonance Spectroscopy Market Estimates and Forecasts, by Type (2020-2032) (USD Billion)
10.5.2.6.3 South Africa Nuclear Magnetic Resonance Spectroscopy Market Estimates and Forecasts, by End-use (2020-2032) (USD Billion)
10.5.2.7 Nigeria
10.5.2.7.1 Nigeria Nuclear Magnetic Resonance Spectroscopy Market Estimates and Forecasts, by Product (2020-2032) (USD Billion)
10.5.2.7.2 Nigeria Nuclear Magnetic Resonance Spectroscopy Market Estimates and Forecasts, by Type (2020-2032) (USD Billion)
10.5.2.7.3 Nigeria Nuclear Magnetic Resonance Spectroscopy Market Estimates and Forecasts, by End-use (2020-2032) (USD Billion)
10.5.2.8 Rest of Africa
10.5.2.8.1 Rest of Africa Nuclear Magnetic Resonance Spectroscopy Market Estimates and Forecasts, by Product (2020-2032) (USD Billion)
10.5.2.8.2 Rest of Africa Nuclear Magnetic Resonance Spectroscopy Market Estimates and Forecasts, by Type (2020-2032) (USD Billion)
10.5.2.8.3 Rest of Africa Nuclear Magnetic Resonance Spectroscopy Market Estimates and Forecasts, by End-use (2020-2032) (USD Billion)
10.6 Latin America
10.6.1 Trends Analysis
10.6.2 Latin America Nuclear Magnetic Resonance Spectroscopy Market Estimates and Forecasts, by Country (2020-2032) (USD Billion)
10.6.3 Latin America Nuclear Magnetic Resonance Spectroscopy Market Estimates and Forecasts, by Product (2020-2032) (USD Billion)
10.6.4 Latin America Nuclear Magnetic Resonance Spectroscopy Market Estimates and Forecasts, by Type (2020-2032) (USD Billion)
10.6.5 Latin America Nuclear Magnetic Resonance Spectroscopy Market Estimates and Forecasts, by End-use (2020-2032) (USD Billion)
10.6.6 Brazil
10.6.6.1 Brazil Nuclear Magnetic Resonance Spectroscopy Market Estimates and Forecasts, by Product (2020-2032) (USD Billion)
10.6.6.2 Brazil Nuclear Magnetic Resonance Spectroscopy Market Estimates and Forecasts, by Type (2020-2032) (USD Billion)
10.6.6.3 Brazil Nuclear Magnetic Resonance Spectroscopy Market Estimates and Forecasts, by End-use (2020-2032) (USD Billion)
10.6.7 Argentina
10.6.7.1 Argentina Nuclear Magnetic Resonance Spectroscopy Market Estimates and Forecasts, by Product (2020-2032) (USD Billion)
10.6.7.2 Argentina Nuclear Magnetic Resonance Spectroscopy Market Estimates and Forecasts, by Type (2020-2032) (USD Billion)
10.6.7.3 Argentina Nuclear Magnetic Resonance Spectroscopy Market Estimates and Forecasts, by End-use (2020-2032) (USD Billion)
10.6.8 Colombia
10.6.8.1 Colombia Nuclear Magnetic Resonance Spectroscopy Market Estimates and Forecasts, by Product (2020-2032) (USD Billion)
10.6.8.2 Colombia Nuclear Magnetic Resonance Spectroscopy Market Estimates and Forecasts, by Type (2020-2032) (USD Billion)
10.6.8.3 Colombia Nuclear Magnetic Resonance Spectroscopy Market Estimates and Forecasts, by End-use (2020-2032) (USD Billion)
10.6.9 Rest of Latin America
10.6.9.1 Rest of Latin America Nuclear Magnetic Resonance Spectroscopy Market Estimates and Forecasts, by Product (2020-2032) (USD Billion)
10.6.9.2 Rest of Latin America Nuclear Magnetic Resonance Spectroscopy Market Estimates and Forecasts, by Type (2020-2032) (USD Billion)
10.6.9.3 Rest of Latin America Nuclear Magnetic Resonance Spectroscopy Market Estimates and Forecasts, by End-use (2020-2032) (USD Billion)
11. Company Profiles
11.1 Bruker Corporation
11.1.1 Company Overview
11.1.2 Financial
11.1.3 Product / Services Offered
11.1.4 SWOT Analysis
11.2 Thermo Fisher Scientific Inc.
11.2.1 Company Overview
11.2.2 Financial
11.2.3 Product / Services Offered
11.2.4 SWOT Analysis
11.3 Oxford Instruments
11.3.1 Company Overview
11.3.2 Financial
11.3.3 Product / Services Offered
11.3.4 SWOT Analysis
11.4 JEOL Ltd.
11.4.1 Company Overview
11.4.2 Financial
11.4.3 Product / Services Offered
11.4.4 SWOT Analysis
11.5 Nanalysis Corp.
11.5.1 Company Overview
11.5.2 Financial
11.5.3 Product / Services Offered
11.5.4 SWOT Analysis
11.6 Magritek
11.6.1 Company Overview
11.6.2 Financial
11.6.3 Product / Services Offered
11.6.4 SWOT Analysis
11.7 Niumag Corporation
11.7.1 Company Overview
11.7.2 Financial
11.7.3 Product / Services Offered
11.7.4 SWOT Analysis
11.8 QoneTec AG
11.8.1 Company Overview
11.8.2 Financial
11.8.3 Product / Services Offered
11.8.4 SWOT Analysis
11.9 Anasazi Instruments, Inc.
11.9.1 Company Overview
11.9.2 Financial
11.9.3 Product / Services Offered
11.9.4 SWOT Analysis
11.10 Tel Atomic Incorporated
11.10.1 Company Overview
11.10.2 Financial
11.10.3 Product / Services Offered
11.10.4 SWOT Analysis
12. Use Cases and Best Practices
13. Conclusion
An accurate research report requires proper strategizing as well as implementation. There are multiple factors involved in the completion of good and accurate research report and selecting the best methodology to compete the research is the toughest part. Since the research reports we provide play a crucial role in any company’s decision-making process, therefore we at SNS Insider always believe that we should choose the best method which gives us results closer to reality. This allows us to reach at a stage wherein we can provide our clients best and accurate investment to output ratio.
Each report that we prepare takes a timeframe of 350-400 business hours for production. Starting from the selection of titles through a couple of in-depth brain storming session to the final QC process before uploading our titles on our website we dedicate around 350 working hours. The titles are selected based on their current market cap and the foreseen CAGR and growth.
The 5 steps process:
Step 1: Secondary Research:
Secondary Research or Desk Research is as the name suggests is a research process wherein, we collect data through the readily available information. In this process we use various paid and unpaid databases which our team has access to and gather data through the same. This includes examining of listed companies’ annual reports, Journals, SEC filling etc. Apart from this our team has access to various associations across the globe across different industries. Lastly, we have exchange relationships with various university as well as individual libraries.
Step 2: Primary Research
When we talk about primary research, it is a type of study in which the researchers collect relevant data samples directly, rather than relying on previously collected data. This type of research is focused on gaining content specific facts that can be sued to solve specific problems. Since the collected data is fresh and first hand therefore it makes the study more accurate and genuine.
We at SNS Insider have divided Primary Research into 2 parts.
Part 1 wherein we interview the KOLs of major players as well as the upcoming ones across various geographic regions. This allows us to have their view over the market scenario and acts as an important tool to come closer to the accurate market numbers. As many as 45 paid and unpaid primary interviews are taken from both the demand and supply side of the industry to make sure we land at an accurate judgement and analysis of the market.
This step involves the triangulation of data wherein our team analyses the interview transcripts, online survey responses and observation of on filed participants. The below mentioned chart should give a better understanding of the part 1 of the primary interview.
Part 2: In this part of primary research the data collected via secondary research and the part 1 of the primary research is validated with the interviews from individual consultants and subject matter experts.
Consultants are those set of people who have at least 12 years of experience and expertise within the industry whereas Subject Matter Experts are those with at least 15 years of experience behind their back within the same space. The data with the help of two main processes i.e., FGDs (Focused Group Discussions) and IDs (Individual Discussions). This gives us a 3rd party nonbiased primary view of the market scenario making it a more dependable one while collation of the data pointers.
Step 3: Data Bank Validation
Once all the information is collected via primary and secondary sources, we run that information for data validation. At our intelligence centre our research heads track a lot of information related to the market which includes the quarterly reports, the daily stock prices, and other relevant information. Our data bank server gets updated every fortnight and that is how the information which we collected using our primary and secondary information is revalidated in real time.
Step 4: QA/QC Process
After all the data collection and validation our team does a final level of quality check and quality assurance to get rid of any unwanted or undesired mistakes. This might include but not limited to getting rid of the any typos, duplication of numbers or missing of any important information. The people involved in this process include technical content writers, research heads and graphics people. Once this process is completed the title gets uploader on our platform for our clients to read it.
Step 5: Final QC/QA Process:
This is the last process and comes when the client has ordered the study. In this process a final QA/QC is done before the study is emailed to the client. Since we believe in giving our clients a good experience of our research studies, therefore, to make sure that we do not lack at our end in any way humanly possible we do a final round of quality check and then dispatch the study to the client.
By Product
Instruments
Consumables
By Type
Low-field NMR spectroscopy
High-field NMR spectroscopy
By End Use
Academic
Pharmaceutical & Biotech companies
Agriculture and Food
Chemical Industries
Others
Request for Segment Customization as per your Business Requirement: Segment Customization Request
Regional Coverage:
North America
US
Canada
Mexico
Europe
Eastern Europe
Poland
Romania
Hungary
Turkey
Rest of Eastern Europe
Western Europe
Germany
France
UK
Italy
Spain
Netherlands
Switzerland
Austria
Rest of Western Europe
Asia Pacific
China
India
Japan
South Korea
Vietnam
Singapore
Australia
Rest of Asia Pacific
Middle East & Africa
Middle East
UAE
Egypt
Saudi Arabia
Qatar
Rest of Middle East
Africa
Nigeria
South Africa
Rest of Africa
Latin America
Brazil
Argentina
Colombia
Rest of Latin America
Request for Country Level Research Report: Country Level Customization Request
Available Customization
With the given market data, SNS Insider offers customization as per the company’s specific needs. The following customization options are available for the report:
Detailed Volume Analysis
Criss-Cross segment analysis (e.g. Product X Application)
Competitive Product Benchmarking
Geographic Analysis
Additional countries in any of the regions
Customized Data Representation
Detailed analysis and profiling of additional market players
The Artificial Teeth Market was USD 1.87 billion in 2023 and is expected to reach USD 3.83 billion by 2032, growing at a CAGR of 8.32% by 2024-2032.
The Orthobiologics Market was valued USD 7.15 billion in 2023 anticipated to grow USD 11.59 billion by 2032 with compound annual growth rate of 5.55% over the forecast period 2024-2032.
The Real-World Evidence/RWE Solutions Market Size was projected at USD 2.5 billion in 2023 and is expected to increase at a CAGR of 8.5% from 2024 to 2032, reaching USD 5.2 billion by 2032.
The Women’s Wearable Fertility Monitors Market Size was valued at USD 3.02 Billion in 2023, and is expected to reach USD 7.03 Billion by 2032, and grow at a CAGR of 10.34% over the forecast period 2024-2032.
The Medical Aesthetics Market Size was valued at USD 13.27 billion in 2023 and is witnessed to reach USD 31.06 billion by 2032 and grow at a CAGR of 10.55% over the forecast period 2024-2032.
The Cold Pain Therapy Market Size was valued at USD 1.91 billion in 2023, and is expected to reach USD 2.96 billion by 2032, and grow at a CAGR of 5% over the forecast period 2024-2032.
Hi! Click one of our member below to chat on Phone