image

Nuclear Imaging Equipment Market Report Scope & Overview:

Nuclear Imaging Equipment Market Revenue Analysis

Get More Information on Nuclear Imaging Equipment Market - Request Sample Report

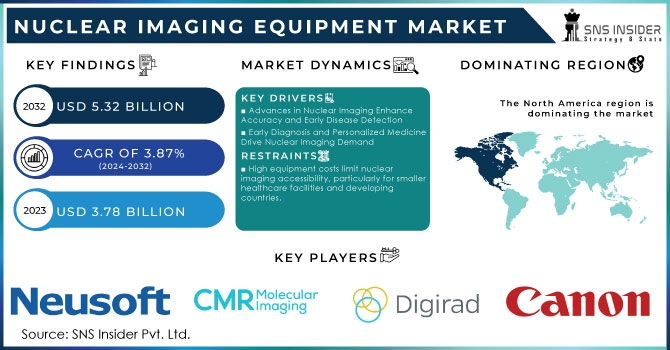
The Nuclear Imaging Equipment Market was valued at USD 3.78 billion in 2023, and it is expected to reach USD 5.32 billion by 2032, registering a CAGR of 3.87% from 2024 to 2032.

Nuclear imaging equipment that also represent one of the most efficient tools in medicine are PET and SPECT scanners. They can be used to diagnose cancer, examine organ functions and detect brain abnormalities. The strength of these machines is that they enable detailed internal images, helping to develop proper diagnoses and treatment. Over the time, these imaging devices have significantly contributed to the development of medical science. Moreover, the development of the technology in this area is one of the main factors that drive market growth.

The increase in demand that is associated with the number of chronic diseases, such as cancer, cardiovascular and neurological diseases is a great benefit. Due to the fact that a nuclear imaging is the most accurate way to diagnose these illnesses, the technology is in constant demand. In addition, the development of hybrid imaging systems, that will combine PET and CT functions, influence the usage of nuclear imaging systems, as they broaden the capabilities of it. Moreover, it is a globally acquired advantage as the population in whole is getting older and the elderly people have a faster pace of getting the above-mentioned diseases, so the demand for the diagnostics is tied to the age of a population. An additional point is the increasing popularity of healthcare and the growing amount of people who are afraid of getting a chronic disease. The early stages of all kinds of illnesses, including the chronic ones, can be noticed earlier due to regular check-ups that may suppose the usage of nuclear imaging systems, so the market in this sphere can be considered to be prospective.

The following are some of the factors propelling the market increasing worldwide cancer incidence, improvement in technology, clinical procedures and research, as well as an increase in the number of procedures in the field of nuclear medicine imaging. In 2022, there were 20 million new cancer cases worldwide, with a total death toll of 9.7 million. According to WHO, some 53.5 million people were alive within 5 years following a cancer diagnosis.

Moreover, several diseases are afflicting numerous populations across the globe, making the overall industry surge. There are many different diseases, such as cardiovascular diseases, cancer, neurologic diseases, and metabolic diseases, which have high prevalence rates and require the use of modern, advanced diagnostic and treatment processes for proper checkup, diagnosis, and management. All these have massively helped the overall industry’s growth. Nuclear imaging is a type of diagnostic imaging that plays a significant role in diagnosing, staging, and monitoring disease progression for all the above diseases. Furthermore, nuclear imaging provides a substantial amount of functional and metabolic information that has been less impacted. With the increase in the numbers of these chronic diseases, the demand for nuclear imaging machines is expected to grow further. Finally, healthcare professionals prefer nuclear imaging to accurately track disease progression and treatment response in order to better assess the patient’s well-being.

In January 2024: GE Healthcare partnered to acquire MIM Software, which is an international leader in the delivery of medical imaging analysis and artificial intelligence solutions. The solutions are applicable across radiation oncology molecular radiotherapy, diagnostic imaging and urology to imaging centers, hospitals, specialty clinics and research organizations around the world. Based on this acquisition, GE Healthcare seeks to exploit MIM Software’s skills in imaging analytics and digital workflow. The company plans to use them in different care domains to facilitate innovation. As a global healthcare provider, this strategic acquisition will empower GE Healthcare to grow by setting it apart. It will enhance its solutions to improve the health of patients and health systems around the world.

MARKET DYNAMICS

DRIVERS

Technological advances in nuclear imaging are enhancing imaging qualities, accuracy, and diagnostic scopes. Meanwhile, they prompt applications of the technology and improve abilities to detect diseases before their occurrence.

The modern applications of nuclear imaging technologies, such as hybrid imaging systems, including PET/CT and SPECT/CT, allow obtaining combined images of both anatomical and function details of the organs. Moreover, AI and machine learning programs are used in nuclear imaging techniques, as the new analyzation methods may improve the quality and imaging procedures. In modern medicine, it is revolutionizing, as AI is more efficient at reading the scans and provides scores of accuracies for each analysis. AI can recognize the trends that human would miss, which can provide diagnostic confirmation and reduces errors in decision-making. In addition, these technologies can affect the scopes of nuclear imaging since they could be used in new scopes, such as neurology or orthopedics. The analyses signal the disease long before its appearance, which can increase the range of applications. Detecting cancer earlier, for example, has been found to improve the chances of survival. Therefore, with these points in mind, it is possible to conclude that technological advances improve nuclear imaging.

Early diagnosis and personalized medicine drive demand for nuclear imaging by enabling tailored treatment plans and improving patient outcomes.

The major demand drivers for nuclear imaging technologies are early diagnosis and personalized medicine. This stems from the fact that the ability to discover diseases at the early stage is associated with their more successful treatment and positive patient outcomes. Moreover, nuclear imaging technologies, including PET and SPECT scanners, serve as one of the main approaches to achieving the mentioned goals because these modalities can deliver a comprehensive picture of the internal organs and tissues in the human body. Moreover, they help visualize the potentially disease-related changes that other technologies cannot reveal. Therefore, this imaging is also directly connected with personalized medicine, which presupposes delivering unique healthcare interventions corresponding precisely to the characteristics of a specific patient, such as their genome, lifestyle, and some other distinguishing disease markers. While nuclear imaging provides the required information to create such personalized medicine plans, they usually serve as blueprints for medical professionals, offering them sophisticated recommendations on the selection of healthcare interventions. The nuclear imaging in oncology helps determine the exact sizes of tumors and tailor a targeted therapy plan, known to be more efficient and less toxic than traditional treatment. Similar cases in a cardiology setting are evaluating various aspects of the heart function and blood flow with nuclear imaging and offering an advanced, precise intervention plan appropriate to the type of the cardiovascular pathology.

RESTRAIN

High equipment costs limit nuclear imaging accessibility, particularly for smaller healthcare facilities and developing countries.

High cost of equipment is one of the major barriers to the accessibility of nuclear imaging. The purchase, installation, and the maintenance of advanced technologies, such as PET or SPECT scanners, require significant investment. Smaller healthcare facilities and some developing countries cannot afford it. Another issue is the insufficient budget and an urgent need for investment in healthcare infrastructure in the context of developing countries. They must allocate resources to the purchase of other equipment and the improvement of healthcare services, nuclear imaging thus becoming less accessible for them. In the result, the technology may not be available in some geographical areas, influencing the possibility of early disease detection and relevant therapy planning. As they help identify the conditions that are difficult to detect using other diagnostic methods, the existence of such disparities is an issue. They call for the development of new cost-effective solutions and investments in the necessary medical equipment to ensure that the technologies are accessible in all parts of the world.

KEY MARKET SEGMENTATION
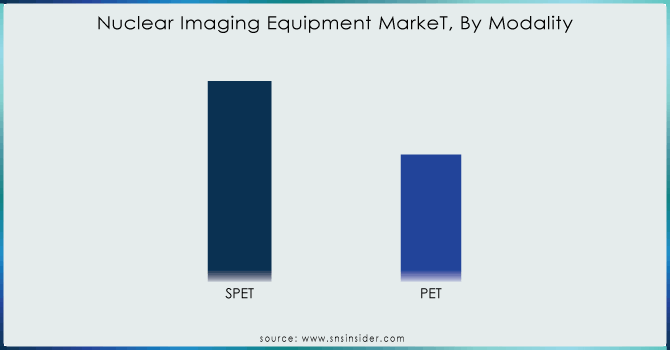
By Modality

The single photon emission computed tomography segment, and it was 59% in 2023. SPECT equipment is commonly more cost-effective, which allows it to be used by a bigger amount of healthcare facilities. Besides, this kind of imaging involves various radiotracers and imaging agents that are appropriate for specific diagnostic tests and provide a certain degree of advantages.

The Positron emission tomography is expected to grow at the fastest CAGR 4.04% over the forecast period. Advancement in PET imaging technology is a vital factor driving the market growth. Better resolution is offered by the PET scanners facilitate and provide more precise metabolic information, which is of utmost importance across several specialties including oncology, neurology, and cardiology. Research and developmental studies are being continuously carried out with the focus to improve PET imaging techniques.

Nuclear-Imaging-Equipment-MarkeT-By-Modality

Need any customization research on Nuclear Imaging Equipment Market - Enquiry Now

By Application

The oncology segment was leading and has the largest revenue share of 49.21% in 2023. The prevalence of cancer in the population and advanced nuclear imaging equipment to detect and stage the tumour contributed to this outcome. PET and SPECT imaging supply vital information regarding the diagnosis of cancer and the planning and control of treatment.

The cardiology segment is expected to grow at the fastest rate 4.11% over the forecast period. The increased incidence of cardiovascular diseases and the increased understanding about the nuclear imaging possibilities of diagnosing are the factors anticipated to drive the sector.

By End-use

The biggest share of revenue, 52.75%, was grabbed by the hospitals segment in 2023. The adoption rates of nuclear imaging equipment have been rising quickly in hospitals. This is likely because the hospital setting is better equipped to handle more complex cases. In such cases, the detailed diagnostic precision of nuclear imaging and the ability to perform PET and SPECT scans are of immense importance to accurate diagnosis and treatment planning. At the same time, hospitals also typically have larger budgets and resources compared to standalone imaging centers.
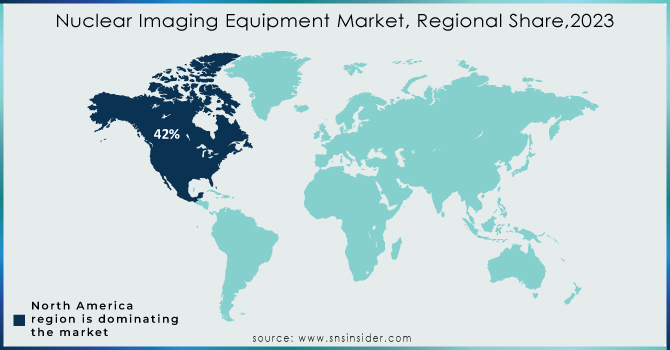
REGIONAL ANALYSIS

North America dominated the market and accounted for the largest revenue share of 42.00% in 2023 and is expected to stay dominant over the forecast period. The well-established healthcare infrastructure, high adoption of advanced technology and the high patient population suffering from chronic diseases are the factors contributing to its large revenue share in the nuclear imaging equipment market.

Asia Pacific is expected to register the highest CAGR of 4.06% moreover the forecast period. The high number of cases of cancer, increasing healthcare expenditure and the development in healthcare infrastructure in this region’s countries, such as Thailand, Malaysia, China, and India, could moreover tribute to the growth of the market.

In September 2023: the installation of Pet CT scan Vision 600 – PET CT scanner was installed in India’s Kokilaben Dhirubhai Ambani Hospital. This is a major step in the fight against cancer by enabling early detection of malignancies and other lesions.

Nuclear-Imaging-Equipment-Market-Regional-Share2023

Key Players

The major key players are DIGIRAD Corporation, Neusoft Corporation, CANON MEDICAL SYSTEMS CORPORATION, SurgicEye GmbH, CMR Naviscan., Absolute Imaging Inc., Bartec Technologies Ltd., BCL X-Ray Canada Inc., TTG Imaging Solutions, LLC., Lucerno Dynamics LLC.m, Berthold Technologies GmbH & Co.KG, Incom Inc., Koninklijke Philips N.V., GE Healthcare, Siemens Healthineers AG and others.

Recent Developments

In May 2023: Koninklijke Philips N.V., Elekta, and Mercurius Health announced a 3-year agreement to install diagnostic and therapeutic oncology equipment at Mercurius Health’s newly acquired Robert Janker Klinik cancer center in Bonn, Germany. This collaboration highlights the growing trend of comprehensive cancer care solutions incorporating nuclear imaging technologies.

Nuclear Imaging Equipment Market Report Scope:

Report Attributes Details
Market Size in 2024 US$ 3.78 billion
Market Size by 2032 US$ 5.38 Billion
CAGR CAGR of 3.87% From 2024 to 2032
Base Year 2023
Forecast Period 2024-2032
Historical Data 2020-2022
Report Scope & Coverage Market Size, Segments Analysis, Competitive  Landscape, Regional Analysis, DROC & SWOT Analysis, Forecast Outlook
Key Segments • By Modality (SPET, PET)
• By Application (Cardiology, Oncology, Neurology, Others)
• By End-use (Hospitals, Imaging Centers, R&D, Others)
Regional Analysis/Coverage North America (US, Canada, Mexico), Europe (Eastern Europe [Poland, Romania, Hungary, Turkey, Rest of Eastern Europe] Western Europe] Germany, France, UK, Italy, Spain, Netherlands, Switzerland, Austria, Rest of Western Europe]), Asia Pacific (China, India, Japan, South Korea, Vietnam, Singapore, Australia, Rest of Asia Pacific), Middle East & Africa (Middle East [UAE, Egypt, Saudi Arabia, Qatar, Rest of Middle East], Africa [Nigeria, South Africa, Rest of Africa], Latin America (Brazil, Argentina, Colombia, Rest of Latin America)
Company Profiles DIGIRAD Corporation, Neusoft Corporation, CANON MEDICAL SYSTEMS CORPORATION, SurgicEye GmbH, CMR Naviscan., Absolute Imaging Inc., Bartec Technologies Ltd., BCL X-Ray Canada Inc., TTG Imaging Solutions, LLC., Lucerno Dynamics LLC.m, Berthold Technologies GmbH & Co.KG, Incom Inc., Koninklijke Philips N.V., GE Healthcare, Siemens Healthineers AG
Key Drivers • Technological advances in nuclear imaging are enhancing imaging qualities, accuracy, and diagnostic scopes. Meanwhile, they prompt applications of the technology and improve abilities to detect diseases before their occurrence.
• Early diagnosis and personalized medicine drive demand for nuclear imaging by enabling tailored treatment plans and improving patient outcomes.
RESTRAINTS • High equipment costs limit nuclear imaging accessibility, particularly for smaller healthcare facilities and developing countries.

Frequently Asked Questions

Ans:  The Nuclear Imaging Equipment Market is expected to grow at a CAGR of 3.87%.

Ans: Nuclear Imaging Equipment Market size was USD 3.78 billion in 2023 and is expected to Reach USD 5.32 billion by 2032.

Ans: Single photon emission computed tomography (SPET) is the dominating segment by modality in the Nuclear Imaging Equipment Market.

Ans: Technological advancements in nuclear imaging are improving image quality, precision, and diagnostic capabilities, expanding applications, and enabling earlier disease detection.

Ans: North America is the dominating region in the Nuclear Imaging Equipment Market.

TABLE OF CONTENTS

1. Introduction

1.1 Market Definition

1.2 Scope

1.3 Research Assumptions

2. Industry Flowchart

3. Research Methodology

4. Market Dynamics

4.1 Drivers

4.2 Restraints

5. Porter’s 5 Forces Model

6. Pest Analysis

7. Nuclear Imaging Equipment Market Segmentation, By Product

7.1 Introduction

7.2 SPET

7.3 PET

8. Nuclear Imaging Equipment Market Segmentation, By Application

8.1 Introduction

8.2 Cardiology

8.3 Oncology

8.4 Neurology

8.5 Others

9. Nuclear Imaging Equipment Market Segmentation, By End-User

9.1 Introduction

9.2 Hospitals

9.3 Imaging Centers

9.4 R&D

9.5 Others

10. Regional Analysis

10.1 Introduction

10.2 North America

10.2.1 Trend Analysis

10.2.2 North America Nuclear Imaging Equipment Market, By Country

10.2.3 North America Nuclear Imaging Equipment Market, By Product

10.2.4 North America Nuclear Imaging Equipment Market, By Application

10.2.5 North America Nuclear Imaging Equipment Market, By End-User

10.2.6 USA

10.2.6.1 USA Nuclear Imaging Equipment Market, By Product

10.2.6.2 USA Nuclear Imaging Equipment Market, By Application

10.2.6.3 USA Nuclear Imaging Equipment Market, By End-User

10.2.7 Canada

10.2.7.1 Canada Nuclear Imaging Equipment Market, By Product

10.2.7.2 Canada Nuclear Imaging Equipment Market, By Application

10.2.7.3 Canada Nuclear Imaging Equipment Market, By End-User

10.2.8 Mexico

10.2.8.1 Mexico Nuclear Imaging Equipment Market, By Product

10.2.8.2 Mexico Nuclear Imaging Equipment Market, By Application

10.2.8.3 Mexico Nuclear Imaging Equipment Market, By End-User

10.3 Europe

10.3.1 Trend Analysis

10.3.2 Eastern Europe

10.3.2.1 Eastern Europe Nuclear Imaging Equipment Market, By Country

10.3.2.2 Eastern Europe Nuclear Imaging Equipment Market, By Product

10.3.2.3 Eastern Europe Nuclear Imaging Equipment Market, By Application

10.3.2.4 Eastern Europe Nuclear Imaging Equipment Market, By End-User

10.3.2.5 Poland

10.3.2.5.1 Poland Nuclear Imaging Equipment Market, By Product

10.3.2.5.2 Poland Nuclear Imaging Equipment Market, By Application

10.3.2.5.3 Poland Nuclear Imaging Equipment Market, By End-User

10.3.2.6 Romania

10.3.2.6.1 Romania Nuclear Imaging Equipment Market, By Product

10.3.2.6.2 Romania Nuclear Imaging Equipment Market, By Application

10.3.2.6.4 Romania Nuclear Imaging Equipment Market, By End-User

10.3.2.7 Hungary

10.3.2.7.1 Hungary Nuclear Imaging Equipment Market, By Product

10.3.2.7.2 Hungary Nuclear Imaging Equipment Market, By Application

10.3.2.7.3 Hungary Nuclear Imaging Equipment Market, By End-User

10.3.2.8 Turkey

10.3.2.8.1 Turkey Nuclear Imaging Equipment Market, By Product

10.3.2.8.2 Turkey Nuclear Imaging Equipment Market, By Application

10.3.2.8.3 Turkey Nuclear Imaging Equipment Market, By End-User

10.3.2.9 Rest of Eastern Europe

10.3.2.9.1 Rest of Eastern Europe Nuclear Imaging Equipment Market, By Product

10.3.2.9.2 Rest of Eastern Europe Nuclear Imaging Equipment Market, By Application

10.3.2.9.3 Rest of Eastern Europe Nuclear Imaging Equipment Market, By End-User

10.3.3 Western Europe

10.3.3.1 Western Europe Nuclear Imaging Equipment Market, By Country

10.3.3.2 Western Europe Nuclear Imaging Equipment Market, By Product

10.3.3.3 Western Europe Nuclear Imaging Equipment Market, By Application

10.3.3.4 Western Europe Nuclear Imaging Equipment Market, By End-User

10.3.3.5 Germany

10.3.3.5.1 Germany Nuclear Imaging Equipment Market, By Product

10.3.3.5.2 Germany Nuclear Imaging Equipment Market, By Application

10.3.3.5.3 Germany Nuclear Imaging Equipment Market, By End-User

10.3.3.6 France

10.3.3.6.1 France Nuclear Imaging Equipment Market, By Product

10.3.3.6.2 France Nuclear Imaging Equipment Market, By Application

10.3.3.6.3 France Nuclear Imaging Equipment Market, By End-User

10.3.3.7 UK

10.3.3.7.1 UK Nuclear Imaging Equipment Market, By Product

10.3.3.7.2 UK Nuclear Imaging Equipment Market, By Application

10.3.3.7.3 UK Nuclear Imaging Equipment Market, By End-User

10.3.3.8 Italy

10.3.3.8.1 Italy Nuclear Imaging Equipment Market, By Product

10.3.3.8.2 Italy Nuclear Imaging Equipment Market, By Application

10.3.3.8.3 Italy Nuclear Imaging Equipment Market, By End-User

10.3.3.9 Spain

10.3.3.9.1 Spain Nuclear Imaging Equipment Market, By Product

10.3.3.9.2 Spain Nuclear Imaging Equipment Market, By Application

10.3.3.9.3 Spain Nuclear Imaging Equipment Market, By End-User

10.3.3.10 Netherlands

10.3.3.10.1 Netherlands Nuclear Imaging Equipment Market, By Product

10.3.3.10.2 Netherlands Nuclear Imaging Equipment Market, By Application

10.3.3.10.3 Netherlands Nuclear Imaging Equipment Market, By End-User

10.3.3.11 Switzerland

10.3.3.11.1 Switzerland Nuclear Imaging Equipment Market, By Product

10.3.3.11.2 Switzerland Nuclear Imaging Equipment Market, By Application

10.3.3.11.3 Switzerland Nuclear Imaging Equipment Market, By End-User

10.3.3.12 Austria

10.3.3.12.1 Austria Nuclear Imaging Equipment Market, By Product

10.3.3.12.2 Austria Nuclear Imaging Equipment Market, By Application

10.3.3.12.3 Austria Nuclear Imaging Equipment Market, By End-User

10.3.3.13 Rest of Western Europe

10.3.3.13.1 Rest of Western Europe Nuclear Imaging Equipment Market, By Product

10.3.3.13.2 Rest of Western Europe Nuclear Imaging Equipment Market, By Application

10.3.3.13.3 Rest of Western Europe Nuclear Imaging Equipment Market, By End-User

10.4 Asia-Pacific

10.4.1 Trend Analysis

10.4.2 Asia-Pacific Nuclear Imaging Equipment Market, By Country

10.4.3 Asia-Pacific Nuclear Imaging Equipment Market, By Product

10.4.4 Asia-Pacific Nuclear Imaging Equipment Market, By Application

10.4.5 Asia-Pacific Nuclear Imaging Equipment Market, By End-User

10.4.6 China

10.4.6.1 China Nuclear Imaging Equipment Market, By Product

10.4.6.2 China Nuclear Imaging Equipment Market, By Application

10.4.6.3 China Nuclear Imaging Equipment Market, By End-User

10.4.7 India

10.4.7.1 India Nuclear Imaging Equipment Market, By Product

10.4.7.2 India Nuclear Imaging Equipment Market, By Application

10.4.7.3 India Nuclear Imaging Equipment Market, By End-User

10.4.8 Japan

10.4.8.1 Japan Nuclear Imaging Equipment Market, By Product

10.4.8.2 Japan Nuclear Imaging Equipment Market, By Application

10.4.8.3 Japan Nuclear Imaging Equipment Market, By End-User

10.4.9 South Korea

10.4.9.1 South Korea Nuclear Imaging Equipment Market, By Product

10.4.9.2 South Korea Nuclear Imaging Equipment Market, By Application

10.4.9.3 South Korea Nuclear Imaging Equipment Market, By End-User

10.4.10 Vietnam

10.4.10.1 Vietnam Nuclear Imaging Equipment Market, By Product

10.4.10.2 Vietnam Nuclear Imaging Equipment Market, By Application

10.4.10.3 Vietnam Nuclear Imaging Equipment Market, By End-User

10.4.11 Singapore

10.4.11.1 Singapore Nuclear Imaging Equipment Market, By Product

10.4.11.2 Singapore Nuclear Imaging Equipment Market, By Application

10.4.11.3 Singapore Nuclear Imaging Equipment Market, By End-User

10.4.12 Australia

10.4.12.1 Australia Nuclear Imaging Equipment Market, By Product

10.4.12.2 Australia Nuclear Imaging Equipment Market, By Application

10.4.12.3 Australia Nuclear Imaging Equipment Market, By End-User

10.4.13 Rest of Asia-Pacific

10.4.13.1 Rest of Asia-Pacific Nuclear Imaging Equipment Market, By Product

10.4.13.2 Rest of Asia-Pacific Nuclear Imaging Equipment Market, By Application

10.4.13.3 Rest of Asia-Pacific Nuclear Imaging Equipment Market, By End-User

10.5 Middle East & Africa

10.5.1 Trend Analysis

10.5.2 Middle East

10.5.2.1 Middle East Nuclear Imaging Equipment Market, By Country

10.5.2.2 Middle East Nuclear Imaging Equipment Market, By Product

10.5.2.3 Middle East Nuclear Imaging Equipment Market, By Application

10.5.2.4 Middle East Nuclear Imaging Equipment Market, By End-User

10.5.2.5 UAE

10.5.2.5.1 UAE Nuclear Imaging Equipment Market, By Product

10.5.2.5.2 UAE Nuclear Imaging Equipment Market, By Application

10.5.2.5.3 UAE Nuclear Imaging Equipment Market, By End-User

10.5.2.6 Egypt

10.5.2.6.1 Egypt Nuclear Imaging Equipment Market, By Product

10.5.2.6.2 Egypt Nuclear Imaging Equipment Market, By Application

10.5.2.6.3 Egypt Nuclear Imaging Equipment Market, By End-User

10.5.2.7 Saudi Arabia

10.5.2.7.1 Saudi Arabia Nuclear Imaging Equipment Market, By Product

10.5.2.7.2 Saudi Arabia Nuclear Imaging Equipment Market, By Application

10.5.2.7.3 Saudi Arabia Nuclear Imaging Equipment Market, By End-User

10.5.2.8 Qatar

10.5.2.8.1 Qatar Nuclear Imaging Equipment Market, By Product

10.5.2.8.2 Qatar Nuclear Imaging Equipment Market, By Application

10.5.2.8.3 Qatar Nuclear Imaging Equipment Market, By End-User

10.5.2.9 Rest of Middle East

10.5.2.9.1 Rest of Middle East Nuclear Imaging Equipment Market, By Product

10.5.2.9.2 Rest of Middle East Nuclear Imaging Equipment Market, By Application

10.5.2.9.3 Rest of Middle East Nuclear Imaging Equipment Market, By End-User

10.5.3 Africa

10.5.3.1 Africa Nuclear Imaging Equipment Market, By Country

10.5.3.2 Africa Nuclear Imaging Equipment Market, By Product

10.5.3.3 Africa Nuclear Imaging Equipment Market, By Application

10.5.3.4 Africa Nuclear Imaging Equipment Market, By End-User

10.5.3.5 Nigeria

10.5.3.5.1 Nigeria Nuclear Imaging Equipment Market, By Product

10.5.3.5.2 Nigeria Nuclear Imaging Equipment Market, By Application

10.5.3.5.3 Nigeria Nuclear Imaging Equipment Market, By End-User

10.5.3.6 South Africa

10.5.3.6.1 South Africa Nuclear Imaging Equipment Market, By Product

10.5.3.6.2 South Africa Nuclear Imaging Equipment Market, By Application

10.5.3.6.3 South Africa Nuclear Imaging Equipment Market, By End-User

10.5.3.7 Rest of Africa

10.5.3.7.1 Rest of Africa Nuclear Imaging Equipment Market, By Product

10.5.3.7.2 Rest of Africa Nuclear Imaging Equipment Market, By Application

10.5.3.7.3 Rest of Africa Nuclear Imaging Equipment Market, By End-User

10.6 Latin America

10.6.1 Trend Analysis

10.6.2 Latin America Nuclear Imaging Equipment Market, By Country

10.6.3 Latin America Nuclear Imaging Equipment Market, By Product

10.6.4 Latin America Nuclear Imaging Equipment Market, By Application

10.6.5 Latin America Nuclear Imaging Equipment Market, By End-User

10.6.6 Brazil

10.6.6.1 Brazil Nuclear Imaging Equipment Market, By Product

10.6.6.2 Brazil Nuclear Imaging Equipment Market, By Application

10.6.6.3 Brazil Nuclear Imaging Equipment Market, By End-User

10.6.7 Argentina

10.6.7.1 Argentina Nuclear Imaging Equipment Market, By Product

10.6.7.2 Argentina Nuclear Imaging Equipment Market, By Application

10.6.7.3 Argentina Nuclear Imaging Equipment Market, By End-User

10.6.8 Colombia

10.6.8.1 Colombia Nuclear Imaging Equipment Market, By Product

10.6.8.2 Colombia Nuclear Imaging Equipment Market, By Application

10.6.8.3 Colombia Nuclear Imaging Equipment Market, By End-User

10.6.9 Rest of Latin America

10.6.9.1 Rest of Latin America Nuclear Imaging Equipment Market, By Product

10.6.9.2 Rest of Latin America Nuclear Imaging Equipment Market, By Application

10.6.9.3 Rest of Latin America Nuclear Imaging Equipment Market, By End-User

11. Company Profiles

11.1 DIGIRAD Corporation

11.1.1 Company Overview

11.1.2 Financial

11.1.3 Products/ Services Offered

11.1.4 The SNS View

11.2 Neusoft Corporation

11.2.1 Company Overview

11.2.2 Financial

11.2.3 Products/ Services Offered

11.2.4 The SNS View

11.3 CANON MEDICAL SYSTEMS CORPORATION

11.3.1 Company Overview

11.3.2 Financial

11.3.3 Products/ Services Offered

11.3.4 The SNS View

11.4 SurgicEye GmbH

11.4.1 Company Overview

11.4.2 Financial

11.4.3 Products/ Services Offered

11.4.4 The SNS View

11.5 CMR Naviscan.

11.5.1 Company Overview

11.5.2 Financial

11.5.3 Products/ Services Offered

11.5.4 The SNS View

11.6 Absolute Imaging Inc.

11.6.1 Company Overview

11.6.2 Financial

11.6.3 Products/ Services Offered

11.6.4 The SNS View

11.7 Bartec Technologies Ltd.

11.7.1 Company Overview

11.7.2 Financial

11.7.3 Products/ Services Offered

11.7.4 The SNS View

11.8 BCL X-Ray Canada Inc.

11.8.1 Company Overview

11.8.2 Financial

11.8.3 Products/ Services Offered

11.8.4 The SNS View

11.9 TTG Imaging Solutions, LLC.

11.9.1 Company Overview

11.9.2 Financial

11.9.3 Products/ Services Offered

11.9.4 The SNS View

11.10 Koninklijke Philips N.V.

11.10.1 Company Overview

11.10.2 Financial

11.10.3 Products/ Services Offered

11.10.4 The SNS View

12. Competitive Landscape

12.1 Competitive Benchmarking

12.2 Market Share Analysis

12.3 Recent Developments

12.3.1 Industry News

12.3.2 Company News

12.3.3 Mergers & Acquisitions

13. Use Case and Best Practices

14. Conclusion

An accurate research report requires proper strategizing as well as implementation. There are multiple factors involved in the completion of good and accurate research report and selecting the best methodology to compete the research is the toughest part. Since the research reports we provide play a crucial role in any company’s decision-making process, therefore we at SNS Insider always believe that we should choose the best method which gives us results closer to reality. This allows us to reach at a stage wherein we can provide our clients best and accurate investment to output ratio.

Each report that we prepare takes a timeframe of 350-400 business hours for production. Starting from the selection of titles through a couple of in-depth brain storming session to the final QC process before uploading our titles on our website we dedicate around 350 working hours. The titles are selected based on their current market cap and the foreseen CAGR and growth.


The 5 steps process:

Step 1: Secondary Research:

Secondary Research or Desk Research is as the name suggests is a research process wherein, we collect data through the readily available information. In this process we use various paid and unpaid databases which our team has access to and gather data through the same. This includes examining of listed companies’ annual reports, Journals, SEC filling etc. Apart from this our team has access to various associations across the globe across different industries. Lastly, we have exchange relationships with various university as well as individual libraries.

Secondary Research

Step 2: Primary Research

When we talk about primary research, it is a type of study in which the researchers collect relevant data samples directly, rather than relying on previously collected data.  This type of research is focused on gaining content specific facts that can be sued to solve specific problems. Since the collected data is fresh and first hand therefore it makes the study more accurate and genuine.

We at SNS Insider have divided Primary Research into 2 parts.

Part 1 wherein we interview the KOLs of major players as well as the upcoming ones across various geographic regions. This allows us to have their view over the market scenario and acts as an important tool to come closer to the accurate market numbers. As many as 45 paid and unpaid primary interviews are taken from both the demand and supply side of the industry to make sure we land at an accurate judgement and analysis of the market.

This step involves the triangulation of data wherein our team analyses the interview transcripts, online survey responses and observation of on filed participants. The below mentioned chart should give a better understanding of the part 1 of the primary interview.

Primary Research

Part 2: In this part of primary research the data collected via secondary research and the part 1 of the primary research is validated with the interviews from individual consultants and subject matter experts.

Consultants are those set of people who have at least 12 years of experience and expertise within the industry whereas Subject Matter Experts are those with at least 15 years of experience behind their back within the same space. The data with the help of two main processes i.e., FGDs (Focused Group Discussions) and IDs (Individual Discussions). This gives us a 3rd party nonbiased primary view of the market scenario making it a more dependable one while collation of the data pointers.

Step 3: Data Bank Validation

Once all the information is collected via primary and secondary sources, we run that information for data validation. At our intelligence centre our research heads track a lot of information related to the market which includes the quarterly reports, the daily stock prices, and other relevant information. Our data bank server gets updated every fortnight and that is how the information which we collected using our primary and secondary information is revalidated in real time.

Data Bank Validation

Step 4: QA/QC Process

After all the data collection and validation our team does a final level of quality check and quality assurance to get rid of any unwanted or undesired mistakes. This might include but not limited to getting rid of the any typos, duplication of numbers or missing of any important information. The people involved in this process include technical content writers, research heads and graphics people. Once this process is completed the title gets uploader on our platform for our clients to read it.

Step 5: Final QC/QA Process:

This is the last process and comes when the client has ordered the study. In this process a final QA/QC is done before the study is emailed to the client. Since we believe in giving our clients a good experience of our research studies, therefore, to make sure that we do not lack at our end in any way humanly possible we do a final round of quality check and then dispatch the study to the client.

Key Segments

By Modality

  • SPET
  • PET

By Application

  • Cardiology
  • Oncology
  • Neurology
  • Others

By End-use

  • Hospitals
  • Imaging Centers
  • R&D
  • Others

Request for Segment Customization as per your Business Requirement: Segment Customization Request

Regional Coverage


North America

  • US
  • Canada
  • Mexico

Europe

  • Eastern Europe
    • Poland
    • Romania
    • Hungary
    • Turkey
    • Rest of Eastern Europe
  • Western Europe
    • Germany
    • France
    • UK
    • Italy
    • Spain
    • Netherlands
    • Switzerland
    • Austria
    • Rest of Western Europe

Asia Pacific

  • China
  • India
  • Japan
  • South Korea
  • Vietnam
  • Singapore
  • Australia
  • Rest of Asia Pacific

Middle East & Africa

  • Middle East
    • UAE
    • Egypt
    • Saudi Arabia
    • Qatar
    • Rest of the Middle East
  • Africa
    • Nigeria
    • South Africa
    • Rest of Africa

Latin America

  • Brazil
  • Argentina
  • Colombia
  • Rest of Latin America

Request for Country Level Research Report: Country Level Customization Request

Available Customization

With the given market data, SNS Insider offers customization as per the company’s specific needs. The following customization options are available for the report:

  • Product Analysis
  • Criss-Cross segment analysis (e.g. Product X Application)
  • Product Matrix which gives a detailed comparison of product portfolio of each company
  • Geographic Analysis
  • Additional countries in any of the regions
  • Company Information
  • Detailed analysis and profiling of additional market players (Up to five)


  •            5000 (33% Discount)


  •            8950 (40% Discount)


  •            3050 (23% Discount)

Start a Conversation

Hi! Click one of our member below to chat on Phone