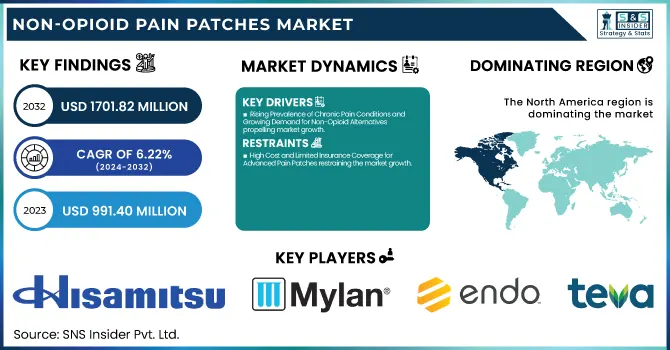
The Non-opioid Pain Patches Market size was estimated at USD 991.40 million in 2023 and is projected to reach USD 1701.82 million by 2032, growing at a CAGR of 6.22% from 2024-2032.
To Get more information on Non-opioid Pain Patches Market - Request Free Sample Report
The global non-opioid pain patches market report provides statistical data, such as the prevalence and incidence of chronic and acute pain conditions in 2023, broken down by major demographics and regions. We also provide comprehensive prescription trends for non-opioid pain patches, comparing regional differences based on healthcare policies and reimbursement structures. A unique feature of our analysis is the complete segmentation of healthcare expenditure on pain management therapies by sources of funds (government, commercial, private, and out-of-pocket), providing information regarding market affordability and accessibility. These unique data points provide a more in-depth analysis of market trends beyond common growth patterns.
Drivers
Rising Prevalence of Chronic Pain Conditions and Growing Demand for Non-Opioid Alternatives propelling market growth.
The rise in the number of chronic pain diseases like arthritis, neuropathy, and musculoskeletal diseases is a prime growth driver for the Non-opioid Pain Patches Market. The CDC states that about 51.6 million U.S. adults have chronic pain, and more than 17.1 million have high-impact pain, which restricts daily activities. The increasing worries about opioid addiction and the opioid epidemic have driven patients and healthcare professionals toward safer options such as non-opioid pain patches. The recent approvals, including the FDA approval of capsaicin-containing Qutenza patches for neuropathic pain in 2023, demonstrate the increased popularity of non-opioid treatments. In addition, the inclusion of lidocaine and diclofenac patches in worldwide pain management protocols has further contributed to market demand, facilitating their use in clinics and over-the-counter (OTC) sales.
Regulatory Support and Favorable Reimbursement Policies for Non-Opioid Pain Management accelerating the market.
Regulatory agencies across the world are increasingly encouraging non-opioid pain management options to combat opioid abuse. In 2022, the U.S. FDA launched new labeling and prescribing recommendations promoting the use of non-opioid therapies as initial treatment for acute and chronic pain. Further, the Centers for Medicare & Medicaid Services (CMS) increased reimbursement for non-opioid pain management options such as lidocaine and diclofenac patches in outpatient and post-surgery care plans. All these policy adjustments are causing more accessibility and affordability for the patients. European nations such as Germany and the U.K. also updated their pain management programs in 2023, introducing non-opioid patches as a better substitute. This regulatory change, coupled with increasing R&D spending on new transdermal technologies, will drive market penetration and speed the uptake of advanced pain relief technologies.
Restraint
High Cost and Limited Insurance Coverage for Advanced Pain Patches restraining the market growth.
One of the major constraints in the Non-opioid Pain Patches Market is the exorbitant price of sophisticated formulations and the limited insurance coverage for some non-opioid pain relief patches. Although conventional ones such as lidocaine and diclofenac patches are easily accessible, newer and more potent patches such as high-concentration capsaicin (Qutenza) or ketoprofen patches tend to be pricey. For example, one patch application of the Qutenza patch costs more than USD 800 per treatment and is not an option for many patients in the absence of broad insurance. In addition, insurers place limitations on reimbursement, assigning non-opioid pain patches as secondary alternatives to pain control instead of a primary solution to pain management. This economic limitation discourages acceptance, particularly from older and poor patients, effectively slowing down the growth of the market in the face of heightened demand for alternative opioids.
Opportunities
Expansion into Emerging Markets and Aging Population Growth has a significant opportunity for the Non-opioid Pain Patches Market.
The Non-opioid Pain Patches Market has a tremendous scope of growth in emerging economies, fueled by enhanced accessibility to healthcare, increasing disposable incomes, and an expanding consciousness regarding non-opioid pain management products. These regions are experiencing swift advancement in healthcare infrastructure and regulatory assistance for alternative pain management therapies. In addition, the aging world population is on the increase, with the WHO projecting that more than 2 billion people will be 60 years and older by 2050—a population at significant risk for chronic pain diseases like arthritis, neuropathy, and musculoskeletal disorders. Since healthcare systems within these markets favor cost-efficient, long-term solutions for pain management, producers can capitalize on underserved medical requirements through increased distribution networks, regional product launches, and strategic alliances with local healthcare practitioners.
Challenges
The stringent regulatory landscape surrounding pain management products poses a major challenge for the Non-opioid Pain Patches Market.
The stringent regulatory environment around pain management products is a significant challenge to the Non-opioid Pain Patches Market. Institutions like the U.S. FDA and EMA demand rigorous clinical trials and safety information for new pain relief patches, which increases the time and cost of market entry. For instance, Qutenza (capsaicin 8%) was tried and re-formulated several times before gaining wider market approval. Moreover, gaining approval for higher-concentration or new formulation patches is even more difficult because of safety issues regarding skin irritation, absorption levels, and sustained efficacy. It also becomes challenging for companies to obtain reimbursement approvals from payers, as most non-opioid patches are regarded as secondary treatments. Such regulatory and reimbursement obstacles can hinder innovation and restrict patients' access to effective non-opioid pain relief products.
By Patch Type
The Lidocaine Patches segment dominated the Non-opioid Pain Patches Market with a 36.15% market share in 2023, as it has the widest application in the treatment of chronic pain, postherpetic neuralgia, and musculoskeletal disorders. The Lidocaine patches exert local analgesic effects through sodium channel blockade in nerve endings, suppressing pain sensation with minimal systemic side effects. The large prevalence of chronic pain disorders, especially in North America and Europe, has stimulated demand for Lidocaine 4% and 5% patches that are readily available over the counter or on prescription. Furthermore, favorable reimbursement policies, high clinical efficacy, and FDA approvals have supported their leadership in the market. Pharmaceutical industry leaders like Hisamitsu Pharmaceutical, Teva, and Endo Pharmaceuticals keep growing production, further cementing lidocaine's leadership as a go-to non-opioid pain reliever.
The Capsaicin Patches market is expected to grow the fastest over the forecast period, stimulated by growing clinical uptake, broadening research on neuropathic pain relief, and a growing need for long-lasting pain management drugs. Capsaicin from chili peppers activates TRPV1 receptors to numb pain channels for prolonged relief against diabetic neuropathy, osteoarthritis, and surgical pain. Veritas Pharma's Qutenza (8% capsaicin patch) has also garnered considerable interest by being a high-concentration product with analgesic action lasting three months following one dose. Moreover, increasing demand for plant-based and non-systemic pain relief, combined with the rising number of government programs that favor non-opioid treatments, is fueling market growth. Capsaicin formulation improvements, better patient compliance, and increased market presence in Asia-Pacific and Europe will continue to spur its growth.
By Distribution Channel
The Retail Pharmacies segment dominated the market with a 45% market share in 2023 through its excellent accessibility, convenience, and instant product availability. Retail pharmacies are the key distribution channel for over-the-counter (OTC) and prescription-based pain patches, such as Lidocaine and Diclofenac patches, which are well-prescribed for localized relief of pain. In the developed markets of North America and Europe, highly established pharmacy chains like CVS Health, Walgreens, and Boots offer convenient access to FDA-approved non-opioid painkillers, helping drive sales. Moreover, consultation by pharmacists and insurance reimbursement for prescription patches also help reinforce consumer confidence and uptake. The increased focus on self-medication and rapid pain relief solutions coupled with robust retail pharmacy networks in suburban and urban areas has fortified this segment's market leadership.
The Online Pharmacies segment is expected to experience the fastest growth with a 7.21% CAGR over the forecast period, fueled by the expansion of digital healthcare, growing e-commerce penetration, and burgeoning demand for home delivery of drugs. Online pharmacy stores provide discounted prices, subscription-based pain relief solutions, and access to a broad list of non-opioid pain patches, thus appealing to tech-friendly consumers and chronic pain patients who value convenience. The COVID-19 pandemic surged the use of telemedicine and online prescription fulfillment, resulting in growing demand for digital pharmacy services. Moreover, government efforts toward regulation and support of online pharmacy sales in North America and Asia-Pacific are aiding expansion. Businesses like Amazon Pharmacy, GoodRx, and specialized digital health platforms are also augmenting product accessibility, driving speedy growth in new markets such as India, China, and Latin America.
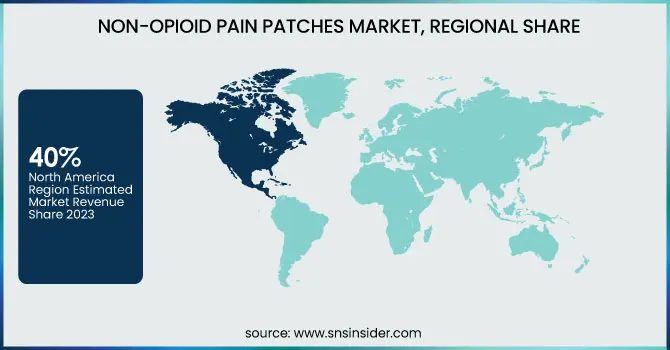
North America dominated the Non-opioid Pain Patches Market with a 40% market share in 2023 on account of its established healthcare system, high incidence of chronic pain disorders, and strict regulations governing the use of opioids. The CDC estimates that more than 50 million Americans have chronic pain, fueling the need for safer, non-opioid patches. Moreover, government support and FDA approvals for new pain management treatments, including the recent January 2025 approval of suzetrigine (Journavx), have fueled market growth. The dominance of key pharmaceutical firms, strong adoption rates of sophisticated pain management solutions, and robust reimbursement policies further support North America's leadership. With the relentless opioid epidemic leading healthcare professionals and patients towards non-addictive pain management measures, the area remains the largest user of non-opioid pain patches.
Asia-Pacific is witnessing the fastest expansion in the Non-opioid Pain Patches Market with 7.31% CAGR during the forecast period, due to increasing awareness of healthcare, a growing population of geriatric patients, and a transition toward non-opioid pain relief solutions. There has been a boom in cases of chronic pain in countries like China, India, and Japan due to aging populations and lifestyles, with a prevalence of arthritis, back pain, and neuropathy. The governments in the region are also coming up with stricter policies to stem opioid dependency and promote cost-efficient pain relief methods. Growth in e-commerce and online pharmacy platforms has also made it easier for patients to access pain patches. Additionally, heightened R&D investments, the foray of multinational pharmaceutical companies, and the increased trend towards self-medication are driving market growth, making Asia-Pacific the region with the highest growth rate for non-opioid pain management solutions.
Get Customized Report as per Your Business Requirement - Enquiry Now
Hisamitsu Pharmaceutical Co., Inc. (Salonpas Pain Relief Patch, Salonpas Lidocaine 4% Patch)
Teikoku Seiyaku Co., Ltd. (Lidoderm Patch, Fentanyl Transdermal Patch)
Mylan N.V. (Lidocaine Patch 5%, Diclofenac Epolamine Patch)
Endo Pharmaceuticals Inc. (Lidoderm Patch, Synera Patch)
Teva Pharmaceutical Industries Ltd. (Lidocaine Patch 5%, Fentanyl Transdermal System)
Sorrento Therapeutics, Inc. (ZTlido Patch, SP-102 (SEMDEXA))
Acorda Therapeutics, Inc. (Qutenza Patch, Zanaflex Capsules)
Pfizer Inc. (Flector Patch, Lyrica)
Allergan plc (Duragesic Patch, Fentanyl Transdermal System)
Novartis AG (Voltaren Gel, Exelon Patch)
Johnson & Johnson (Duragesic Patch, Tylenol Precise Pain Relieving Patch)
Sanofi S.A. (Icy Hot Lidocaine Patch, Aspercreme Lidocaine Patch)
GlaxoSmithKline plc (ThermaCare HeatWraps, Voltaren Arthritis Pain Gel)
Bayer AG (Aleve Direct Therapy TENS Device, AleveX Pain Relieving Patch)
Actavis plc (Lidocaine Patch 5%, Fentanyl Transdermal System)
Meda Pharmaceuticals Inc. (Lidoderm Patch, Synera Patch)
Watson Pharmaceuticals, Inc. (Lidocaine Patch 5%, Fentanyl Transdermal System)
Purdue Pharma L.P. (Butrans Patch, Hysingla ER)
Alza Corporation (Duragesic Patch, Nicoderm CQ Patch)
Scilex Pharmaceuticals Inc. (ZTlido Patch, SP-103)
Suppliers (These suppliers provide essential materials and technologies for manufacturing non-opioid pain patches.)
Schott AG
3M Drug Delivery Systems
LTS Lohmann Therapie-Systeme AG
Sekisui Chemical Co., Ltd.
Henkel AG & Co. KGaA
Nitto Denko Corporation
Avery Dennison Medical
AdhexPharma
In January 2025, the U.S. Food and Drug Administration (FDA) approved oral tablets of Journavx (suzetrigine) 50 mg, which represents the launch of the first-in-class non-opioid analgesic for the relief of moderate to severe acute pain in adults. Journavx reduces pain by acting on sodium channels in the peripheral nervous system, blocking pain messages before they reach the brain. This approval is a major step forward in non-opioid pain management, representing a new method for managing acute pain.
| Report Attributes | Details |
|---|---|
| Market Size in 2023 | US$ 991.40 million |
| Market Size by 2032 | US$ 1701.82 million |
| CAGR | CAGR of 6.22% From 2024 to 2032 |
| Base Year | 2023 |
| Forecast Period | 2024-2032 |
| Historical Data | 2020-2022 |
| Report Scope & Coverage | Market Size, Segments Analysis, Competitive Landscape, Regional Analysis, DROC & SWOT Analysis, Forecast Outlook |
| Key Segments | • By Patch Type (Lidocaine Patches, Diclofenac Patches, Methyl Salicylate Patches, Capsaicin Patches, Ketoprofen Patches, Others [Herbal, Menthol, etc.]) • By Distribution Channel (Retail Pharmacies, Hospital Pharmacies, Online Pharmacies, Others [Supermarkets/Hypermarkets, DTC]) |
| Regional Analysis/Coverage | North America (US, Canada, Mexico), Europe (Eastern Europe [Poland, Romania, Hungary, Turkey, Rest of Eastern Europe] Western Europe] Germany, France, UK, Italy, Spain, Netherlands, Switzerland, Austria, Rest of Western Europe]), Asia Pacific (China, India, Japan, South Korea, Vietnam, Singapore, Australia, Rest of Asia Pacific), Middle East & Africa (Middle East [UAE, Egypt, Saudi Arabia, Qatar, Rest of Middle East], Africa [Nigeria, South Africa, Rest of Africa], Latin America (Brazil, Argentina, Colombia, Rest of Latin America) |
| Company Profiles | Hisamitsu Pharmaceutical Co., Inc., Teikoku Seiyaku Co., Ltd., Mylan N.V., Endo Pharmaceuticals Inc., Teva Pharmaceutical Industries Ltd., Sorrento Therapeutics, Inc., Acorda Therapeutics, Inc., Pfizer Inc., Allergan plc, Novartis AG, Johnson & Johnson, Sanofi S.A., GlaxoSmithKline plc, Bayer AG, Actavis plc, Meda Pharmaceuticals Inc., Watson Pharmaceuticals, Inc., Purdue Pharma L.P., Alza Corporation, Scilex Pharmaceuticals Inc., and other players. |
Ans: The Non-opioid Pain Patches Market is expected to grow at a CAGR of 6.22% during 2024-2032.
Ans: The Non-opioid Pain Patches Market was USD 991.40 million in 2023 and is expected to Reach USD 1701.82 million by 2032.
Ans: Rising Prevalence of Chronic Pain Conditions and Growing Demand for Non-Opioid Alternatives propelling market growth.
Ans: The “Lidocaine Patches” segment dominated the Non-opioid Pain Patches Market.
Ans: North America dominated the Non-opioid Pain Patches Market in 2023
Table of Contents:
1. Introduction
1.1 Market Definition
1.2 Scope (Inclusion and Exclusions)
1.3 Research Assumptions
2. Executive Summary
2.1 Market Overview
2.2 Regional Synopsis
2.3 Competitive Summary
3. Research Methodology
3.1 Top-Down Approach
3.2 Bottom-up Approach
3.3. Data Validation
3.4 Primary Interviews
4. Market Dynamics Impact Analysis
4.1 Market Driving Factors Analysis
4.1.2 Drivers
4.1.2 Restraints
4.1.3 Opportunities
4.1.4 Challenges
4.2 PESTLE Analysis
5. Statistical Insights and Trends Reporting
5.1 Incidence and Prevalence of Chronic and Acute Pain Conditions (2023)
5.2 Prescription Trends for Non-opioid Pain Patches (2023), by Region
5.3 Healthcare Spending on Pain Management Therapies, by Region (Government, Commercial, Private, Out-of-Pocket), 2023
6. Competitive Landscape
6.1 List of Major Companies, By Region
6.2 Market Share Analysis, By Region
6.3 Product Benchmarking
6.3.1 Product specifications and features
6.3.2 Pricing
6.4 Strategic Initiatives
6.4.1 Marketing and promotional activities
6.4.2 Distribution and Supply Chain Strategies
6.4.3 Expansion plans and new product launches
6.4.4 Strategic partnerships and collaborations
6.5 Technological Advancements
6.6 Market Positioning and Branding
7. Non-opioid Pain Patches Market Segmentation, by Patch Type
7.1 Chapter Overview
7.2 Lidocaine Patches
7.2.1 Lidocaine Patches Market Trends Analysis (2020-2032)
7.2.2 Lidocaine Patches Market Size Estimates and Forecasts to 2032 (USD Million)
7.3 Diclofenac Patches
7.3.1 Diclofenac Patches Market Trends Analysis (2020-2032)
7.3.2 Diclofenac Patches Market Size Estimates and Forecasts to 2032 (USD Million)
7.4 Methyl Salicylate Patches
7.4.1 Methyl Salicylate Patches Market Trends Analysis (2020-2032)
7.4.2 Methyl Salicylate Patches Market Size Estimates and Forecasts to 2032 (USD Million)
7.5 Capsaicin Patches
7.5.1 Capsaicin Patches Market Trends Analysis (2020-2032)
7.5.2 Capsaicin Patches Market Size Estimates and Forecasts to 2032 (USD Million)
7.6 Ketoprofen Patches
7.6.1 Ketoprofen Patches Market Trends Analysis (2020-2032)
7.6.2 Ketoprofen Patches Market Size Estimates and Forecasts to 2032 (USD Million)
7.7 Others (Herbal, Menthol, etc.)
7.7.1 Others (Herbal, Menthol, etc.) Market Trends Analysis (2020-2032)
7.7.2 Others (Herbal, Menthol, etc.) Market Size Estimates and Forecasts to 2032 (USD Million)
8. Non-opioid Pain Patches Market Segmentation, by Distribution Channel
8.1 Chapter Overview
8.2 Retail Pharmacies
8.2.1 Retail Pharmacies Market Trends Analysis (2020-2032)
8.2.2 Retail Pharmacies Market Size Estimates and Forecasts to 2032 (USD Million)
8.3 Hospital Pharmacies
8.3.1 Hospital Pharmacies Market Trends Analysis (2020-2032)
8.3.2 Hospital Pharmacies Market Size Estimates and Forecasts to 2032 (USD Million)
8.4 Online Pharmacies
8.4.1 Online Pharmacies Market Trends Analysis (2020-2032)
8.4.2 Online Pharmacies Market Size Estimates and Forecasts to 2032 (USD Million)
8.5 Others (Supermarkets/Hypermarkets, DTC)
8.5.1 Others (Supermarkets/Hypermarkets, DTC) Market Trends Analysis (2020-2032)
8.5.2 Others (Supermarkets/Hypermarkets, DTC) Market Size Estimates and Forecasts to 2032 (USD Million)
9. Regional Analysis
9.1 Chapter Overview
9.2 North America
9.2.1 Trends Analysis
9.2.2 North America Non-opioid Pain Patches Market Estimates and Forecasts, by Country (2020-2032) (USD Million)
9.2.3 North America Non-opioid Pain Patches Market Estimates and Forecasts, by Patch Type (2020-2032) (USD Million)
9.2.4 North America Non-opioid Pain Patches Market Estimates and Forecasts, by Distribution Channel (2020-2032) (USD Million)
9.2.5 USA
9.2.5.1 USA Non-opioid Pain Patches Market Estimates and Forecasts, by Patch Type (2020-2032) (USD Million)
9.2.5.2 USA Non-opioid Pain Patches Market Estimates and Forecasts, by Distribution Channel (2020-2032) (USD Million)
9.2.6 Canada
9.2.6.1 Canada Non-opioid Pain Patches Market Estimates and Forecasts, by Patch Type (2020-2032) (USD Million)
9.2.6.2 Canada Non-opioid Pain Patches Market Estimates and Forecasts, by Distribution Channel (2020-2032) (USD Million)
9.2.7 Mexico
9.2.7.1 Mexico Non-opioid Pain Patches Market Estimates and Forecasts, by Patch Type (2020-2032) (USD Million)
9.2.7.2 Mexico Non-opioid Pain Patches Market Estimates and Forecasts, by Distribution Channel (2020-2032) (USD Million)
9.3 Europe
9.3.1 Eastern Europe
9.3.1.1 Trends Analysis
9.3.1.2 Eastern Europe Non-opioid Pain Patches Market Estimates and Forecasts, by Country (2020-2032) (USD Million)
9.3.1.3 Eastern Europe Non-opioid Pain Patches Market Estimates and Forecasts, by Patch Type (2020-2032) (USD Million)
9.3.1.4 Eastern Europe Non-opioid Pain Patches Market Estimates and Forecasts, by Distribution Channel (2020-2032) (USD Million)
9.3.1.5 Poland
9.3.1.5.1 Poland Non-opioid Pain Patches Market Estimates and Forecasts, by Patch Type (2020-2032) (USD Million)
9.3.1.5.2 Poland Non-opioid Pain Patches Market Estimates and Forecasts, by Distribution Channel (2020-2032) (USD Million)
9.3.1.6 Romania
9.3.1.6.1 Romania Non-opioid Pain Patches Market Estimates and Forecasts, by Patch Type (2020-2032) (USD Million)
9.3.1.6.2 Romania Non-opioid Pain Patches Market Estimates and Forecasts, by Distribution Channel (2020-2032) (USD Million)
9.3.1.7 Hungary
9.3.1.7.1 Hungary Non-opioid Pain Patches Market Estimates and Forecasts, by Patch Type (2020-2032) (USD Million)
9.3.1.7.2 Hungary Non-opioid Pain Patches Market Estimates and Forecasts, by Distribution Channel (2020-2032) (USD Million)
9.3.1.8 Turkey
9.3.1.8.1 Turkey Non-opioid Pain Patches Market Estimates and Forecasts, by Patch Type (2020-2032) (USD Million)
9.3.1.8.2 Turkey Non-opioid Pain Patches Market Estimates and Forecasts, by Distribution Channel (2020-2032) (USD Million)
9.3.1.9 Rest of Eastern Europe
9.3.1.9.1 Rest of Eastern Europe Non-opioid Pain Patches Market Estimates and Forecasts, by Patch Type (2020-2032) (USD Million)
9.3.1.9.2 Rest of Eastern Europe Non-opioid Pain Patches Market Estimates and Forecasts, by Distribution Channel (2020-2032) (USD Million)
9.3.2 Western Europe
9.3.2.1 Trends Analysis
9.3.2.2 Western Europe Non-opioid Pain Patches Market Estimates and Forecasts, by Country (2020-2032) (USD Million)
9.3.2.3 Western Europe Non-opioid Pain Patches Market Estimates and Forecasts, by Patch Type (2020-2032) (USD Million)
9.3.2.4 Western Europe Non-opioid Pain Patches Market Estimates and Forecasts, by Distribution Channel (2020-2032) (USD Million)
9.3.2.5 Germany
9.3.2.5.1 Germany Non-opioid Pain Patches Market Estimates and Forecasts, by Patch Type (2020-2032) (USD Million)
9.3.2.5.2 Germany Non-opioid Pain Patches Market Estimates and Forecasts, by Distribution Channel (2020-2032) (USD Million)
9.3.2.6 France
9.3.2.6.1 France Non-opioid Pain Patches Market Estimates and Forecasts, by Patch Type (2020-2032) (USD Million)
9.3.2.6.2 France Non-opioid Pain Patches Market Estimates and Forecasts, by Distribution Channel (2020-2032) (USD Million)
9.3.2.7 UK
9.3.2.7.1 UK Non-opioid Pain Patches Market Estimates and Forecasts, by Patch Type (2020-2032) (USD Million)
9.3.2.7.2 UK Non-opioid Pain Patches Market Estimates and Forecasts, by Distribution Channel (2020-2032) (USD Million)
9.3.2.8 Italy
9.3.2.8.1 Italy Non-opioid Pain Patches Market Estimates and Forecasts, by Patch Type (2020-2032) (USD Million)
9.3.2.8.2 Italy Non-opioid Pain Patches Market Estimates and Forecasts, by Distribution Channel (2020-2032) (USD Million)
9.3.2.9 Spain
9.3.2.9.1 Spain Non-opioid Pain Patches Market Estimates and Forecasts, by Patch Type (2020-2032) (USD Million)
9.3.2.9.2 Spain Non-opioid Pain Patches Market Estimates and Forecasts, by Distribution Channel (2020-2032) (USD Million)
9.3.2.10 Netherlands
9.3.2.10.1 Netherlands Non-opioid Pain Patches Market Estimates and Forecasts, by Patch Type (2020-2032) (USD Million)
9.3.2.10.2 Netherlands Non-opioid Pain Patches Market Estimates and Forecasts, by Distribution Channel (2020-2032) (USD Million)
9.3.2.11 Switzerland
9.3.2.11.1 Switzerland Non-opioid Pain Patches Market Estimates and Forecasts, by Patch Type (2020-2032) (USD Million)
9.3.2.11.2 Switzerland Non-opioid Pain Patches Market Estimates and Forecasts, by Distribution Channel (2020-2032) (USD Million)
9.3.2.12 Austria
9.3.2.12.1 Austria Healthcare Predictive Analytic Market Estimates and Forecasts, by Patch Type (2020-2032) (USD Million)
9.3.2.12.2 Austria Non-opioid Pain Patches Market Estimates and Forecasts, by Distribution Channel (2020-2032) (USD Million)
9.3.2.13 Rest of Western Europe
9.3.2.13.1 Rest of Western Europe Non-opioid Pain Patches Market Estimates and Forecasts, by Patch Type (2020-2032) (USD Million)
9.3.2.13.2 Rest of Western Europe Non-opioid Pain Patches Market Estimates and Forecasts, by Distribution Channel (2020-2032) (USD Million)
9.4 Asia Pacific
9.4.1 Trends Analysis
9.4.2 Asia Pacific Non-opioid Pain Patches Market Estimates and Forecasts, by Country (2020-2032) (USD Million)
9.4.3 Asia Pacific Non-opioid Pain Patches Market Estimates and Forecasts, by Patch Type (2020-2032) (USD Million)
9.4.4 Asia Pacific Non-opioid Pain Patches Market Estimates and Forecasts, by Distribution Channel (2020-2032) (USD Million)
9.4.5 China
9.4.5.1 China Non-opioid Pain Patches Market Estimates and Forecasts, by Patch Type (2020-2032) (USD Million)
9.4.5.2 China Non-opioid Pain Patches Market Estimates and Forecasts, by Distribution Channel (2020-2032) (USD Million)
9.4.6 India
9.4.5.1 India Non-opioid Pain Patches Market Estimates and Forecasts, by Patch Type (2020-2032) (USD Million)
9.4.5.2 India Non-opioid Pain Patches Market Estimates and Forecasts, by Distribution Channel (2020-2032) (USD Million)
9.4.5 Japan
9.4.5.1 Japan Non-opioid Pain Patches Market Estimates and Forecasts, by Patch Type (2020-2032) (USD Million)
9.4.5.2 Japan Non-opioid Pain Patches Market Estimates and Forecasts, by Distribution Channel (2020-2032) (USD Million)
9.4.6 South Korea
9.4.6.1 South Korea Non-opioid Pain Patches Market Estimates and Forecasts, by Patch Type (2020-2032) (USD Million)
9.4.6.2 South Korea Non-opioid Pain Patches Market Estimates and Forecasts, by Distribution Channel (2020-2032) (USD Million)
9.4.7 Vietnam
9.4.7.1 Vietnam Non-opioid Pain Patches Market Estimates and Forecasts, by Patch Type (2020-2032) (USD Million)
9.2.7.2 Vietnam Healthcare Predictive Analytic Market Estimates and Forecasts, by Distribution Channel (2020-2032) (USD Million)
9.4.8 Singapore
9.4.8.1 Singapore Non-opioid Pain Patches Market Estimates and Forecasts, by Patch Type (2020-2032) (USD Million)
9.4.8.2 Singapore Non-opioid Pain Patches Market Estimates and Forecasts, by Distribution Channel (2020-2032) (USD Million)
9.4.9 Australia
9.4.9.1 Australia Non-opioid Pain Patches Market Estimates and Forecasts, by Patch Type (2020-2032) (USD Million)
9.4.9.2 Australia Non-opioid Pain Patches Market Estimates and Forecasts, by Distribution Channel (2020-2032) (USD Million)
9.4.10 Rest of Asia Pacific
9.4.10.1 Rest of Asia Pacific Non-opioid Pain Patches Market Estimates and Forecasts, by Patch Type (2020-2032) (USD Million)
9.4.10.2 Rest of Asia Pacific Non-opioid Pain Patches Market Estimates and Forecasts, by Distribution Channel (2020-2032) (USD Million)
9.5 Middle East and Africa
9.5.1 Middle East
9.5.1.1 Trends Analysis
9.5.1.2 Middle East Non-opioid Pain Patches Market Estimates and Forecasts, by Country (2020-2032) (USD Million)
9.5.1.3 Middle East Non-opioid Pain Patches Market Estimates and Forecasts, by Patch Type (2020-2032) (USD Million)
9.5.1.4 Middle East Non-opioid Pain Patches Market Estimates and Forecasts, by Distribution Channel (2020-2032) (USD Million)
9.5.1.5 UAE
9.5.1.5.1 UAE Non-opioid Pain Patches Market Estimates and Forecasts, by Patch Type (2020-2032) (USD Million)
9.5.1.5.2 UAE Non-opioid Pain Patches Market Estimates and Forecasts, by Distribution Channel (2020-2032) (USD Million)
9.5.1.6 Egypt
9.5.1.6.1 Egypt Non-opioid Pain Patches Market Estimates and Forecasts, by Patch Type (2020-2032) (USD Million)
9.5.1.6.2 Egypt Non-opioid Pain Patches Market Estimates and Forecasts, by Distribution Channel (2020-2032) (USD Million)
9.5.1.7 Saudi Arabia
9.5.1.7.1 Saudi Arabia Non-opioid Pain Patches Market Estimates and Forecasts, by Patch Type (2020-2032) (USD Million)
9.5.1.7.2 Saudi Arabia Non-opioid Pain Patches Market Estimates and Forecasts, by Distribution Channel (2020-2032) (USD Million)
9.5.1.8 Qatar
9.5.1.8.1 Qatar Non-opioid Pain Patches Market Estimates and Forecasts, by Patch Type (2020-2032) (USD Million)
9.5.1.8.2 Qatar Non-opioid Pain Patches Market Estimates and Forecasts, by Distribution Channel (2020-2032) (USD Million)
9.5.1.9 Rest of Middle East
9.5.1.9.1 Rest of Middle East Non-opioid Pain Patches Market Estimates and Forecasts, by Patch Type (2020-2032) (USD Million)
9.5.1.9.2 Rest of Middle East Non-opioid Pain Patches Market Estimates and Forecasts, by Distribution Channel (2020-2032) (USD Million)
9.5.2 Africa
9.5.2.1 Trends Analysis
9.5.2.2 Africa Non-opioid Pain Patches Market Estimates and Forecasts, by Country (2020-2032) (USD Million)
9.5.2.3 Africa Non-opioid Pain Patches Market Estimates and Forecasts, by Patch Type (2020-2032) (USD Million)
9.5.2.4 Africa Non-opioid Pain Patches Market Estimates and Forecasts, by Distribution Channel (2020-2032) (USD Million)
9.5.2.5 South Africa
9.5.2.5.1 South Africa Non-opioid Pain Patches Market Estimates and Forecasts, by Patch Type (2020-2032) (USD Million)
9.5.2.5.2 South Africa Non-opioid Pain Patches Market Estimates and Forecasts, by Distribution Channel (2020-2032) (USD Million)
9.5.2.6 Nigeria
9.5.2.6.1 Nigeria Non-opioid Pain Patches Market Estimates and Forecasts, by Patch Type (2020-2032) (USD Million)
9.5.2.6.2 Nigeria Non-opioid Pain Patches Market Estimates and Forecasts, by Distribution Channel (2020-2032) (USD Million)
9.5.2.7 Rest of Africa
9.5.2.7.1 Rest of Africa Non-opioid Pain Patches Market Estimates and Forecasts, by Patch Type (2020-2032) (USD Million)
9.5.2.7.2 Rest of Africa Non-opioid Pain Patches Market Estimates and Forecasts, by Distribution Channel (2020-2032) (USD Million)
9.6 Latin America
9.6.1 Trends Analysis
9.6.2 Latin America Non-opioid Pain Patches Market Estimates and Forecasts, by Country (2020-2032) (USD Million)
9.6.3 Latin America Non-opioid Pain Patches Market Estimates and Forecasts, by Patch Type (2020-2032) (USD Million)
9.6.4 Latin America Non-opioid Pain Patches Market Estimates and Forecasts, by Distribution Channel (2020-2032) (USD Million)
9.6.5 Brazil
9.6.5.1 Brazil Non-opioid Pain Patches Market Estimates and Forecasts, by Patch Type (2020-2032) (USD Million)
9.6.5.2 Brazil Non-opioid Pain Patches Market Estimates and Forecasts, by Distribution Channel (2020-2032) (USD Million)
9.6.6 Argentina
9.6.6.1 Argentina Non-opioid Pain Patches Market Estimates and Forecasts, by Patch Type (2020-2032) (USD Million)
9.6.6.2 Argentina Non-opioid Pain Patches Market Estimates and Forecasts, by Distribution Channel (2020-2032) (USD Million)
9.6.7 Colombia
9.6.7.1 Colombia Non-opioid Pain Patches Market Estimates and Forecasts, by Patch Type (2020-2032) (USD Million)
9.6.7.2 Colombia Non-opioid Pain Patches Market Estimates and Forecasts, by Distribution Channel (2020-2032) (USD Million)
9.6.8 Rest of Latin America
9.6.8.1 Rest of Latin America Non-opioid Pain Patches Market Estimates and Forecasts, by Patch Type (2020-2032) (USD Million)
9.6.8.2 Rest of Latin America Non-opioid Pain Patches Market Estimates and Forecasts, by Distribution Channel (2020-2032) (USD Million)
10. Company Profiles
10.1 Novartis AG
10.1.1 Company Overview
10.1.2 Financial
10.1.3 Products/ Services Offered
110.1.4 SWOT Analysis
10.2 Allergan plc
10.2.1 Company Overview
10.2.2 Financial
10.2.3 Products/ Services Offered
10.2.4 SWOT Analysis
10.3 Pfizer Inc.
10.3.1 Company Overview
10.3.2 Financial
10.3.3 Products/ Services Offered
10.3.4 SWOT Analysis
10.4 Acorda Therapeutics, Inc.
10.4.1 Company Overview
10.4.2 Financial
10.4.3 Products/ Services Offered
10.4.4 SWOT Analysis
10.5 Sorrento Therapeutics, Inc.
10.5.1 Company Overview
10.5.2 Financial
10.5.3 Products/ Services Offered
10.5.4 SWOT Analysis
10.6 Teva Pharmaceutical Industries Ltd.
10.6.1 Company Overview
10.6.2 Financial
10.6.3 Products/ Services Offered
10.6.4 SWOT Analysis
10.7 Endo Pharmaceuticals Inc.
10.7.1 Company Overview
10.7.2 Financial
10.7.3 Products/ Services Offered
10.7.4 SWOT Analysis
10.8 Mylan N.V.
10.8.1 Company Overview
10.8.2 Financial
10.8.3 Products/ Services Offered
10.8.4 SWOT Analysis
10.9 Teikoku Seiyaku Co., Ltd.
10.9.1 Company Overview
10.9.2 Financial
10.9.3 Products/ Services Offered
10.9.4 SWOT Analysis
10.10 Hisamitsu Pharmaceutical Co., Inc.
10.9.1 Company Overview
10.9.2 Financial
10.9.3 Products/ Services Offered
10.9.4 SWOT Analysis
11. Use Cases and Best Practices
12. Conclusion
An accurate research report requires proper strategizing as well as implementation. There are multiple factors involved in the completion of good and accurate research report and selecting the best methodology to compete the research is the toughest part. Since the research reports we provide play a crucial role in any company’s decision-making process, therefore we at SNS Insider always believe that we should choose the best method which gives us results closer to reality. This allows us to reach at a stage wherein we can provide our clients best and accurate investment to output ratio.
Each report that we prepare takes a timeframe of 350-400 business hours for production. Starting from the selection of titles through a couple of in-depth brain storming session to the final QC process before uploading our titles on our website we dedicate around 350 working hours. The titles are selected based on their current market cap and the foreseen CAGR and growth.
The 5 steps process:
Step 1: Secondary Research:
Secondary Research or Desk Research is as the name suggests is a research process wherein, we collect data through the readily available information. In this process we use various paid and unpaid databases which our team has access to and gather data through the same. This includes examining of listed companies’ annual reports, Journals, SEC filling etc. Apart from this our team has access to various associations across the globe across different industries. Lastly, we have exchange relationships with various university as well as individual libraries.

Step 2: Primary Research
When we talk about primary research, it is a type of study in which the researchers collect relevant data samples directly, rather than relying on previously collected data. This type of research is focused on gaining content specific facts that can be sued to solve specific problems. Since the collected data is fresh and first hand therefore it makes the study more accurate and genuine.
We at SNS Insider have divided Primary Research into 2 parts.
Part 1 wherein we interview the KOLs of major players as well as the upcoming ones across various geographic regions. This allows us to have their view over the market scenario and acts as an important tool to come closer to the accurate market numbers. As many as 45 paid and unpaid primary interviews are taken from both the demand and supply side of the industry to make sure we land at an accurate judgement and analysis of the market.
This step involves the triangulation of data wherein our team analyses the interview transcripts, online survey responses and observation of on filed participants. The below mentioned chart should give a better understanding of the part 1 of the primary interview.

Part 2: In this part of primary research the data collected via secondary research and the part 1 of the primary research is validated with the interviews from individual consultants and subject matter experts.
Consultants are those set of people who have at least 12 years of experience and expertise within the industry whereas Subject Matter Experts are those with at least 15 years of experience behind their back within the same space. The data with the help of two main processes i.e., FGDs (Focused Group Discussions) and IDs (Individual Discussions). This gives us a 3rd party nonbiased primary view of the market scenario making it a more dependable one while collation of the data pointers.
Step 3: Data Bank Validation
Once all the information is collected via primary and secondary sources, we run that information for data validation. At our intelligence centre our research heads track a lot of information related to the market which includes the quarterly reports, the daily stock prices, and other relevant information. Our data bank server gets updated every fortnight and that is how the information which we collected using our primary and secondary information is revalidated in real time.

Step 4: QA/QC Process
After all the data collection and validation our team does a final level of quality check and quality assurance to get rid of any unwanted or undesired mistakes. This might include but not limited to getting rid of the any typos, duplication of numbers or missing of any important information. The people involved in this process include technical content writers, research heads and graphics people. Once this process is completed the title gets uploader on our platform for our clients to read it.
Step 5: Final QC/QA Process:
This is the last process and comes when the client has ordered the study. In this process a final QA/QC is done before the study is emailed to the client. Since we believe in giving our clients a good experience of our research studies, therefore, to make sure that we do not lack at our end in any way humanly possible we do a final round of quality check and then dispatch the study to the client.
By Patch Type
Lidocaine Patches
Diclofenac Patches
Methyl Salicylate Patches
Capsaicin Patches
Ketoprofen Patches
Others (Herbal, Menthol, etc.)
By Distribution Channel
Retail Pharmacies
Hospital Pharmacies
Online Pharmacies
Others (Supermarkets/Hypermarkets, DTC)
Request for Segment Customization as per your Business Requirement: Segment Customization Request
Regional Coverage:
North America
US
Canada
Mexico
Europe
Eastern Europe
Poland
Romania
Hungary
Turkey
Rest of Eastern Europe
Western Europe
Germany
France
UK
Italy
Spain
Netherlands
Switzerland
Austria
Rest of Western Europe
Asia Pacific
China
India
Japan
South Korea
Vietnam
Singapore
Australia
Rest of Asia Pacific
Middle East & Africa
Middle East
UAE
Egypt
Saudi Arabia
Qatar
Rest of the Middle East
Africa
Nigeria
South Africa
Rest of Africa
Latin America
Brazil
Argentina
Colombia
Rest of Latin America
Request for Country Level Research Report: Country Level Customization Request
Available Customization
With the given market data, SNS Insider offers customization as per the company’s specific needs. The following customization options are available for the report:
Detailed Volume Analysis
Criss-Cross segment analysis (e.g. Product X Application)
Competitive Product Benchmarking
Geographic Analysis
Additional countries in any of the regions
Customized Data Representation
Detailed analysis and profiling of additional market players
The Healthcare IT Outsourcing Market Size was valued at USD 64.52 billion in 2023 and is expected to reach USD 122.72 billion by 2032 and grow at a CAGR of 7.44% over the forecast period 2024-2032.
The Bio Decontamination Market was valued at USD 236.09 million in 2023 and is expected to reach USD 501.37 million by 2032, growing at a CAGR of 8.76% from 2024-2032.
The Speech Therapy Market Size was valued at USD 11.13 billion in 2023 and is expected to reach at USD 18.19 billion in 2032 and grow at a CAGR of 5.64% by 2024-2032.
The global dental regeneration market, valued at USD 5.03 Billion in 2023, is projected to reach USD 8.49 Billion by 2032, growing at a compound annual growth rate (CAGR) of 6.28% during the forecast period.
The Medical Tape and Bandage Market Size was valued at USD 7.80 Billion in 2023, and is expected to reach USD 11.10 Billion by 2032, and grow at a CAGR of 4.12%.
The Personalized Nutrition Market Size was valued at USD 12.06 Billion in 2023, and is expected to reach USD 41.10 Billion by 2032, and grow at a CAGR of 15.04% over the forecast period 2024-2032.

Hi! Click one of our member below to chat on Phone
© 2025 All Rights Reserved by SNS Insider Pvt Ltd


