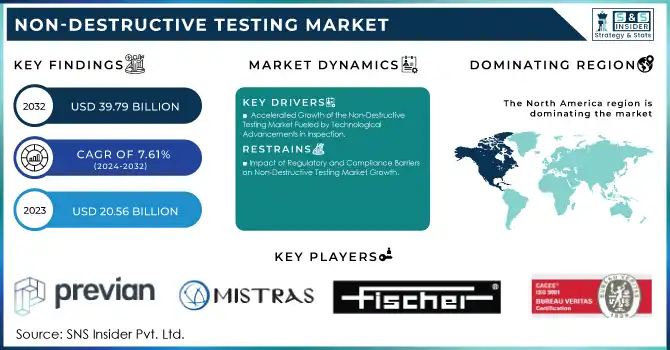
The Non-Destructive Testing Market size is value USD 20.56 Billion in 2023 and is expected to reach USD 39.79 Billion by 2032 with a growing CAGR of 7.61 % over the forecast period 2024-2032.
To get more information on Non-Destructive Testing Market - Request Free Sample Report
The non-destructive testing market is experiencing a profound transformation, driven by Industry 4.0 advancements and technological innovations. The integration of artificial intelligence, machine learning, and industrial IoT has revolutionized inspection processes, significantly improving accuracy and efficiency in quality control. This digital shift is especially noticeable in the United States, where industrial robot installations saw a 12% increase in 2023, totaling 44,303 units. Automation investments are boosting NDT adoption, enabling faster, more precise inspections through advanced techniques like embedded systems, cloud computing, and analytics, which optimize error detection and process management. However, global geopolitical challenges, such as tensions between the U.S. and China, the Russia-Ukraine conflict, and the ongoing war in Israel, have disrupted global supply chains, particularly impacting raw material availability and inflating costs, which has consequently affected demand in several industries. The semiconductor sector, in particular, has been affected by strict export controls, which in turn slow production across multiple sectors, including automotive, oil and gas, and power.
On the other hand, the renewable energy sector is emerging as a key driver for NDT services, with substantial growth in wind and solar energy projects. As of June 2024, China led global offshore wind farm deployment with 129 operational sites, followed by the UK with 39. In 2023, Asia-Pacific's solar capacity reached 840.6 gigawatts, indicating a growing demand for NDT services in renewable energy infrastructure. The automotive industry's shift to electric and autonomous vehicles is further propelling NDT requirements, with global sales of plug-in electric vehicles hitting 13.7 million units in 2023. The aerospace sector is also expanding, with Boeing delivering 528 commercial aircraft, a 10% increase from 2022. This growth in automotive and aerospace sectors reinforces the critical role NDT plays in ensuring product safety, quality, and compliance, making it a crucial component of modern industries.
Market Dynamics
Drivers
Accelerated Growth of the Non-Destructive Testing Market Fueled by Technological Advancements in Inspection
Innovations in ultrasonic, radiographic, and eddy current testing methods are enhancing the accuracy, speed, and cost-effectiveness of NDT procedures. The integration of advanced technologies such as artificial intelligence (AI), machine learning, and industrial IoT is further revolutionizing inspection processes, enabling real-time data analysis, predictive maintenance, and more efficient quality control. These advancements are especially significant in sectors like aerospace, automotive, oil and gas, and infrastructure, where product quality and safety are paramount. For instance, new automated NDT systems, utilizing AI and cloud computing, are enhancing the precision of defect detection while reducing human error. Additionally, the advent of 3D and computed tomography (CT) scanning technologies allows for in-depth analysis of complex structures, providing more comprehensive insights into material integrity. Such innovations are not only improving inspection accuracy but also increasing the overall speed of testing, making it more cost-efficient for industries. Moreover, drones and robotic inspection technologies are expanding the scope of NDT, allowing for safer and more efficient inspections of hard-to-reach areas, such as high-rise buildings, offshore structures, and pipelines. These advancements are driving demand for NDT services, as industries seek to leverage cutting-edge technologies to enhance operational efficiency and ensure product safety. The NDT market is thus poised for significant expansion, supported by these technological breakthroughs that are shaping the future of quality control and safety inspections worldwide.
Restraints
Impact of Regulatory and Compliance Barriers on Non-Destructive Testing Market Growth
NDT processes are subject to stringent regulations and standards that vary across industries and regions, including safety standards, environmental regulations, and quality assurance requirements. The need to meet these evolving regulations can be costly for companies, especially as they must invest in training, certification, and the acquisition of the latest inspection technologies. Additionally, ensuring compliance with these regulations often requires frequent audits, documentation, and upgrades to existing systems, adding to operational complexity. For instance, the aviation, energy, and manufacturing sectors face particularly stringent regulations regarding safety and performance, making NDT a crucial but burdensome process. As companies strive to keep pace with changing laws and standards, they may experience delays, which can slow down project timelines and increase operational costs. The need to constantly adapt to new compliance requirements can also deter smaller organizations from investing in advanced NDT technologies, further limiting market expansion. This regulatory landscape is especially challenging for industries like aerospace, energy, and oil & gas, where the risks associated with non-compliance are high and penalties can be severe.
Segment Analysis
By Type
The services segment of the Non-Destructive Testing market dominates, accounting for around 70% of the total market share in 2023, driven by increasing demand for on-site inspections across industries like aerospace, automotive, and energy. In North America, robust infrastructure and stringent safety regulations fuel demand for specialized NDT service providers. Europe also contributes significantly, driven by automotive and manufacturing sectors focusing on safety and compliance. In Asia-Pacific, rapid industrialization, particularly in China and India, leads to greater adoption of NDT services in manufacturing, construction, and energy sectors. As industrial growth accelerates, the services segment is expected to continue its dominance, supported by the need for regular inspections, regulatory compliance, and asset management across various industries.
By Testing Technology
The Ultrasonic Testing (UT) segment holds a dominant share of approximately 35% in the Non-Destructive Testing market in 2023, driven by its broad applicability in industries like aerospace, automotive, oil and gas, and manufacturing. UT is widely recognized for its ability to detect internal flaws and measure material thickness, making it crucial for ensuring the integrity of structures and components. Its versatility and cost-effectiveness further fuel its growth, as it can inspect both surface and subsurface defects with high precision. Additionally, advancements in phased array ultrasonic testing (PAUT) and automated systems are improving inspection speed and accuracy. The increasing demand for stringent safety standards and high-quality materials across sectors is also contributing to the segment's dominance. These factors collectively solidify ultrasonic testing as a key player in the NDT market.
Regional Analysis
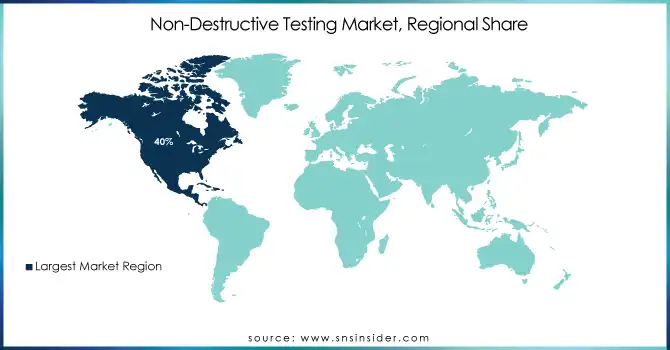
North America dominates the Non-Destructive Testing market, accounting for approximately 40% of the global market share in 2023. This dominance is driven by significant technological advancements, high demand for quality control across various industries, and a strong focus on safety and regulatory compliance. The United States, in particular, plays a pivotal role, with its well-established aerospace, automotive, oil and gas, and manufacturing sectors, all of which heavily rely on NDT techniques for ensuring product integrity and safety. The U.S. is also home to some of the leading NDT equipment and service providers, contributing to the region's market growth. Furthermore, the country’s investments in advanced technologies, such as digital radiography, ultrasonic testing, and automated systems, are boosting the efficiency and accuracy of NDT processes. Canada also contributes significantly to the market, especially in the energy sector, driven by its oil sands and mining industries. The region’s robust regulatory environment, coupled with increasing industrial automation, is expected to sustain North America's leading position in the NDT market.
Asia-Pacific is the fastest-growing region in the Non-Destructive Testing market, with robust growth expected over the forecast period from 2024 to 2032. The rapid industrialization and significant investments in infrastructure development, particularly in countries like China, India, Japan, and South Korea, are driving this expansion. China, as the largest market in the region, is at the forefront of NDT adoption, supported by its booming manufacturing, construction, and aerospace industries. The country's commitment to developing cutting-edge technologies, including ultrasonic and digital radiography testing, is contributing to market growth. India is also witnessing rapid growth due to its expanding automotive, oil and gas, and power sectors, with increased demand for quality control and safety compliance. In Japan, a focus on the automotive and electronics sectors, alongside advancements in precision testing, is fueling the demand for NDT services. South Korea, known for its technological advancements in industrial automation, is another key player in driving market growth. Moreover, the region's significant investments in renewable energy projects, particularly solar and wind power, are further propelling the need for advanced NDT solutions. The increasing adoption of Industry 4.0 technologies, coupled with government initiatives promoting safety standards and infrastructure development, ensures that Asia-Pacific remains the fastest-growing region in the NDT market.
Need any customization research on Non-Destructive Testing Market - Enquiry Now
KEY PLAYERS
Some of the major players in Non-Destructive Testing Market with their product:
Previan Technologies, Inc. (X-ray systems, ultrasound equipment)
Bureau Veritas (Inspection services, certification, and testing services)
Fischer Technology Inc. (Helmut Fischer) (Coating thickness gauges, material testing equipment)
MISTRAS Group (Ultrasonic testing systems, corrosion monitoring solutions)
Comet Group (YXLON International) (X-ray and CT inspection systems)
MME Group (Ultrasonic inspection equipment, automated testing systems)
TWI Ltd. (Welding inspection services, advanced NDT technologies)
Nikon Corporation (Industrial microscopes, 3D measurement systems)
Olympus Corporation (Ultrasonic testing systems, phased array ultrasonic devices)
Sonatest (Ultrasonic testing equipment, phased array systems)
Acuren (Inspection services, corrosion monitoring, NDT equipment rental)
Intertek Group plc (Inspection and testing services, analytical services)
CREAFORM (3D scanning equipment, portable measurement systems)
Vidisco Ltd. (X-ray inspection systems, portable NDT systems)
SGS S.A. (Testing and inspection services, material testing equipment)
General Electric (X-ray and ultrasound inspection systems, industrial inspection services)
Testia (Non-destructive testing systems, aerospace inspection technologies)
Baker Hughes (Ultrasonic inspection tools, automated NDT systems)
Zetec Inc. (Eddy current and ultrasonic testing equipment, software solutions)
Applied Technical Services (ATS) (Eddy current testing equipment, corrosion monitoring solutions)
List of Suppliers who provide Raw Material and Component for the Non-Destructive Testing Market:
3M
General Electric (GE)
Honeywell International
Schlumberger
BASF
Linde Group
Thermo Fisher Scientific
Mouser Electronics
TE Connectivity
Siemens
Recent Development
August 2024 – RFA adds MISTRAS Group as associate member to support biorefinery operational excellence MISTRAS Group has joined the Renewable Fuels Association to enhance the efficiency, safety, and sustainability of the renewable fuels industry. Their expertise in non-destructive testing (NDT), inline inspections, and data analytics will help improve asset integrity and operational performance for biorefineries.
October 2024 – Creaform released VXintegrity 3.0: A Modern Approach to Infrastructures Fitness-For-Service (FFS) Analyses 3.0, integrating Finite Element Analysis (FEA) and API 579 standards, transforming data into actionable insights for assessing infrastructure integrity. The new version simplifies Level I and II evaluations and significantly speeds up Level III assessments, reducing downtime and costs for asset owners in the oil and gas industry
Report Attributes | Details |
Market Size in 2023 | USD 20.56 Billion |
Market Size by 2032 | USD 39.79 Billion |
CAGR | CAGR of 7.61% From 2024 to 2032 |
Base Year | 2023 |
Forecast Period | 2024-2032 |
Historical Data | 2020-2022 |
Report Scope & Coverage | Market Size, Segments Analysis, Competitive Landscape, Regional Analysis, DROC & SWOT Analysis, Forecast Outlook |
Key Segments | • By Type (Equipment, Services) • By Testing Technology( Radiography Testing, Ultrasonic Testing, Magnetic Particle Testing, Liquid Penetrant Testing, Visual Inspection Testing, Eddy Current Testing, Other Testing Technologies) • By End-User (Oil and Gas, Power and Energy, Construction, Automotive and Transportation, Aerospace, Defense, Other End User Industries) |
Regional Analysis/Coverage | North America (US, Canada, Mexico), Europe (Eastern Europe [Poland, Romania, Hungary, Turkey, Rest of Eastern Europe] Western Europe] Germany, France, UK, Italy, Spain, Netherlands, Switzerland, Austria, Rest of Western Europe]), Asia Pacific (China, India, Japan, South Korea, Vietnam, Singapore, Australia, Rest of Asia Pacific), Middle East & Africa (Middle East [UAE, Egypt, Saudi Arabia, Qatar, Rest of Middle East], Africa [Nigeria, South Africa, Rest of Africa], Latin America (Brazil, Argentina, Colombia, Rest of Latin America) |
Company Profiles | Previan Technologies, Inc., Bureau Veritas, Fischer Technology Inc. (Helmut Fischer), MISTRAS Group, Comet Group (YXLON International), MME Group, TWI Ltd., Nikon Corporation, Olympus Corporation, Sonatest, Acuren, Intertek Group plc, CREAFORM, Vidisco Ltd., SGS S.A., General Electric, Testia, Baker Hughes, Zetec Inc., and Applied Technical Services (ATS) are prominent companies in the Non-Destructive Testing market offering a wide range of inspection services, testing solutions, and advanced technologies. |
Key Drivers | • Accelerated Growth of the Non-Destructive Testing Market Fueled by Technological Advancements in Inspection |
Restraints | • Impact of Regulatory and Compliance Barriers on Non-Destructive Testing Market Growth |
Ans: The Non-Destructive Testing Market is expected to grow at a CAGR of 7.61%.
Ans: An increasing number of organizations depend on environmentally friendly power sources to create electrical energy to control their activities.
Ans: Non-Destructive Testing Market size was USD 20.56 billion in 2023 and is expected to Reach USD 39.79 billion by 2032
Ans: Ultrasonic Testing is the dominating segment by Testing Technology in the Non-Destructive Testing Market.
Ans: North America is the dominating region in the Non-Destructive Testing Market.
Table of Content
1. Introduction
1.1 Market Definition
1.2 Scope (Inclusion and Exclusions)
1.3 Research Assumptions
2. Executive Summary
2.1 Market Overview
2.2 Regional Synopsis
2.3 Competitive Summary
3. Research Methodology
3.1 Top-Down Approach
3.2 Bottom-up Approach
3.3. Data Validation
3.4 Primary Interviews
4. Market Dynamics Impact Analysis
4.1 Market Driving Factors Analysis
4.1.1 Drivers
4.1.2 Restraints
4.2 PESTLE Analysis
4.3 Porter’s Five Forces Model
5. Statistical Insights and Trends Reporting
5.1 Technology Adoption Rate, by Region
5.2 NDT Equipment Deployment, by Region
5.3 Customer Demographics.
5.4 Supply Chain and Logistics in NDT
6. Competitive Landscape
6.1 List of Major Companies, By Region
6.2 Market Share Analysis, By Region
6.3 Product Benchmarking
6.3.1 Product specifications and features
6.3.2 Pricing
6.4 Strategic Initiatives
6.4.1 Marketing and promotional activities
6.4.2 Distribution and supply chain strategies
6.4.3 Expansion plans and new product launches
6.4.4 Strategic partnerships and collaborations
6.5 Technological Advancements
6.6 Market Positioning and Branding
7. Non-Destructive Testing Market Segmentation, by Type
7.1 Chapter Overview
7.2 Equipment
7.2.1 Equipment Market Trends Analysis (2020-2032)
7.2.2 Equipment Market Size Estimates and Forecasts to 2032 (USD Billion)
7.3 Services
7.3.1 Services Market Trends Analysis (2020-2032)
7.3.2 Services Market Size Estimates and Forecasts to 2032 (USD Billion)
8. Non-Destructive Testing Market Segmentation, by Testing Technology
8.1 Chapter Overview
8.2 Radiography Testing
8.2.1 Radiography Testing Market Trends Analysis (2020-2032)
8.2.2 Radiography Testing Market Size Estimates and Forecasts to 2032 (USD Billion)
8.3 Ultrasonic Testing
8.3.1 Ultrasonic Testing Market Trends Analysis (2020-2032)
8.3.2 Ultrasonic Testing Market Size Estimates and Forecasts to 2032 (USD Billion)
8.4 Magnetic Particle Testing
8.4.1 Magnetic Particle Testing Market Trends Analysis (2020-2032)
8.4.2 Magnetic Particle Testing Market Size Estimates and Forecasts to 2032 (USD Billion)
8.5 Liquid Penetrant Testing
8.5.1 Liquid Penetrant Testing Market Trends Analysis (2020-2032)
8.5.2 Liquid Penetrant Testing Market Size Estimates and Forecasts to 2032 (USD Billion)
8.6 Visual Inspection Testing
8.6.1 Visual Inspection Testing Market Trends Analysis (2020-2032)
8.6.2 Visual Inspection Testing Market Size Estimates and Forecasts to 2032 (USD Billion)
8.7 Eddy Current Testing
8.7.1 Eddy Current Testing Market Trends Analysis (2020-2032)
8.7.2 Eddy Current Testing Market Size Estimates and Forecasts to 2032 (USD Billion)
8.7 Other Testing Technologies
8.7.1 Other Testing Technologies Market Trends Analysis (2020-2032)
8.7.2 Other Testing Technologies Market Size Estimates and Forecasts to 2032 (USD Billion)
9. Non-Destructive Testing Market Segmentation, by End-User
9.1 Chapter Overview
9.2 Oil and Gas
9.2.1 Oil and Gas Market Trends Analysis (2020-2032)
9.2.2 Oil and Gas Market Size Estimates and Forecasts to 2032 (USD Billion)
9.3 Power and Energy
9.3.1 Power and Energy Market Trends Analysis (2020-2032)
9.3.2 Power and Energy Market Size Estimates and Forecasts to 2032 (USD Billion)
9.4 Construction
9.4.1 Construction Market Trends Analysis (2020-2032)
9.4.2 Construction Market Size Estimates and Forecasts to 2032 (USD Billion)
9.5 Automotive and Transportation
9.5.1 Automotive and Transportation Market Trends Analysis (2020-2032)
9.5.2 Automotive and Transportation Market Size Estimates and Forecasts to 2032 (USD Billion)
9.6 Aerospace
9.6.1 Aerospace Market Trends Analysis (2020-2032)
9.6.2 Aerospace Market Size Estimates and Forecasts to 2032 (USD Billion)
9.7 Defense
9.7.1 Defense Market Trends Analysis (2020-2032)
9.7.2 Defense Market Size Estimates and Forecasts to 2032 (USD Billion)
9.8 Other End User Industries
9.8.1 Other End User Industries Market Trends Analysis (2020-2032)
9.8.2 Other End User Industries Market Size Estimates and Forecasts to 2032 (USD Billion)
10. Regional Analysis
10.1 Chapter Overview
10.2 North America
10.2.1 Trends Analysis
10.2.2 North America Non-Destructive Testing Market Estimates and Forecasts, by Country (2020-2032) (USD Billion)
10.2.3 North America Non-Destructive Testing Market Estimates and Forecasts, by Type (2020-2032) (USD Billion)
10.2.4 North America Non-Destructive Testing Market Estimates and Forecasts, by Testing Technology (2020-2032) (USD Billion)
10.2.5 North America Non-Destructive Testing Market Estimates and Forecasts, by End-User (2020-2032) (USD Billion)
10.2.6 USA
10.2.6.1 USA Non-Destructive Testing Market Estimates and Forecasts, by Type (2020-2032) (USD Billion)
10.2.6.2 USA Non-Destructive Testing Market Estimates and Forecasts, by Testing Technology (2020-2032) (USD Billion)
10.2.6.3 USA Non-Destructive Testing Market Estimates and Forecasts, by End-User (2020-2032) (USD Billion)
10.2.7 Canada
10.2.7.1 Canada Non-Destructive Testing Market Estimates and Forecasts, by Type (2020-2032) (USD Billion)
10.2.7.2 Canada Non-Destructive Testing Market Estimates and Forecasts, by Testing Technology (2020-2032) (USD Billion)
10.2.7.3 Canada Non-Destructive Testing Market Estimates and Forecasts, by End-User (2020-2032) (USD Billion)
10.2.8 Mexico
10.2.8.1 Mexico Non-Destructive Testing Market Estimates and Forecasts, by Type (2020-2032) (USD Billion)
10.2.8.2 Mexico Non-Destructive Testing Market Estimates and Forecasts, by Testing Technology (2020-2032) (USD Billion)
10.2.8.3 Mexico Non-Destructive Testing Market Estimates and Forecasts, by End-User (2020-2032) (USD Billion)
10.3 Europe
10.3.1 Eastern Europe
10.3.1.1 Trends Analysis
10.3.1.2 Eastern Europe Non-Destructive Testing Market Estimates and Forecasts, by Country (2020-2032) (USD Billion)
10.3.1.3 Eastern Europe Non-Destructive Testing Market Estimates and Forecasts, by Type (2020-2032) (USD Billion)
10.3.1.4 Eastern Europe Non-Destructive Testing Market Estimates and Forecasts, by Testing Technology (2020-2032) (USD Billion)
10.3.1.5 Eastern Europe Non-Destructive Testing Market Estimates and Forecasts, by End-User (2020-2032) (USD Billion)
10.3.1.6 Poland
10.3.1.6.1 Poland Non-Destructive Testing Market Estimates and Forecasts, by Type (2020-2032) (USD Billion)
10.3.1.6.2 Poland Non-Destructive Testing Market Estimates and Forecasts, by Testing Technology (2020-2032) (USD Billion)
10.3.1.6.3 Poland Non-Destructive Testing Market Estimates and Forecasts, by End-User (2020-2032) (USD Billion)
10.3.1.7 Romania
10.3.1.7.1 Romania Non-Destructive Testing Market Estimates and Forecasts, by Type (2020-2032) (USD Billion)
10.3.1.7.2 Romania Non-Destructive Testing Market Estimates and Forecasts, by Testing Technology (2020-2032) (USD Billion)
10.3.1.7.3 Romania Non-Destructive Testing Market Estimates and Forecasts, by End-User (2020-2032) (USD Billion)
10.3.1.8 Hungary
10.3.1.8.1 Hungary Non-Destructive Testing Market Estimates and Forecasts, by Type (2020-2032) (USD Billion)
10.3.1.8.2 Hungary Non-Destructive Testing Market Estimates and Forecasts, by Testing Technology (2020-2032) (USD Billion)
10.3.1.8.3 Hungary Non-Destructive Testing Market Estimates and Forecasts, by End-User (2020-2032) (USD Billion)
10.3.1.9 Turkey
10.3.1.9.1 Turkey Non-Destructive Testing Market Estimates and Forecasts, by Type (2020-2032) (USD Billion)
10.3.1.9.2 Turkey Non-Destructive Testing Market Estimates and Forecasts, by Testing Technology (2020-2032) (USD Billion)
10.3.1.9.3 Turkey Non-Destructive Testing Market Estimates and Forecasts, by End-User (2020-2032) (USD Billion)
10.3.1.10 Rest of Eastern Europe
10.3.1.10.1 Rest of Eastern Europe Non-Destructive Testing Market Estimates and Forecasts, by Type (2020-2032) (USD Billion)
10.3.1.10.2 Rest of Eastern Europe Non-Destructive Testing Market Estimates and Forecasts, by Testing Technology (2020-2032) (USD Billion)
10.3.1.10.3 Rest of Eastern Europe Non-Destructive Testing Market Estimates and Forecasts, by End-User (2020-2032) (USD Billion)
10.3.2 Western Europe
10.3.2.1 Trends Analysis
10.3.2.2 Western Europe Non-Destructive Testing Market Estimates and Forecasts, by Country (2020-2032) (USD Billion)
10.3.2.3 Western Europe Non-Destructive Testing Market Estimates and Forecasts, by Type (2020-2032) (USD Billion)
10.3.2.4 Western Europe Non-Destructive Testing Market Estimates and Forecasts, by Testing Technology (2020-2032) (USD Billion)
10.3.2.5 Western Europe Non-Destructive Testing Market Estimates and Forecasts, by End-User (2020-2032) (USD Billion)
10.3.2.6 Germany
10.3.2.6.1 Germany Non-Destructive Testing Market Estimates and Forecasts, by Type (2020-2032) (USD Billion)
10.3.2.6.2 Germany Non-Destructive Testing Market Estimates and Forecasts, by Testing Technology (2020-2032) (USD Billion)
10.3.2.6.3 Germany Non-Destructive Testing Market Estimates and Forecasts, by End-User (2020-2032) (USD Billion)
10.3.2.7 France
10.3.2.7.1 France Non-Destructive Testing Market Estimates and Forecasts, by Type (2020-2032) (USD Billion)
10.3.2.7.2 France Non-Destructive Testing Market Estimates and Forecasts, by Testing Technology (2020-2032) (USD Billion)
10.3.2.7.3 France Non-Destructive Testing Market Estimates and Forecasts, by End-User (2020-2032) (USD Billion)
10.3.2.8 UK
10.3.2.8.1 UK Non-Destructive Testing Market Estimates and Forecasts, by Type (2020-2032) (USD Billion)
10.3.2.8.2 UK Non-Destructive Testing Market Estimates and Forecasts, by Testing Technology (2020-2032) (USD Billion)
10.3.2.8.3 UK Non-Destructive Testing Market Estimates and Forecasts, by End-User (2020-2032) (USD Billion)
10.3.2.9 Italy
10.3.2.9.1 Italy Non-Destructive Testing Market Estimates and Forecasts, by Type (2020-2032) (USD Billion)
10.3.2.9.2 Italy Non-Destructive Testing Market Estimates and Forecasts, by Testing Technology (2020-2032) (USD Billion)
10.3.2.9.3 Italy Non-Destructive Testing Market Estimates and Forecasts, by End-User (2020-2032) (USD Billion)
10.3.2.10 Spain
10.3.2.10.1 Spain Non-Destructive Testing Market Estimates and Forecasts, by Type (2020-2032) (USD Billion)
10.3.2.10.2 Spain Non-Destructive Testing Market Estimates and Forecasts, by Testing Technology (2020-2032) (USD Billion)
10.3.2.10.3 Spain Non-Destructive Testing Market Estimates and Forecasts, by End-User (2020-2032) (USD Billion)
10.3.2.11 Netherlands
10.3.2.11.1 Netherlands Non-Destructive Testing Market Estimates and Forecasts, by Type (2020-2032) (USD Billion)
10.3.2.11.2 Netherlands Non-Destructive Testing Market Estimates and Forecasts, by Testing Technology (2020-2032) (USD Billion)
10.3.2.11.3 Netherlands Non-Destructive Testing Market Estimates and Forecasts, by End-User (2020-2032) (USD Billion)
10.3.2.12 Switzerland
10.3.2.12.1 Switzerland Non-Destructive Testing Market Estimates and Forecasts, by Type (2020-2032) (USD Billion)
10.3.2.12.2 Switzerland Non-Destructive Testing Market Estimates and Forecasts, by Testing Technology (2020-2032) (USD Billion)
10.3.2.12.3 Switzerland Non-Destructive Testing Market Estimates and Forecasts, by End-User (2020-2032) (USD Billion)
10.3.2.13 Austria
10.3.2.13.1 Austria Non-Destructive Testing Market Estimates and Forecasts, by Type (2020-2032) (USD Billion)
10.3.2.13.2 Austria Non-Destructive Testing Market Estimates and Forecasts, by Testing Technology (2020-2032) (USD Billion)
10.3.2.13.3 Austria Non-Destructive Testing Market Estimates and Forecasts, by End-User (2020-2032) (USD Billion)
10.3.2.14 Rest of Western Europe
10.3.2.14.1 Rest of Western Europe Non-Destructive Testing Market Estimates and Forecasts, by Type (2020-2032) (USD Billion)
10.3.2.14.2 Rest of Western Europe Non-Destructive Testing Market Estimates and Forecasts, by Testing Technology (2020-2032) (USD Billion)
10.3.2.14.3 Rest of Western Europe Non-Destructive Testing Market Estimates and Forecasts, by End-User (2020-2032) (USD Billion)
10.4 Asia-Pacific
10.4.1 Trends Analysis
10.4.2 Asia-Pacific Non-Destructive Testing Market Estimates and Forecasts, by Country (2020-2032) (USD Billion)
10.4.3 Asia-Pacific Non-Destructive Testing Market Estimates and Forecasts, by Type (2020-2032) (USD Billion)
10.4.4 Asia-Pacific Non-Destructive Testing Market Estimates and Forecasts, by Testing Technology (2020-2032) (USD Billion)
10.4.5 Asia-Pacific Non-Destructive Testing Market Estimates and Forecasts, by End-User (2020-2032) (USD Billion)
10.4.6 China
10.4.6.1 China Non-Destructive Testing Market Estimates and Forecasts, by Type (2020-2032) (USD Billion)
10.4.6.2 China Non-Destructive Testing Market Estimates and Forecasts, by Testing Technology (2020-2032) (USD Billion)
10.4.6.3 China Non-Destructive Testing Market Estimates and Forecasts, by End-User (2020-2032) (USD Billion)
10.4.7 India
10.4.7.1 India Non-Destructive Testing Market Estimates and Forecasts, by Type (2020-2032) (USD Billion)
10.4.7.2 India Non-Destructive Testing Market Estimates and Forecasts, by Testing Technology (2020-2032) (USD Billion)
10.4.7.3 India Non-Destructive Testing Market Estimates and Forecasts, by End-User (2020-2032) (USD Billion)
10.4.8 Japan
10.4.8.1 Japan Non-Destructive Testing Market Estimates and Forecasts, by Type (2020-2032) (USD Billion)
10.4.8.2 Japan Non-Destructive Testing Market Estimates and Forecasts, by Testing Technology (2020-2032) (USD Billion)
10.4.8.3 Japan Non-Destructive Testing Market Estimates and Forecasts, by End-User (2020-2032) (USD Billion)
10.4.9 South Korea
10.4.9.1 South Korea Non-Destructive Testing Market Estimates and Forecasts, by Type (2020-2032) (USD Billion)
10.4.9.2 South Korea Non-Destructive Testing Market Estimates and Forecasts, by Testing Technology (2020-2032) (USD Billion)
10.4.9.3 South Korea Non-Destructive Testing Market Estimates and Forecasts, by End-User (2020-2032) (USD Billion)
10.4.10 Vietnam
10.4.10.1 Vietnam Non-Destructive Testing Market Estimates and Forecasts, by Type (2020-2032) (USD Billion)
10.4.10.2 Vietnam Non-Destructive Testing Market Estimates and Forecasts, by Testing Technology (2020-2032) (USD Billion)
10.4.10.3 Vietnam Non-Destructive Testing Market Estimates and Forecasts, by End-User (2020-2032) (USD Billion)
10.4.11 Singapore
10.4.11.1 Singapore Non-Destructive Testing Market Estimates and Forecasts, by Type (2020-2032) (USD Billion)
10.4.11.2 Singapore Non-Destructive Testing Market Estimates and Forecasts, by Testing Technology (2020-2032) (USD Billion)
10.4.11.3 Singapore Non-Destructive Testing Market Estimates and Forecasts, by End-User (2020-2032) (USD Billion)
10.4.12 Australia
10.4.12.1 Australia Non-Destructive Testing Market Estimates and Forecasts, by Type (2020-2032) (USD Billion)
10.4.12.2 Australia Non-Destructive Testing Market Estimates and Forecasts, by Testing Technology (2020-2032) (USD Billion)
10.4.12.3 Australia Non-Destructive Testing Market Estimates and Forecasts, by End-User (2020-2032) (USD Billion)
10.4.13 Rest of Asia-Pacific
10.4.13.1 Rest of Asia-Pacific Non-Destructive Testing Market Estimates and Forecasts, by Type (2020-2032) (USD Billion)
10.4.13.2 Rest of Asia-Pacific Non-Destructive Testing Market Estimates and Forecasts, by Testing Technology (2020-2032) (USD Billion)
10.4.13.3 Rest of Asia-Pacific Non-Destructive Testing Market Estimates and Forecasts, by End-User (2020-2032) (USD Billion)
10.5 Middle East and Africa
10.5.1 Middle East
10.5.1.1 Trends Analysis
10.5.1.2 Middle East Non-Destructive Testing Market Estimates and Forecasts, by Country (2020-2032) (USD Billion)
10.5.1.3 Middle East Non-Destructive Testing Market Estimates and Forecasts, by Type (2020-2032) (USD Billion)
10.5.1.4 Middle East Non-Destructive Testing Market Estimates and Forecasts, by Testing Technology (2020-2032) (USD Billion)
10.5.1.5 Middle East Non-Destructive Testing Market Estimates and Forecasts, by End-User (2020-2032) (USD Billion)
10.5.1.6 UAE
10.5.1.6.1 UAE Non-Destructive Testing Market Estimates and Forecasts, by Type (2020-2032) (USD Billion)
10.5.1.6.2 UAE Non-Destructive Testing Market Estimates and Forecasts, by Testing Technology (2020-2032) (USD Billion)
10.5.1.6.3 UAE Non-Destructive Testing Market Estimates and Forecasts, by End-User (2020-2032) (USD Billion)
10.5.1.7 Egypt
10.5.1.7.1 Egypt Non-Destructive Testing Market Estimates and Forecasts, by Type (2020-2032) (USD Billion)
10.5.1.7.2 Egypt Non-Destructive Testing Market Estimates and Forecasts, by Testing Technology (2020-2032) (USD Billion)
10.5.1.7.3 Egypt Non-Destructive Testing Market Estimates and Forecasts, by End-User (2020-2032) (USD Billion)
10.5.1.8 Saudi Arabia
10.5.1.8.1 Saudi Arabia Non-Destructive Testing Market Estimates and Forecasts, by Type (2020-2032) (USD Billion)
10.5.1.8.2 Saudi Arabia Non-Destructive Testing Market Estimates and Forecasts, by Testing Technology (2020-2032) (USD Billion)
10.5.1.8.3 Saudi Arabia Non-Destructive Testing Market Estimates and Forecasts, by End-User (2020-2032) (USD Billion)
10.5.1.9 Qatar
10.5.1.9.1 Qatar Non-Destructive Testing Market Estimates and Forecasts, by Type (2020-2032) (USD Billion)
10.5.1.9.2 Qatar Non-Destructive Testing Market Estimates and Forecasts, by Testing Technology (2020-2032) (USD Billion)
10.5.1.9.3 Qatar Non-Destructive Testing Market Estimates and Forecasts, by End-User (2020-2032) (USD Billion)
10.5.1.10 Rest of Middle East
10.5.1.10.1 Rest of Middle East Non-Destructive Testing Market Estimates and Forecasts, by Type (2020-2032) (USD Billion)
10.5.1.10.2 Rest of Middle East Non-Destructive Testing Market Estimates and Forecasts, by Testing Technology (2020-2032) (USD Billion)
10.5.1.10.3 Rest of Middle East Non-Destructive Testing Market Estimates and Forecasts, by End-User (2020-2032) (USD Billion)
10.5.2 Africa
10.5.2.1 Trends Analysis
10.5.2.2 Africa Non-Destructive Testing Market Estimates and Forecasts, by Country (2020-2032) (USD Billion)
10.5.2.3 Africa Non-Destructive Testing Market Estimates and Forecasts, by Type (2020-2032) (USD Billion)
10.5.2.4 Africa Non-Destructive Testing Market Estimates and Forecasts, by Testing Technology (2020-2032) (USD Billion)
10.5.2.5 Africa Non-Destructive Testing Market Estimates and Forecasts, by End-User (2020-2032) (USD Billion)
10.5.2.6 South Africa
10.5.2.6.1 South Africa Non-Destructive Testing Market Estimates and Forecasts, by Type (2020-2032) (USD Billion)
10.5.2.6.2 South Africa Non-Destructive Testing Market Estimates and Forecasts, by Testing Technology (2020-2032) (USD Billion)
10.5.2.6.3 South Africa Non-Destructive Testing Market Estimates and Forecasts, by End-User (2020-2032) (USD Billion)
10.5.2.7 Nigeria
10.5.2.7.1 Nigeria Non-Destructive Testing Market Estimates and Forecasts, by Type (2020-2032) (USD Billion)
10.5.2.7.2 Nigeria Non-Destructive Testing Market Estimates and Forecasts, by Testing Technology (2020-2032) (USD Billion)
10.5.2.7.3 Nigeria Non-Destructive Testing Market Estimates and Forecasts, by End-User (2020-2032) (USD Billion)
10.5.2.8 Rest of Africa
10.5.2.8.1 Rest of Africa Non-Destructive Testing Market Estimates and Forecasts, by Type (2020-2032) (USD Billion)
10.5.2.8.2 Rest of Africa Non-Destructive Testing Market Estimates and Forecasts, by Testing Technology (2020-2032) (USD Billion)
10.5.2.8.3 Rest of Africa Non-Destructive Testing Market Estimates and Forecasts, by End-User (2020-2032) (USD Billion)
10.6 Latin America
10.6.1 Trends Analysis
10.6.2 Latin America Non-Destructive Testing Market Estimates and Forecasts, by Country (2020-2032) (USD Billion)
10.6.3 Latin America Non-Destructive Testing Market Estimates and Forecasts, by Type (2020-2032) (USD Billion)
10.6.4 Latin America Non-Destructive Testing Market Estimates and Forecasts, by Testing Technology (2020-2032) (USD Billion)
10.6.5 Latin America Non-Destructive Testing Market Estimates and Forecasts, by End-User (2020-2032) (USD Billion)
10.6.6 Brazil
10.6.6.1 Brazil Non-Destructive Testing Market Estimates and Forecasts, by Type (2020-2032) (USD Billion)
10.6.6.2 Brazil Non-Destructive Testing Market Estimates and Forecasts, by Testing Technology (2020-2032) (USD Billion)
10.6.6.3 Brazil Non-Destructive Testing Market Estimates and Forecasts, by End-User (2020-2032) (USD Billion)
10.6.7 Argentina
10.6.7.1 Argentina Non-Destructive Testing Market Estimates and Forecasts, by Type (2020-2032) (USD Billion)
10.6.7.2 Argentina Non-Destructive Testing Market Estimates and Forecasts, by Testing Technology (2020-2032) (USD Billion)
10.6.7.3 Argentina Non-Destructive Testing Market Estimates and Forecasts, by End-User (2020-2032) (USD Billion)
10.6.8 Colombia
10.6.8.1 Colombia Non-Destructive Testing Market Estimates and Forecasts, by Type (2020-2032) (USD Billion)
10.6.8.2 Colombia Non-Destructive Testing Market Estimates and Forecasts, by Testing Technology (2020-2032) (USD Billion)
10.6.8.3 Colombia Non-Destructive Testing Market Estimates and Forecasts, by End-User (2020-2032) (USD Billion)
10.6.9 Rest of Latin America
10.6.9.1 Rest of Latin America Non-Destructive Testing Market Estimates and Forecasts, by Type (2020-2032) (USD Billion)
10.6.9.2 Rest of Latin America Non-Destructive Testing Market Estimates and Forecasts, by Testing Technology (2020-2032) (USD Billion)
10.6.9.3 Rest of Latin America Non-Destructive Testing Market Estimates and Forecasts, by End-User (2020-2032) (USD Billion)
11. Company Profiles
11.1 Previan Technologies, Inc
11.1.1 Company Overview
11.1.2 Financial
11.1.3 Products/ Services Offered
11.1.4 SWOT Analysis
11.2 Bureau Veritas
11.2.1 Company Overview
11.2.2 Financial
11.2.3 Products/ Services Offered
11.2.4 SWOT Analysis
11.3 Fischer Technology Inc.
11.3.1 Company Overview
11.3.2 Financial
11.3.3 Products/ Services Offered
11.3.4 SWOT Analysis
11.4 MISTRAS Group
11.4.1 Company Overview
11.4.2 Financial
11.4.3 Products/ Services Offered
11.4.4 SWOT Analysis
11.5 Comet Group
11.5.1 Company Overview
11.5.2 Financial
11.5.3 Products/ Services Offered
11.5.4 SWOT Analysis
11.6 MME Group
11.6.1 Company Overview
11.6.2 Financial
11.6.3 Products/ Services Offered
11.6.4 SWOT Analysis
11.7 TWI Ltd.
11.7.1 Company Overview
11.7.2 Financial
11.7.3 Products/ Services Offered
11.7.4 SWOT Analysis
11.8 Nikon Corporation
11.8.1 Company Overview
11.8.2 Financial
11.8.3 Products/ Services Offered
11.8.4 SWOT Analysis
11.9 Olympus Corporation
11.9.1 Company Overview
11.9.2 Financial
11.9.3 Products/ Services Offered
11.9.4 SWOT Analysis
11.10 Sonatest
11.10.1 Company Overview
11.10.2 Financial
11.10.3 Products/ Services Offered
11.10.4 SWOT Analysis
12. Use Cases and Best Practices
13. Conclusion
An accurate research report requires proper strategizing as well as implementation. There are multiple factors involved in the completion of good and accurate research report and selecting the best methodology to compete the research is the toughest part. Since the research reports we provide play a crucial role in any company’s decision-making process, therefore we at SNS Insider always believe that we should choose the best method which gives us results closer to reality. This allows us to reach at a stage wherein we can provide our clients best and accurate investment to output ratio.
Each report that we prepare takes a timeframe of 350-400 business hours for production. Starting from the selection of titles through a couple of in-depth brain storming session to the final QC process before uploading our titles on our website we dedicate around 350 working hours. The titles are selected based on their current market cap and the foreseen CAGR and growth.
The 5 steps process:
Step 1: Secondary Research:
Secondary Research or Desk Research is as the name suggests is a research process wherein, we collect data through the readily available information. In this process we use various paid and unpaid databases which our team has access to and gather data through the same. This includes examining of listed companies’ annual reports, Journals, SEC filling etc. Apart from this our team has access to various associations across the globe across different industries. Lastly, we have exchange relationships with various university as well as individual libraries.
Step 2: Primary Research
When we talk about primary research, it is a type of study in which the researchers collect relevant data samples directly, rather than relying on previously collected data. This type of research is focused on gaining content specific facts that can be sued to solve specific problems. Since the collected data is fresh and first hand therefore it makes the study more accurate and genuine.
We at SNS Insider have divided Primary Research into 2 parts.
Part 1 wherein we interview the KOLs of major players as well as the upcoming ones across various geographic regions. This allows us to have their view over the market scenario and acts as an important tool to come closer to the accurate market numbers. As many as 45 paid and unpaid primary interviews are taken from both the demand and supply side of the industry to make sure we land at an accurate judgement and analysis of the market.
This step involves the triangulation of data wherein our team analyses the interview transcripts, online survey responses and observation of on filed participants. The below mentioned chart should give a better understanding of the part 1 of the primary interview.
Part 2: In this part of primary research the data collected via secondary research and the part 1 of the primary research is validated with the interviews from individual consultants and subject matter experts.
Consultants are those set of people who have at least 12 years of experience and expertise within the industry whereas Subject Matter Experts are those with at least 15 years of experience behind their back within the same space. The data with the help of two main processes i.e., FGDs (Focused Group Discussions) and IDs (Individual Discussions). This gives us a 3rd party nonbiased primary view of the market scenario making it a more dependable one while collation of the data pointers.
Step 3: Data Bank Validation
Once all the information is collected via primary and secondary sources, we run that information for data validation. At our intelligence centre our research heads track a lot of information related to the market which includes the quarterly reports, the daily stock prices, and other relevant information. Our data bank server gets updated every fortnight and that is how the information which we collected using our primary and secondary information is revalidated in real time.
Step 4: QA/QC Process
After all the data collection and validation our team does a final level of quality check and quality assurance to get rid of any unwanted or undesired mistakes. This might include but not limited to getting rid of the any typos, duplication of numbers or missing of any important information. The people involved in this process include technical content writers, research heads and graphics people. Once this process is completed the title gets uploader on our platform for our clients to read it.
Step 5: Final QC/QA Process:
This is the last process and comes when the client has ordered the study. In this process a final QA/QC is done before the study is emailed to the client. Since we believe in giving our clients a good experience of our research studies, therefore, to make sure that we do not lack at our end in any way humanly possible we do a final round of quality check and then dispatch the study to the client.
Key Segments:
By Type
Equipment
Services
By Testing Technology
Radiography Testing
Ultrasonic Testing
Magnetic Particle Testing
Liquid Penetrant Testing
Visual Inspection Testing
Eddy Current Testing
Other Testing Technologies
By End-User
Oil and Gas
Power and Energy
Construction
Automotive and Transportation
Aerospace
Defense
Other End User Industries
Request for Segment Customization as per your Business Requirement: Segment Customization Request
REGIONAL COVERAGE:
North America
US
Canada
Mexico
Europe
Eastern Europe
Poland
Romania
Hungary
Turkey
Rest of Eastern Europe
Western Europe
Germany
France
UK
Italy
Spain
Netherlands
Switzerland
Austria
Rest of Western Europe
Asia-Pacific
China
India
Japan
South Korea
Vietnam
Singapore
Australia
Rest of Asia Pacific
Middle East & Africa
Middle East
UAE
Egypt
Saudi Arabia
Qatar
Rest of the Middle East
Africa
Nigeria
South Africa
Rest of Africa
Latin America
Brazil
Argentina
Colombia
Rest of Latin America
Request for Country Level Research Report: Country Level Customization Request
Available Customization
With the given market data, SNS Insider offers customization as per the company’s specific needs. The following customization options are available for the report:
Product Analysis
Criss-Cross segment analysis (e.g. Product X Application)
Product Matrix which gives a detailed comparison of the product portfolio of each company
Geographic Analysis
Additional countries in any of the regions
Company Information
Detailed analysis and profiling of additional market players (Up to five)
The Micromachining Market Size was valued at USD 3 Billion in 2023 and is now anticipated to grow $9.19 Billion by 2031, with a CAGR of 5.26% by 2024-2031.
The Air Duct Market Share was valued at USD 9.67 Billion in 2023 & is now anticipated to grow to USD 13.83 Billion by 2031, with a CAGR of 4.58% by2024-2031.
The Downhole Tools Market size was valued at USD 5.32 Billion in 2023. It is expected to grow to USD 7.99 Billion by 2032 and grow at a CAGR of 4.41% over the forecast period of 2024-2032.
The Tamper-Evident Labels Market size was valued at USD 16.98 billion in 2023. It is expected to grow to USD 25.08 billion by 2032 and grow at a CAGR of 4.43% over the forecast period of 2024-2032.
The Smart Elevator Market size was estimated at USD 14.75 billion in 2023 and is expected to reach USD 32.58 billion by 2032 at a CAGR of 9.21% during the forecast period of 2024-2032.
The Telehandler Market size was valued at USD 5.66 Billion in 2023 and is now anticipated to grow to USD 8.56 Billion by 2032, displaying a compound annual growth rate (CAGR) of 4.87% during the forecast Period 2024-2032.
Hi! Click one of our member below to chat on Phone