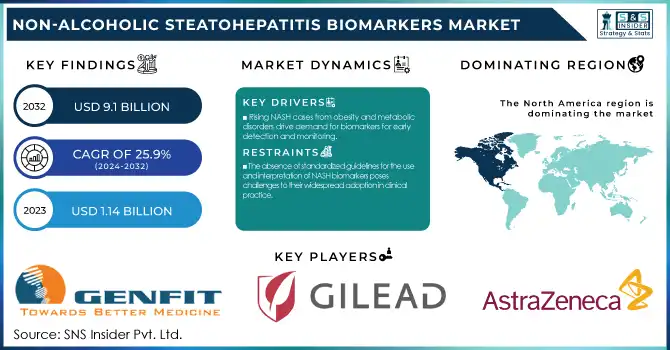
The Non-alcoholic Steatohepatitis Biomarkers Market size was USD 1.14 Billion in 2023, projected to hit USD 9.1 Billion by 2032, growing at a CAGR of 25.9% over the forecast period 2024-2032.
To Get more information on Non-alcoholic Steatohepatitis Biomarkers Market - Request Free Sample Report
The Non-alcoholic Steatohepatitis (NASH) Biomarkers Market Report provides key statistical insights and trends, including the incidence and prevalence of NASH in 2023 across regions and demographics. It has also studied biomarker adoption, showing that more and more people are moving away from biopsies and toward non-invasive diagnostic tools, including circulating imaging, and genomic biomarkers. The report introduces trends in prescription and treatment monitoring whilst exploring how biomarker-driven strategies influence emerging treatment options. Besides, it also includes healthcare expenditure trends, and price comparisons for diagnostic solutions. It assesses the regulatory environment, particularly addressing adherence to the guidelines set by the FDA, EMA, and PMDA.
The growth of the market is primarily associated with the increasing number of NASH and associated liver diseases. According to the National Institute of Diabetes and Digestive and Kidney Diseases (NIDDK), NASH affects 3-12% of adults in the United States, with higher rates among those with obesity and type 2 diabetes.
Drivers
The increasing global incidence of NASH, driven by factors such as obesity and metabolic disorders, is fueling the demand for effective biomarkers for early detection and monitoring.
The growing rate of Non-Alcoholic Steatohepatitis (NASH) contributes to the growing demand for effective biomarkers. Global prevalence for Non-Alcoholic Fatty Liver Disease (NAFLD), the predecessor to NASH, has been suggested to be as high as 32.4%, with incidences of 46.9 per 1,000 person-years. This increase is closely tied to the growing rates of obesity and type 2 diabetes. Notably, in individuals with obesity and type 2 diabetes, NAFLD prevalence ranges between 50% and 70%. The estimated annual prevalence of NASH in the United States increased from 1.51% in 2010 to 2.79% in 2020. This increase is significantly associated with metabolic conditions, with odds ratios for diabetes mellitus and obesity of 18.61 and 20.97, respectively, both of which promote the development of NASH. It is expected that the global prevalence rates of NAFLD will increase to 46.10% in males and 41.02% in females, whereas NASH prevalence will increase to 18.90% in males and 18.41% in females by 2030. These numbers emphasize the urgent need for reliable NASH biomarkers for disease detection, monitoring of disease progression, and assessment of therapeutic efficacy for combatting the rising health burden associated with NASH.
Restraints:
The absence of standardized guidelines for the use and interpretation of NASH biomarkers poses challenges to their widespread adoption in clinical practice.
The lack of standardization in Non-Alcoholic Steatohepatitis (NASH) biomarkers significantly hampers their clinical application. Currently, there is no universally accepted protocol for utilizing and interpreting these biomarkers, leading to inconsistencies in diagnosis and disease monitoring. This variability can lead to misdiagnosis or delayed treatment, resulting in poor outcomes for the patient. Additionally, the lack of standardizations makes it difficult to compare findings among studies, hindering the validation of potential biomarkers and the development of effective diagnostic equipment. The creation of consistent protocols and stringent validation methods is therefore critical to address these issues and ensure both the reliability and clinical utility of NASH biomarkers.
Opportunities:
Innovations in omics-based approaches, imaging techniques, and artificial intelligence are enhancing the development of novel biomarkers, offering potential for more accurate and non-invasive diagnostics.
Advancements in diagnostic technologies are significantly enhancing the identification and monitoring of Non-Alcoholic Steatohepatitis (NASH). A notable development is the application of artificial intelligence (AI) in imaging techniques. As an example, HistoIndex's stain-free & AI-powered tissue imaging technology outperformed in clinical trials. Compared to manual assessments performed by pathologists, this technology detected a greater percentage of patients showing improvement following treatment with Resmetirom in the MAESTRO-NASH Study. Proteomics profiling is another area contributing to NASH biomarker development. Researchers utilizing Standard BioTools' SomaScan Platform identified 69 blood biomarkers correlating with clinical measures of liver disease. These biomarkers were markedly increased in the NASH individual’s vs NAFLD, demonstrating their potential to differentiate between these conditions.
Nash detection is also synthesized on machine learning models. A study involving gradient-boosted decision trees trained on longitudinal prescription and medical claims data achieved an area under the receiver operating characteristic curve (AUROC) of 0.84. At 10% recall, the model's precision was 4.3%, indicating a 60-fold increase over the baseline NASH incidence. This suggests that machine learning could effectively identify probable NASH patients for further diagnostic evaluation.
Challenges:
Navigating complex regulatory pathways and securing reimbursement approvals are significant challenges that can impede the development and commercialization of NASH biomarkers.
Regulatory and reimbursement challenges can be enormous for the development and commercialization of Non-Alcoholic Steatohepatitis (NASH) biomarkers. Regulatory authorities like the U.S. Food and Drug Administration (FDA) require that biomarkers be extensively validated to establish their accuracy, reliability, and clinical utility. This process requires considerable evidence from many studies, making it an extensive and lengthy process. For example, the approval of Madrigal Pharmaceuticals' Rezdiffra by the FDA in March 2024 highlights the demanding standards for providing evidence of safety and efficacy in therapies for NASH.
Additionally, securing reimbursement for NASH biomarkers poses hurdles. Healthcare payers mandate robust evidence of clinical and economic value before granting coverage. This has led to the emergence of new diagnostic services that may be limited to specific regions, as well as a lack of standardized guidelines for their use, thus restricting patient access to biomarker-based strategies. Addressing these challenges is crucial for the successful integration of NASH biomarkers into clinical practice.
By Type
The serum biomarkers segment accounted for the largest market share of 33% in 2023, the market is primarily dominated by serum biomarkers, owing to their non-invasive nature and ease of use in clinical settings. The best-known NASH biomarkers are a group of substances in the blood, including fragments of cytokeratin-18 (CK-18), they are less invasive than known liver biopsies and can be used to diagnose and monitor NASH. Serum CK-18 levels had a sensitivity of 78% and specificity of 87% for diagnosing NASH.
The apoptosis biomarkers segment is projected to grow at lucrative growth rates. The apoptosis biomarkers segment is gaining traction due to the critical role of programmed cell death in NASH pathogenesis. Research supported by the NIH has shown that hepatocyte apoptosis is a key feature of NASH and correlates with disease severity. Both apoptosis markers like soluble Fas (sFas) have shown high diagnostic accuracy the area under the curve (AUC) for diagnosis of NASH was 0.93 when combined with CK-18 fragments of apoptosis. Apoptosis is likely to play a significant role in the synthetic development of tests and biomarkers to inhibit NASH progression, and investment opportunities in drugs and personalized medicine approaches are increasing.
By End-use
In 2023, the pharma and CRO industry end-use segment accounted for the largest market share of 39%. This dominance is attributed to the intensive research and development activities in NASH therapeutics. According to the U.S. National Library of Medicine's ClinicalTrials.gov database, there were over 200 active clinical trials for NASH treatments as of early 2025. The pharmaceutical industry and CROs are investing heavily in biomarker discovery and validation, as a complement to drug development activities. These biomarkers are essential for patient stratification, monitoring treatment efficacy, and as surrogate endpoints in clinical trials.
The FDA has promoted non-invasive biomarker use in NASH clinical trials, which is leading to greater adoption in the pharma and CRO space. A 2023 FDA guidance on drug development for NASH addresses the role of biomarkers in speeding up the approval of new drugs. This regulatory underpinning has catalyzed collaborations between biotech companies and academic institutions to drive innovation around the development and validation of biomarkers for NASH.
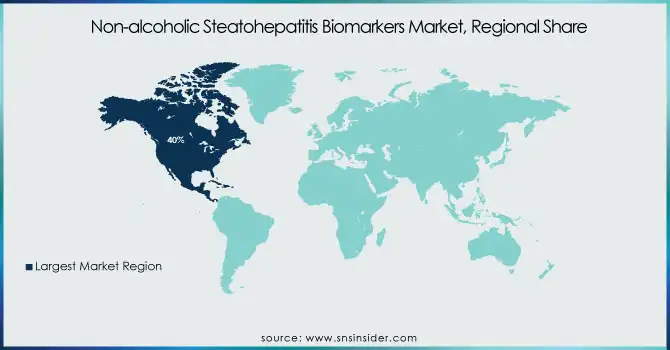
In 2023, the Non-alcoholic Steatohepatitis Biomarkers Market was led by North America, with about 40% of the market share. This prevalence is partly a reflection of the extremely high burden of NASH and its associated risk factors in the United States. A major risk factor for the development of NASH, the U.S. Centers for Disease Control and Prevention (CDC) reported that the prevalence of obesity among U.S. adults was 42.4% in 2023. North America dominates the market due to the strong healthcare infrastructure, advanced research facilities, and presence of major pharmaceutical players in the region. The region has a high amount of money being invested in researching NASH, with the NIH investing over USD 100 million per year in liver disease, including NASH. Additionally, the U.S. has a favorable regulatory environment for biomarker development and validation, exemplified by the FDA's Biomarker Qualification Program, which has accelerated the integration of novel biomarkers into drug development pipelines.
Europe region accounted for a significant revenue share and is anticipated to grow at a significant CAGR over the forecast period. Fueled By Rising NASH Prevalence & Robust Research Efforts. There has also been support for the development of biomarkers in NASH reflected in the recent Qualification Opinion issued by the EMA, as part of ongoing global efforts to enhance diagnostic and therapeutic opportunities.
Get Customized Report as per Your Business Requirement - Enquiry Now
Recent Developments
In Sept 2024, Siemens Healthineers released a next-generation NASH biomarker assay that integrate multiple serum-based markers into a single assay via AI algorithms to enhance diagnostic accuracy. In a breakthrough towards non-invasive NASH diagnosis, the (assay) received clearance from the FDA to be used in clinical settings.
In Jan 2025, AstraZeneca and Novo Nordisk teamed up to create a biomarker platform for NASH that combined genomic, proteomic and metabolomic information. This approach is to discover new therapeutic targets and to offer personalized treatment methods for patients with NASH.
Key Service Providers/Manufacturers
GENFIT (NIS4™, Elafibranor)
Gilead Sciences (Selonsertib, Cilofexor)
AstraZeneca (Dapagliflozin, Epanova)
Novartis AG (Tropifexor, LJN452)
GE Healthcare (LiverMultiScan, FibroScan)
Siemens Healthineers (ADVIA Centaur® CP Immunoassay System, Atellica® Solution)
Bristol-Myers Squibb (Pegbelfermin, BMS-986036)
Pfizer Inc. (PF-06865571, PF-05221304)
Akero Therapeutics (Efruxifermin, AKR-001)
89bio (Pegozafermin, BIO89-100)
Users:
Mayo Clinic
Cleveland Clinic
Johns Hopkins Medicine
Massachusetts General Hospital
University of California, San Francisco (UCSF) Medical Center
Cedars-Sinai Medical Center
Mount Sinai Hospital
Duke University Hospital
Stanford Health Care
Houston Methodist Hospital
| Report Attributes | Details |
|---|---|
| Market Size in 2023 | USD 1.14 Billion |
| Market Size by 2032 | USD 9.1 Billion |
| CAGR | CAGR of 25.9% From 2024 to 2032 |
| Base Year | 2023 |
| Forecast Period | 2024-2032 |
| Historical Data | 2020-2022 |
| Report Scope & Coverage | Market Size, Segments Analysis, Competitive Landscape, Regional Analysis, DROC & SWOT Analysis, Forecast Outlook |
| Key Segments | • By Type (Serum Biomarkers, Oxidative Stress Biomarkers, Hepatic Fibrosis Biomarkers, Apoptosis Biomarkers, Others) • By End-use (Pharma & CRO Industry, Diagnostic Labs, Hospitals, Academic Research Institutes) |
| Regional Analysis/Coverage | North America (US, Canada, Mexico), Europe (Eastern Europe [Poland, Romania, Hungary, Turkey, Rest of Eastern Europe] Western Europe] Germany, France, UK, Italy, Spain, Netherlands, Switzerland, Austria, Rest of Western Europe]), Asia Pacific (China, India, Japan, South Korea, Vietnam, Singapore, Australia, Rest of Asia Pacific), Middle East & Africa (Middle East [UAE, Egypt, Saudi Arabia, Qatar, Rest of Middle East], Africa [Nigeria, South Africa, Rest of Africa], Latin America (Brazil, Argentina, Colombia, Rest of Latin America) |
| Company Profiles | GENFIT, Gilead Sciences, AstraZeneca, Novartis AG, GE Healthcare, Siemens Healthineers, Bristol-Myers Squibb, Pfizer Inc., Akero Therapeutics, 89bio |
Ans. The projected market size for the Non-alcoholic Steatohepatitis Biomarkers Market is USD 9.1 Billion by 2032.
Ans: The North American region dominated the Non-alcoholic Steatohepatitis Biomarkers Market in 2023.
Ans. The pharma and CRO industry End-use segment dominated the Non-alcoholic Steatohepatitis Biomarkers Market.
Ans: The major key players in the market are GENFIT, Gilead Sciences, AstraZeneca, Novartis AG, GE Healthcare, Siemens Healthineers, Bristol-Myers Squibb, Pfizer Inc., Akero Therapeutics, 89bio, and others in the final report.
Ans:
Table of Contents:
1. Introduction
1.1 Market Definition
1.2 Scope (Inclusion and Exclusions)
1.3 Research Assumptions
2. Executive Summary
2.1 Market Overview
2.2 Regional Synopsis
2.3 Competitive Summary
3. Research Methodology
3.1 Top-Down Approach
3.2 Bottom-up Approach
3.3. Data Validation
3.4 Primary Interviews
4. Market Dynamics Impact Analysis
4.1 Market Driving Factors Analysis
4.1.2 Drivers
4.1.2 Restraints
4.1.3 Opportunities
4.1.4 Challenges
4.2 PESTLE Analysis
4.3 Porter’s Five Forces Model
5. Statistical Insights and Trends Reporting
5.1 Incidence and Prevalence of NASH (2023)
5.2 Diagnostic and Biomarker Adoption Rates (2023)
5.3 Prescription Trends & Treatment Monitoring (2023), by Region
5.4 Healthcare Spending on NASH Diagnostics & Monitoring (2023)
5.5 Regulatory Landscape & Compliance (2023)
6. Competitive Landscape
6.1 List of Major Companies, By Region
6.2 Market Share Analysis, By Region
6.3 Product Benchmarking
6.3.1 Product specifications and features
6.3.2 Pricing
6.4 Strategic Initiatives
6.4.1 Marketing and promotional activities
6.4.2 Distribution and supply chain strategies
6.4.3 Expansion plans and new product launches
6.4.4 Strategic partnerships and collaborations
6.5 Technological Advancements
6.6 Market Positioning and Branding
7. Non-alcoholic Steatohepatitis Biomarkers Market Segmentation, By Type
7.1 Chapter Overview
7.2 Serum Biomarkers
7.2.1 Serum Biomarkers Market Trends Analysis (2020-2032)
7.2.2 Serum Biomarkers Market Size Estimates and Forecasts to 2032 (USD Billion)
7.3 Oxidative Stress Biomarkers
7.3.1 Oxidative Stress Biomarkers Market Trends Analysis (2020-2032)
7.3.2 Oxidative Stress Biomarkers Market Size Estimates and Forecasts to 2032 (USD Billion)
7.4 Hepatic Fibrosis Biomarkers
7.4.1 Hepatic Fibrosis Biomarkers Market Trends Analysis (2020-2032)
7.4.2 Hepatic Fibrosis Biomarkers Market Size Estimates and Forecasts to 2032 (USD Billion)
7.5 Apoptosis Biomarkers
7.5.1 Apoptosis Biomarkers Market Trends Analysis (2020-2032)
7.5.2 Apoptosis Biomarkers Market Size Estimates and Forecasts to 2032 (USD Billion)
7.6 Others
7.6.1 Others Market Trends Analysis (2020-2032)
7.6.2 Others Market Size Estimates and Forecasts to 2032 (USD Billion)
8. Non-alcoholic Steatohepatitis Biomarkers Market Segmentation, By End-use
8.1 Chapter Overview
8.2 Pharma & CRO Industry
8.2.1 Pharma & CRO Industry Market Trends Analysis (2020-2032)
8.2.2 Pharma & CRO Industry Market Size Estimates and Forecasts to 2032 (USD Billion)
8.3 Diagnostic Labs
8.3.1 Diagnostic Labs Market Trends Analysis (2020-2032)
8.3.2 Diagnostic Labs Market Size Estimates and Forecasts to 2032 (USD Billion)
8.4 Hospitals
8.4.1 Hospitals Market Trends Analysis (2020-2032)
8.4.2 Hospitals Market Size Estimates and Forecasts to 2032 (USD Billion)
8.5 Academic Research Institutes
8.5.1 Academic Research Institutes Market Trends Analysis (2020-2032)
8.5.2 Academic Research Institutes Market Size Estimates and Forecasts to 2032 (USD Billion)
9. Regional Analysis
9.1 Chapter Overview
9.2 North America
9.2.1 Trends Analysis
9.2.2 North America Non-alcoholic Steatohepatitis Biomarkers Market Estimates and Forecasts, by Country (2020-2032) (USD Billion)
9.2.3 North America Non-alcoholic Steatohepatitis Biomarkers Market Estimates and Forecasts, By Type (2020-2032) (USD Billion)
9.2.4 North America Non-alcoholic Steatohepatitis Biomarkers Market Estimates and Forecasts, By End-use (2020-2032) (USD Billion)
9.2.5 USA
9.2.5.1 USA Non-alcoholic Steatohepatitis Biomarkers Market Estimates and Forecasts, By Type (2020-2032) (USD Billion)
9.2.5.2 USA Non-alcoholic Steatohepatitis Biomarkers Market Estimates and Forecasts, By End-use (2020-2032) (USD Billion)
9.2.6 Canada
9.2.6.1 Canada Non-alcoholic Steatohepatitis Biomarkers Market Estimates and Forecasts, By Type (2020-2032) (USD Billion)
9.2.6.2 Canada Non-alcoholic Steatohepatitis Biomarkers Market Estimates and Forecasts, By End-use (2020-2032) (USD Billion)
9.2.7 Mexico
9.2.7.1 Mexico Non-alcoholic Steatohepatitis Biomarkers Market Estimates and Forecasts, By Type (2020-2032) (USD Billion)
9.2.7.2 Mexico Non-alcoholic Steatohepatitis Biomarkers Market Estimates and Forecasts, By End-use (2020-2032) (USD Billion)
9.3 Europe
9.3.1 Eastern Europe
9.3.1.1 Trends Analysis
9.3.1.2 Eastern Europe Non-alcoholic Steatohepatitis Biomarkers Market Estimates and Forecasts, by Country (2020-2032) (USD Billion)
9.3.1.3 Eastern Europe Non-alcoholic Steatohepatitis Biomarkers Market Estimates and Forecasts, By Type (2020-2032) (USD Billion)
9.3.1.4 Eastern Europe Non-alcoholic Steatohepatitis Biomarkers Market Estimates and Forecasts, By End-use (2020-2032) (USD Billion)
9.3.1.5 Poland
9.3.1.5.1 Poland Non-alcoholic Steatohepatitis Biomarkers Market Estimates and Forecasts, By Type (2020-2032) (USD Billion)
9.3.1.5.2 Poland Non-alcoholic Steatohepatitis Biomarkers Market Estimates and Forecasts, By End-use (2020-2032) (USD Billion)
9.3.1.6 Romania
9.3.1.6.1 Romania Non-alcoholic Steatohepatitis Biomarkers Market Estimates and Forecasts, By Type (2020-2032) (USD Billion)
9.3.1.6.2 Romania Non-alcoholic Steatohepatitis Biomarkers Market Estimates and Forecasts, By End-use (2020-2032) (USD Billion)
9.3.1.7 Hungary
9.3.1.7.1 Hungary Non-alcoholic Steatohepatitis Biomarkers Market Estimates and Forecasts, By Type (2020-2032) (USD Billion)
9.3.1.7.2 Hungary Non-alcoholic Steatohepatitis Biomarkers Market Estimates and Forecasts, By End-use (2020-2032) (USD Billion)
9.3.1.8 Turkey
9.3.1.8.1 Turkey Non-alcoholic Steatohepatitis Biomarkers Market Estimates and Forecasts, By Type (2020-2032) (USD Billion)
9.3.1.8.2 Turkey Non-alcoholic Steatohepatitis Biomarkers Market Estimates and Forecasts, By End-use (2020-2032) (USD Billion)
9.3.1.9 Rest of Eastern Europe
9.3.1.9.1 Rest of Eastern Europe Non-alcoholic Steatohepatitis Biomarkers Market Estimates and Forecasts, By Type (2020-2032) (USD Billion)
9.3.1.9.2 Rest of Eastern Europe Non-alcoholic Steatohepatitis Biomarkers Market Estimates and Forecasts, By End-use (2020-2032) (USD Billion)
9.3.2 Western Europe
9.3.2.1 Trends Analysis
9.3.2.2 Western Europe Non-alcoholic Steatohepatitis Biomarkers Market Estimates and Forecasts, by Country (2020-2032) (USD Billion)
9.3.2.3 Western Europe Non-alcoholic Steatohepatitis Biomarkers Market Estimates and Forecasts, By Type (2020-2032) (USD Billion)
9.3.2.4 Western Europe Non-alcoholic Steatohepatitis Biomarkers Market Estimates and Forecasts, By End-use (2020-2032) (USD Billion)
9.3.2.5 Germany
9.3.2.5.1 Germany Non-alcoholic Steatohepatitis Biomarkers Market Estimates and Forecasts, By Type (2020-2032) (USD Billion)
9.3.2.5.2 Germany Non-alcoholic Steatohepatitis Biomarkers Market Estimates and Forecasts, By End-use (2020-2032) (USD Billion)
9.3.2.6 France
9.3.2.6.1 France Non-alcoholic Steatohepatitis Biomarkers Market Estimates and Forecasts, By Type (2020-2032) (USD Billion)
9.3.2.6.2 France Non-alcoholic Steatohepatitis Biomarkers Market Estimates and Forecasts, By End-use (2020-2032) (USD Billion)
9.3.2.7 UK
9.3.2.7.1 UK Non-alcoholic Steatohepatitis Biomarkers Market Estimates and Forecasts, By Type (2020-2032) (USD Billion)
9.3.2.7.2 UK Non-alcoholic Steatohepatitis Biomarkers Market Estimates and Forecasts, By End-use (2020-2032) (USD Billion)
9.3.2.8 Italy
9.3.2.8.1 Italy Non-alcoholic Steatohepatitis Biomarkers Market Estimates and Forecasts, By Type (2020-2032) (USD Billion)
9.3.2.8.2 Italy Non-alcoholic Steatohepatitis Biomarkers Market Estimates and Forecasts, By End-use (2020-2032) (USD Billion)
9.3.2.9 Spain
9.3.2.9.1 Spain Non-alcoholic Steatohepatitis Biomarkers Market Estimates and Forecasts, By Type (2020-2032) (USD Billion)
9.3.2.9.2 Spain Non-alcoholic Steatohepatitis Biomarkers Market Estimates and Forecasts, By End-use (2020-2032) (USD Billion)
9.3.2.10 Netherlands
9.3.2.10.1 Netherlands Non-alcoholic Steatohepatitis Biomarkers Market Estimates and Forecasts, By Type (2020-2032) (USD Billion)
9.3.2.10.2 Netherlands Non-alcoholic Steatohepatitis Biomarkers Market Estimates and Forecasts, By End-use (2020-2032) (USD Billion)
9.3.2.11 Switzerland
9.3.2.11.1 Switzerland Non-alcoholic Steatohepatitis Biomarkers Market Estimates and Forecasts, By Type (2020-2032) (USD Billion)
9.3.2.11.2 Switzerland Non-alcoholic Steatohepatitis Biomarkers Market Estimates and Forecasts, By End-use (2020-2032) (USD Billion)
9.3.2.12 Austria
9.3.2.12.1 Austria Non-alcoholic Steatohepatitis Biomarkers Market Estimates and Forecasts, By Type (2020-2032) (USD Billion)
9.3.2.12.2 Austria Non-alcoholic Steatohepatitis Biomarkers Market Estimates and Forecasts, By End-use (2020-2032) (USD Billion)
9.3.2.13 Rest of Western Europe
9.3.2.13.1 Rest of Western Europe Non-alcoholic Steatohepatitis Biomarkers Market Estimates and Forecasts, By Type (2020-2032) (USD Billion)
9.3.2.13.2 Rest of Western Europe Non-alcoholic Steatohepatitis Biomarkers Market Estimates and Forecasts, By End-use (2020-2032) (USD Billion)
9.4 Asia Pacific
9.4.1 Trends Analysis
9.4.2 Asia Pacific Non-alcoholic Steatohepatitis Biomarkers Market Estimates and Forecasts, by Country (2020-2032) (USD Billion)
9.4.3 Asia Pacific Non-alcoholic Steatohepatitis Biomarkers Market Estimates and Forecasts, By Type (2020-2032) (USD Billion)
9.4.4 Asia Pacific Non-alcoholic Steatohepatitis Biomarkers Market Estimates and Forecasts, By End-use (2020-2032) (USD Billion)
9.4.5 China
9.4.5.1 China Non-alcoholic Steatohepatitis Biomarkers Market Estimates and Forecasts, By Type (2020-2032) (USD Billion)
9.4.5.2 China Non-alcoholic Steatohepatitis Biomarkers Market Estimates and Forecasts, By End-use (2020-2032) (USD Billion)
9.4.6 India
9.4.5.1 India Non-alcoholic Steatohepatitis Biomarkers Market Estimates and Forecasts, By Type (2020-2032) (USD Billion)
9.4.5.2 India Non-alcoholic Steatohepatitis Biomarkers Market Estimates and Forecasts, By End-use (2020-2032) (USD Billion)
9.4.5 Japan
9.4.5.1 Japan Non-alcoholic Steatohepatitis Biomarkers Market Estimates and Forecasts, By Type (2020-2032) (USD Billion)
9.4.5.2 Japan Non-alcoholic Steatohepatitis Biomarkers Market Estimates and Forecasts, By End-use (2020-2032) (USD Billion)
9.4.6 South Korea
9.4.6.1 South Korea Non-alcoholic Steatohepatitis Biomarkers Market Estimates and Forecasts, By Type (2020-2032) (USD Billion)
9.4.6.2 South Korea Non-alcoholic Steatohepatitis Biomarkers Market Estimates and Forecasts, By End-use (2020-2032) (USD Billion)
9.4.7 Vietnam
9.4.7.1 Vietnam Non-alcoholic Steatohepatitis Biomarkers Market Estimates and Forecasts, By Type (2020-2032) (USD Billion)
9.2.7.2 Vietnam Non-alcoholic Steatohepatitis Biomarkers Market Estimates and Forecasts, By End-use (2020-2032) (USD Billion)
9.4.8 Singapore
9.4.8.1 Singapore Non-alcoholic Steatohepatitis Biomarkers Market Estimates and Forecasts, By Type (2020-2032) (USD Billion)
9.4.8.2 Singapore Non-alcoholic Steatohepatitis Biomarkers Market Estimates and Forecasts, By End-use (2020-2032) (USD Billion)
9.4.9 Australia
9.4.9.1 Australia Non-alcoholic Steatohepatitis Biomarkers Market Estimates and Forecasts, By Type (2020-2032) (USD Billion)
9.4.9.2 Australia Non-alcoholic Steatohepatitis Biomarkers Market Estimates and Forecasts, By End-use (2020-2032) (USD Billion)
9.4.10 Rest of Asia Pacific
9.4.10.1 Rest of Asia Pacific Non-alcoholic Steatohepatitis Biomarkers Market Estimates and Forecasts, By Type (2020-2032) (USD Billion)
9.4.10.2 Rest of Asia Pacific Non-alcoholic Steatohepatitis Biomarkers Market Estimates and Forecasts, By End-use (2020-2032) (USD Billion)
9.5 Middle East and Africa
9.5.1 Middle East
9.5.1.1 Trends Analysis
9.5.1.2 Middle East Non-alcoholic Steatohepatitis Biomarkers Market Estimates and Forecasts, by Country (2020-2032) (USD Billion)
9.5.1.3 Middle East Non-alcoholic Steatohepatitis Biomarkers Market Estimates and Forecasts, By Type (2020-2032) (USD Billion)
9.5.1.4 Middle East Non-alcoholic Steatohepatitis Biomarkers Market Estimates and Forecasts, By End-use (2020-2032) (USD Billion)
9.5.1.5 UAE
9.5.1.5.1 UAE Non-alcoholic Steatohepatitis Biomarkers Market Estimates and Forecasts, By Type (2020-2032) (USD Billion)
9.5.1.5.2 UAE Non-alcoholic Steatohepatitis Biomarkers Market Estimates and Forecasts, By End-use (2020-2032) (USD Billion)
9.5.1.6 Egypt
9.5.1.6.1 Egypt Non-alcoholic Steatohepatitis Biomarkers Market Estimates and Forecasts, By Type (2020-2032) (USD Billion)
9.5.1.6.2 Egypt Non-alcoholic Steatohepatitis Biomarkers Market Estimates and Forecasts, By End-use (2020-2032) (USD Billion)
9.5.1.7 Saudi Arabia
9.5.1.7.1 Saudi Arabia Non-alcoholic Steatohepatitis Biomarkers Market Estimates and Forecasts, By Type (2020-2032) (USD Billion)
9.5.1.7.2 Saudi Arabia Non-alcoholic Steatohepatitis Biomarkers Market Estimates and Forecasts, By End-use (2020-2032) (USD Billion)
9.5.1.8 Qatar
9.5.1.8.1 Qatar Non-alcoholic Steatohepatitis Biomarkers Market Estimates and Forecasts, By Type (2020-2032) (USD Billion)
9.5.1.8.2 Qatar Non-alcoholic Steatohepatitis Biomarkers Market Estimates and Forecasts, By End-use (2020-2032) (USD Billion)
9.5.1.9 Rest of Middle East
9.5.1.9.1 Rest of Middle East Non-alcoholic Steatohepatitis Biomarkers Market Estimates and Forecasts, By Type (2020-2032) (USD Billion)
9.5.1.9.2 Rest of Middle East Non-alcoholic Steatohepatitis Biomarkers Market Estimates and Forecasts, By End-use (2020-2032) (USD Billion)
9.5.2 Africa
9.5.2.1 Trends Analysis
9.5.2.2 Africa Non-alcoholic Steatohepatitis Biomarkers Market Estimates and Forecasts, by Country (2020-2032) (USD Billion)
9.5.2.3 Africa Non-alcoholic Steatohepatitis Biomarkers Market Estimates and Forecasts, By Type (2020-2032) (USD Billion)
9.5.2.4 Africa Non-alcoholic Steatohepatitis Biomarkers Market Estimates and Forecasts, By End-use (2020-2032) (USD Billion)
9.5.2.5 South Africa
9.5.2.5.1 South Africa Non-alcoholic Steatohepatitis Biomarkers Market Estimates and Forecasts, By Type (2020-2032) (USD Billion)
9.5.2.5.2 South Africa Non-alcoholic Steatohepatitis Biomarkers Market Estimates and Forecasts, By End-use (2020-2032) (USD Billion)
9.5.2.6 Nigeria
9.5.2.6.1 Nigeria Non-alcoholic Steatohepatitis Biomarkers Market Estimates and Forecasts, By Type (2020-2032) (USD Billion)
9.5.2.6.2 Nigeria Non-alcoholic Steatohepatitis Biomarkers Market Estimates and Forecasts, By End-use (2020-2032) (USD Billion)
9.5.2.7 Rest of Africa
9.5.2.7.1 Rest of Africa Non-alcoholic Steatohepatitis Biomarkers Market Estimates and Forecasts, By Type (2020-2032) (USD Billion)
9.5.2.7.2 Rest of Africa Non-alcoholic Steatohepatitis Biomarkers Market Estimates and Forecasts, By End-use (2020-2032) (USD Billion)
9.6 Latin America
9.6.1 Trends Analysis
9.6.2 Latin America Non-alcoholic Steatohepatitis Biomarkers Market Estimates and Forecasts, by Country (2020-2032) (USD Billion)
9.6.3 Latin America Non-alcoholic Steatohepatitis Biomarkers Market Estimates and Forecasts, By Type (2020-2032) (USD Billion)
9.6.4 Latin America Non-alcoholic Steatohepatitis Biomarkers Market Estimates and Forecasts, By End-use (2020-2032) (USD Billion)
9.6.5 Brazil
9.6.5.1 Brazil Non-alcoholic Steatohepatitis Biomarkers Market Estimates and Forecasts, By Type (2020-2032) (USD Billion)
9.6.5.2 Brazil Non-alcoholic Steatohepatitis Biomarkers Market Estimates and Forecasts, By End-use (2020-2032) (USD Billion)
9.6.6 Argentina
9.6.6.1 Argentina Non-alcoholic Steatohepatitis Biomarkers Market Estimates and Forecasts, By Type (2020-2032) (USD Billion)
9.6.6.2 Argentina Non-alcoholic Steatohepatitis Biomarkers Market Estimates and Forecasts, By End-use (2020-2032) (USD Billion)
9.6.7 Colombia
9.6.7.1 Colombia Non-alcoholic Steatohepatitis Biomarkers Market Estimates and Forecasts, By Type (2020-2032) (USD Billion)
9.6.7.2 Colombia Non-alcoholic Steatohepatitis Biomarkers Market Estimates and Forecasts, By End-use (2020-2032) (USD Billion)
9.6.8 Rest of Latin America
9.6.8.1 Rest of Latin America Non-alcoholic Steatohepatitis Biomarkers Market Estimates and Forecasts, By Type (2020-2032) (USD Billion)
9.6.8.2 Rest of Latin America Non-alcoholic Steatohepatitis Biomarkers Market Estimates and Forecasts, By End-use (2020-2032) (USD Billion)
10. Company Profiles
10.1 GENFIT
10.1.1 Company Overview
10.1.2 Financial
10.1.3 Products/ Services Offered
110.1.4 SWOT Analysis
10.2 Gilead Sciences
10.2.1 Company Overview
10.2.2 Financial
10.2.3 Products/ Services Offered
10.2.4 SWOT Analysis
10.3 AstraZeneca
10.3.1 Company Overview
10.3.2 Financial
10.3.3 Products/ Services Offered
10.3.4 SWOT Analysis
10.4 Novartis AG
10.4.1 Company Overview
10.4.2 Financial
10.4.3 Products/ Services Offered
10.4.4 SWOT Analysis
10.5 GE Healthcare
10.5.1 Company Overview
10.5.2 Financial
10.5.3 Products/ Services Offered
10.5.4 SWOT Analysis
10.6 Siemens Healthineers
10.6.1 Company Overview
10.6.2 Financial
10.6.3 Products/ Services Offered
10.6.4 SWOT Analysis
10.7 Bristol-Myers Squibb
10.7.1 Company Overview
10.7.2 Financial
10.7.3 Products/ Services Offered
10.7.4 SWOT Analysis
10.8 Pfizer Inc.
10.8.1 Company Overview
10.8.2 Financial
10.8.3 Products/ Services Offered
10.8.4 SWOT Analysis
10.9 Akero Therapeutics
10.9.1 Company Overview
10.9.2 Financial
10.9.3 Products/ Services Offered
10.9.4 SWOT Analysis
10.10 89bio
10.9.1 Company Overview
10.9.2 Financial
10.9.3 Products/ Services Offered
10.9.4 SWOT Analysis
11. Use Cases and Best Practices
12. Conclusion
An accurate research report requires proper strategizing as well as implementation. There are multiple factors involved in the completion of good and accurate research report and selecting the best methodology to compete the research is the toughest part. Since the research reports we provide play a crucial role in any company’s decision-making process, therefore we at SNS Insider always believe that we should choose the best method which gives us results closer to reality. This allows us to reach at a stage wherein we can provide our clients best and accurate investment to output ratio.
Each report that we prepare takes a timeframe of 350-400 business hours for production. Starting from the selection of titles through a couple of in-depth brain storming session to the final QC process before uploading our titles on our website we dedicate around 350 working hours. The titles are selected based on their current market cap and the foreseen CAGR and growth.
The 5 steps process:
Step 1: Secondary Research:
Secondary Research or Desk Research is as the name suggests is a research process wherein, we collect data through the readily available information. In this process we use various paid and unpaid databases which our team has access to and gather data through the same. This includes examining of listed companies’ annual reports, Journals, SEC filling etc. Apart from this our team has access to various associations across the globe across different industries. Lastly, we have exchange relationships with various university as well as individual libraries.

Step 2: Primary Research
When we talk about primary research, it is a type of study in which the researchers collect relevant data samples directly, rather than relying on previously collected data. This type of research is focused on gaining content specific facts that can be sued to solve specific problems. Since the collected data is fresh and first hand therefore it makes the study more accurate and genuine.
We at SNS Insider have divided Primary Research into 2 parts.
Part 1 wherein we interview the KOLs of major players as well as the upcoming ones across various geographic regions. This allows us to have their view over the market scenario and acts as an important tool to come closer to the accurate market numbers. As many as 45 paid and unpaid primary interviews are taken from both the demand and supply side of the industry to make sure we land at an accurate judgement and analysis of the market.
This step involves the triangulation of data wherein our team analyses the interview transcripts, online survey responses and observation of on filed participants. The below mentioned chart should give a better understanding of the part 1 of the primary interview.

Part 2: In this part of primary research the data collected via secondary research and the part 1 of the primary research is validated with the interviews from individual consultants and subject matter experts.
Consultants are those set of people who have at least 12 years of experience and expertise within the industry whereas Subject Matter Experts are those with at least 15 years of experience behind their back within the same space. The data with the help of two main processes i.e., FGDs (Focused Group Discussions) and IDs (Individual Discussions). This gives us a 3rd party nonbiased primary view of the market scenario making it a more dependable one while collation of the data pointers.
Step 3: Data Bank Validation
Once all the information is collected via primary and secondary sources, we run that information for data validation. At our intelligence centre our research heads track a lot of information related to the market which includes the quarterly reports, the daily stock prices, and other relevant information. Our data bank server gets updated every fortnight and that is how the information which we collected using our primary and secondary information is revalidated in real time.

Step 4: QA/QC Process
After all the data collection and validation our team does a final level of quality check and quality assurance to get rid of any unwanted or undesired mistakes. This might include but not limited to getting rid of the any typos, duplication of numbers or missing of any important information. The people involved in this process include technical content writers, research heads and graphics people. Once this process is completed the title gets uploader on our platform for our clients to read it.
Step 5: Final QC/QA Process:
This is the last process and comes when the client has ordered the study. In this process a final QA/QC is done before the study is emailed to the client. Since we believe in giving our clients a good experience of our research studies, therefore, to make sure that we do not lack at our end in any way humanly possible we do a final round of quality check and then dispatch the study to the client.
By Type
Serum Biomarkers
Oxidative Stress Biomarkers
Hepatic Fibrosis Biomarkers
Apoptosis Biomarkers
Others
By End-use
Pharma & CRO Industry
Diagnostic Labs
Hospitals
Academic Research Institutes
Request for Segment Customization as per your Business Requirement: Segment Customization Request
Regional Coverage:
North America
US
Canada
Mexico
Europe
Eastern Europe
Poland
Romania
Hungary
Turkey
Rest of Eastern Europe
Western Europe
Germany
France
UK
Italy
Spain
Netherlands
Switzerland
Austria
Rest of Western Europe
Asia Pacific
China
India
Japan
South Korea
Vietnam
Singapore
Australia
Rest of Asia Pacific
Middle East & Africa
Middle East
UAE
Egypt
Saudi Arabia
Qatar
Rest of Middle East
Africa
Nigeria
South Africa
Rest of Africa
Latin America
Brazil
Argentina
Colombia
Rest of Latin America
Request for Country Level Research Report: Country Level Customization Request
Available Customization
With the given market data, SNS Insider offers customization as per the company’s specific needs. The following customization options are available for the report:
Detailed Volume Analysis
Criss-Cross segment analysis (e.g. Product X Application)
Competitive Product Benchmarking
Geographic Analysis
Additional countries in any of the regions
Customized Data Representation
Detailed analysis and profiling of additional market players
The Type 1 Diabetes Market Size was valued at USD 32.3 billion in 2023 and is expected to reach $63.5 billion by 2032 and grow at a CAGR of 7.82% by 2024-2032.
The U.S. Healthcare Payer Services Market Size was valued at USD 34.29 Billion in 2023 and is witness to reach USD 65.31 Billion by 2032 and grow at a CAGR of 7.74% over the forecast period 2024-2032.
The Artificial Heart Market was valued at USD 2.87 billion in 2023 and is expected to reach USD 7.55 billion by 2032, growing at a CAGR of 11.36% over the forecast period of 2024-2032.
The Veterinary Vaccines Market size was valued at USD 8.5 Billion in 2023 and is expected to reach USD 14.5 Billion By 2032 and grow at a CAGR of 6% over the forecast period of 2024-2032.
The D-dimer Testing Market was valued at USD 1.83 billion in 2023 and is expected to reach USD 2.74 billion by 2032, growing at a CAGR of 4.59% over the forecast period 2024-2032.
The Blood Grouping Reagents Market size was estimated at USD 1.97 billion in 2023 and is expected to reach USD 3.92 billion by 2032 at a CAGR of 7.97% during the forecast period of 2024-2032.

Hi! Click one of our member below to chat on Phone
© 2025 All Rights Reserved by SNS Insider Pvt Ltd


